1. Introduction
Grain size is an important characteristic of snow and is relevant in a variety of earth science domains such as the snow metamorphism (Reference ColbeckColbeck 1983, Reference Colbeck1998; Reference Brun, David, Sudul and BrunotBrun and others, 1992), albedo calculation (e.g. Reference WarrenWarren, 1982; Reference Flanner and ZenderFlanner and Zender, 2006), chemistry and photochemistry of snow-covered surfaces (e.g. Reference Domine and ShepsonDomine and Shepson, 2002) and optical and microwave remote sensing (e.g. Reference ZwallyZwally, 1977; Reference AlleyAlley, 1987b; Reference Nolin and DozierNolin and Dozier, 2000; Reference Brucker, Picard and FilyBrucker and others, 2010). Although grain size is an intuitive and visible characteristic of snow, it is difficult to quantify due to the complexity of the snow microstructure. Several metrics of grain size have been introduced such as maximal extent of dominant grains, mean cross-sectional area of crystals or grains (e.g. Reference GowGow, 1969), stereologic quantities derived from standard metallographic techniques (e.g. Reference AlleyAlley, 1987b; Reference Arnaud, Gay, Barnola and DuvalArnaud and others, 1998), optical radius (Reference Grenfell and WarrenGrenfell and Warren 1999), mean convex radius (e.g. Reference ColbeckColbeck and others, 1990; Reference Gay, Fily, Genthon, Frezzotti, Oerter and WintherGay and others, 2002) or correlation length (e.g. Reference MätzlerMätzler, 2002). For instance, the correlation length is specifically used in microwave remote sensing (Reference Wiesmann, Mätzler and WeiseWiesmann and others, 1998), and the optical radius in optical remote sensing or in snow albedo calculation (Reference WarrenWarren, 1982; Reference Grenfell and WarrenGrenfell and Warren, 1999). Estimation of the maximum extent by visual inspection of selected grains (Reference ColbeckColbeck and others, 1990) is a common practice in the field but suffers from the subjective selection of the grains and is often imprecise. Furthermore, this metric does not appear explicitly in physically based models of metamorphism, optical properties, microwave scattering or snow chemistry. This limits a precise validation of these models. A physically useful and measurable metrics of the grain size appears to be a prerequisite for future improvement of the snow models in several domains.
The specific surface area (SSA) of snow is defined as the surface area of the air/ice interface per unit mass (Reference DomineDomine and others, 2008) which is a well-defined property for porous media. It does not require the medium to be composed of identifiable grains. The SSA is directly and univocally related to the optical grain radius, r op, by
where ρ ice denotes the density of ice. The correlation length, l, used to interpret microwave remote-sensing data (Reference MätzlerMätzler, 2002) is related to the SSA as shown by Reference Debye, Anderson and BrumbergerDebye and others (1957):
where P snow is the snow density. In addition, the surface area of the air/ice interface is an important factor for the processes involving gas exchanges between the ice and air components, for example the exchange of water vapor responsible for dry snow metamorphism or the adsorption of reactive gases relevant to snow chemistry (Reference Domine and ShepsonDominé and Shepson, 2002).
The SSA can be measured by several techniques using very different principles: adsorption of CH4 on the ice surface (Reference Legagneux, Cabanes and DomineLegagneux and others, 2002; Reference Domine, Taillandier and SimpsonDomine and others, 2007), stereologic measurements on two-dimensional (2-D) images of snow (Reference NaritaNarita, 1971; Reference AlleyAlley, 1987b; Reference Arnaud, Gay, Barnola and DuvalArnaud and others, 1998; Reference Wiesmann, Mätzler and WeiseWiesmann and others, 1998), geometrical computation of X-ray microtomography images (Reference Flin, Brzoska, Lesaffre, Coléou and PieritzFlin and others, 2004; Reference Kerbrat, Pinzer, Huthwelker, Gäggeler, Ammann and SchneebeliKerbrat and others, 2008), and infrared (IR) reflectance measurements (Reference Matzl and SchneebeliMatzl and Schneebeli, 2006; Reference Painter, Molotch, Cassidy, Flanner and SteffenPainter and others, 2007; Reference Gallet, Domine, Zender and PicardGallet and others, 2009). The accuracy of these techniques is probably in the range 10–30%. Concerning the IR techniques, the sensitivity intrinsically depends on the choice of wavelength (Reference Gallet, Domine, Zender and PicardGallet and others, 2009). Moreover, it is still debated whether and to what extent the IR hemispherical-reflectance–SSA relationship depends on grain shape. Theoretical studies based on the investigation of simple geometric shapes indicate a strong dependence (Reference Kokhanovsky and ZegeKokhanovsky and Zege, 2004; Reference Picard, Brucker, Fily, Gallée and KrinnerPicard and others, 2009b). By contrast, experimental studies suggest a weak dependence (Reference Gallet, Domine, Zender and PicardGallet and others, 2009), and the authors suggest that the discrepancy with theoretical studies is probably due to the fact that natural snow always contains a wide variety of shapes, that would average the reflectance–SSA relationships.
The IR techniques developed recently are more rapid than previous methods and easier to apply in the field. Three variants of the IR technique have been developed. Near-infrared (NIR) photography (Reference Matzl and SchneebeliMatzl and Schneebeli, 2006) provides detailed 2-D images of the vertical face of a snow pit in one shot, but requires a tight control of the illumination and the wall surface needs to be perfectly planar. It utilizes wavelengths around 850 nm for which the sensitivity to SSA is not optimal in the typical SSA range, 10–50 m2 kg−1 (Reference Domine, Salvatori, Legagneux, Salzano, Fily and CasacchiaDomine and others, 2006; Reference Gallet, Domine, Zender and PicardGallet and others, 2009). Careful calibration of the images is therefore required to retrieve reflectances with sufficient precision. The spectroscopy technique (Reference Painter, Molotch, Cassidy, Flanner and SteffenPainter and others, 2007) uses the detailed reflectance spectrum around the absorption line at 1030 nm instead of a single wavelength as in the other techniques. It is thus probably less sensitive to inaccuracies in the reflectance measurement, irregularities of the snow surface, or influence of the grain shape, but the lack of evaluation with independent measurements of SSA or optical radius prevents any conclusion so far. The DUFISSS (DUal-Frequency Integrating Sphere for Snow SSA) instrument (Reference Gallet, Domine, Zender and PicardGallet and others, 2009) measures reflectances with high reproducibility (∼1%) at 1310 nm due to the illumination control provided by a laser diode and the use of an integrating sphere to obtain the hemispherical reflectance. Furthermore, the SSA values given by DUFISSS were calibrated with the well-established methane adsorption technique (Reference Legagneux, Cabanes and DomineLegagneux and others, 2002; Reference Domine, Taillandier and SimpsonDomine and others, 2007), with the result that, according to those authors, DUFISSS has an absolute accuracy of 10–12%, depending on the SSA value. However, DUFISSS requires snow samples to be collected, which can become critical in certain conditions (e.g. near freezing point or with wind, very light snow or hard crusts; see discussion in Reference Gallet, Domine, Zender and PicardGallet and others, 2009).
These three techniques have been developed to measure SSA in shallow snowpacks (typically 2–3 m deep) in the European Alps or the Arctic but are not easily scalable to deep snowpacks such as on ice sheets or glaciers. NIR photography and DUFISSS have been applied at Dome C, Antarctica, respectively in a 3 m deep snow pit in 2006 (Reference BruckerBrucker and others, 2011) and a 5 m deep snow pit in 2008 (Reference Gallet, Domine, Arnaud, Picard and SavarinoGallet and others, 2010). However, several days of work were necessary for each snow pit, and depths of 3–5 m are still insufficient for some applications such as microwave remote sensing. Indeed, the e-folding depth of microwaves is ∼4 m at 19 GHz, 10 m at 10 GHz and >20 m at 6.6 GHz (Reference SurdykSurdyk, 2002; Reference Picard, Arnaud, Domine and FilyPicard and others, 2009a), so the need for SSA profiles down to 10 m or more is strong. Furthermore, SSA measurements are needed down to 20 m or more to estimate the pore size as used in firn structural description and densification models (Reference AlleyAlley, 1987a; Reference Arnaud, Gay, Barnola and DuvalArnaud and others, 1998).
To overcome the limitations of current instruments, we have designed an instrument called POSSSUM (Profiler Of Snow Specific Surface area Using SWIR reflectance Measurement) dedicated to measuring SSA profiles in holes drilled to 20 m depth with a vertical resolution of ∼10 mm. POSSSUM is based on the same principle as the other IR techniques and measures the reflectance of the snow in the shortwave IR (SWIR) domain. The instrument is optimized for rapid acquisition of SSA profiles (20 min for 2 m, 1.5 hours for 20 m) so that it is possible to investigate the horizontal variability of deep snowpacks by performing several adjacent profiles on the same day. In addition, the possibility of measurements in a drilled hole (∼100 mm in diameter) instead of a snow pit (1–2 m wide) reduces the area perturbed by the operations and thus is more suitable for repetitive measurements over time to monitor SSA evolution.
In section 2 of this paper, the POSSSUM instrument and field operations are described. In section 3 we present the processing algorithm for estimating the SSA from photodiode measurements. In section 4 the validation is performed at two levels: IR reflectance comparison with the DUFISSS instrument and direct evaluation with independent SSA measurements using methane adsorption.
2. Description of Posssum
2.1. General design
Figure 1a gives an overview of the experimental set-up: POSSSUM, the snow drill device, the data acquisition system, the tripod, the winch, the depth measurement system and the power supply.
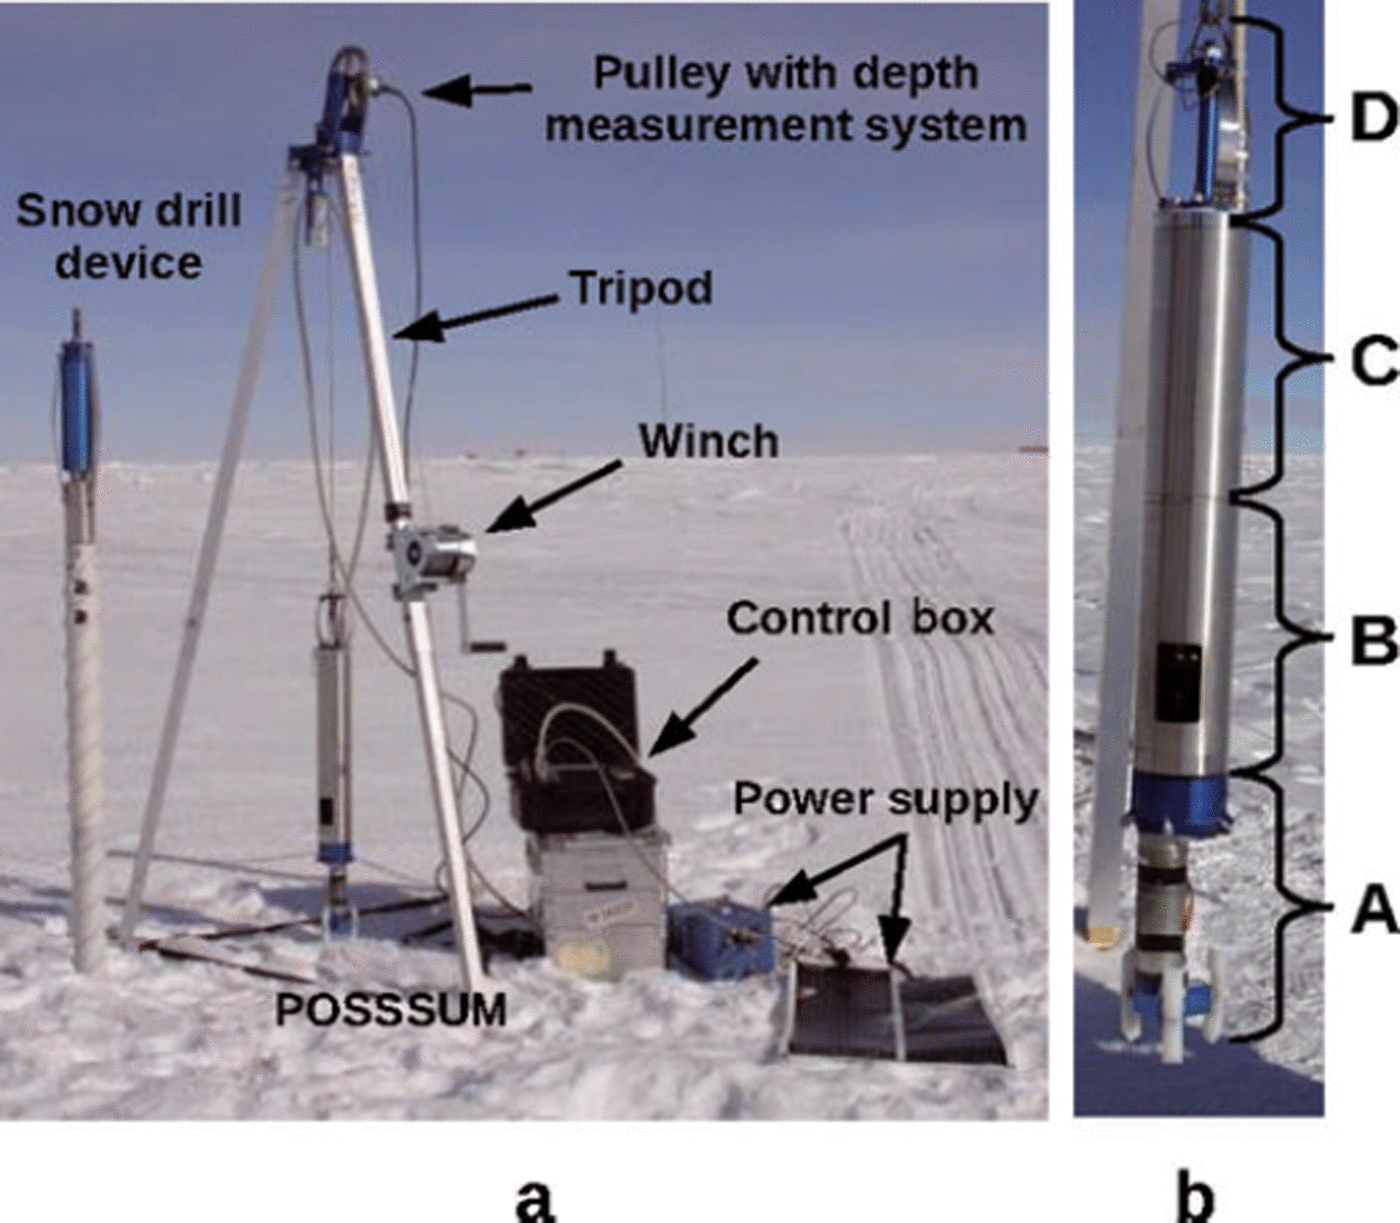
Fig. 1. (a) Experimental set-up in the field with POSSSUM, the snow drill device, the tripod with a manual winch and a depth system measurement, the data acquisition system and the power supply. (b) Picture of POSSSUM which is composed of a bore with a guiding system (A), an optical measurement part with laser diodes and photodiodes (B), an electronic part for laser drivers and photodiode amplifiers (C) and anti-torque system (D).
POSSSUM is a cylinder of diameter 100 mm and height 1 m. It weights nearly 20 kg. It is composed of four main parts (Fig. 1b). The lowest part (A) rebores the 100 mm diameter hole made by the snow drill. This is necessary to obtain a clean cylindrical surface with an accurate diameter (126 mm). In addition, it removes snow that may have already metamorphosed between the drilling and the measurement (especially when air or snow temperatures are close to the freezing point). A first anti-torque and guiding system is placed at the bottom extremity of POSSSUM. The optics part (B) is located above part A and is described in detail in section 2.2. The measurement window is centered exactly 250 mm above the bottom of the instrument, so no measurements can be taken in the lower 250 mm of the hole. The electronic part (C) includes the laser drivers and the photodiode amplifiers. The main anti-torque system is placed at the top (D) and prevents rotation when boring hard snow.
POSSSUM is anchored to a tripod with a 25 m long cable. The pulley is equipped with a pulse encoder to measure the depth with a resolution better than 1 mm, and the overall vertical positioning accuracy is 1 mm for a 2 m deep hole. The power is supplied by a rechargeable lead battery pack (12 V, 30 Ah) and two flexible solar panels.
2.2. Optical system
Figure 2 gives a schematic view of the optical head (the light sources, mirror, the crown with photodiodes and metallic cylinder housing these optical components).
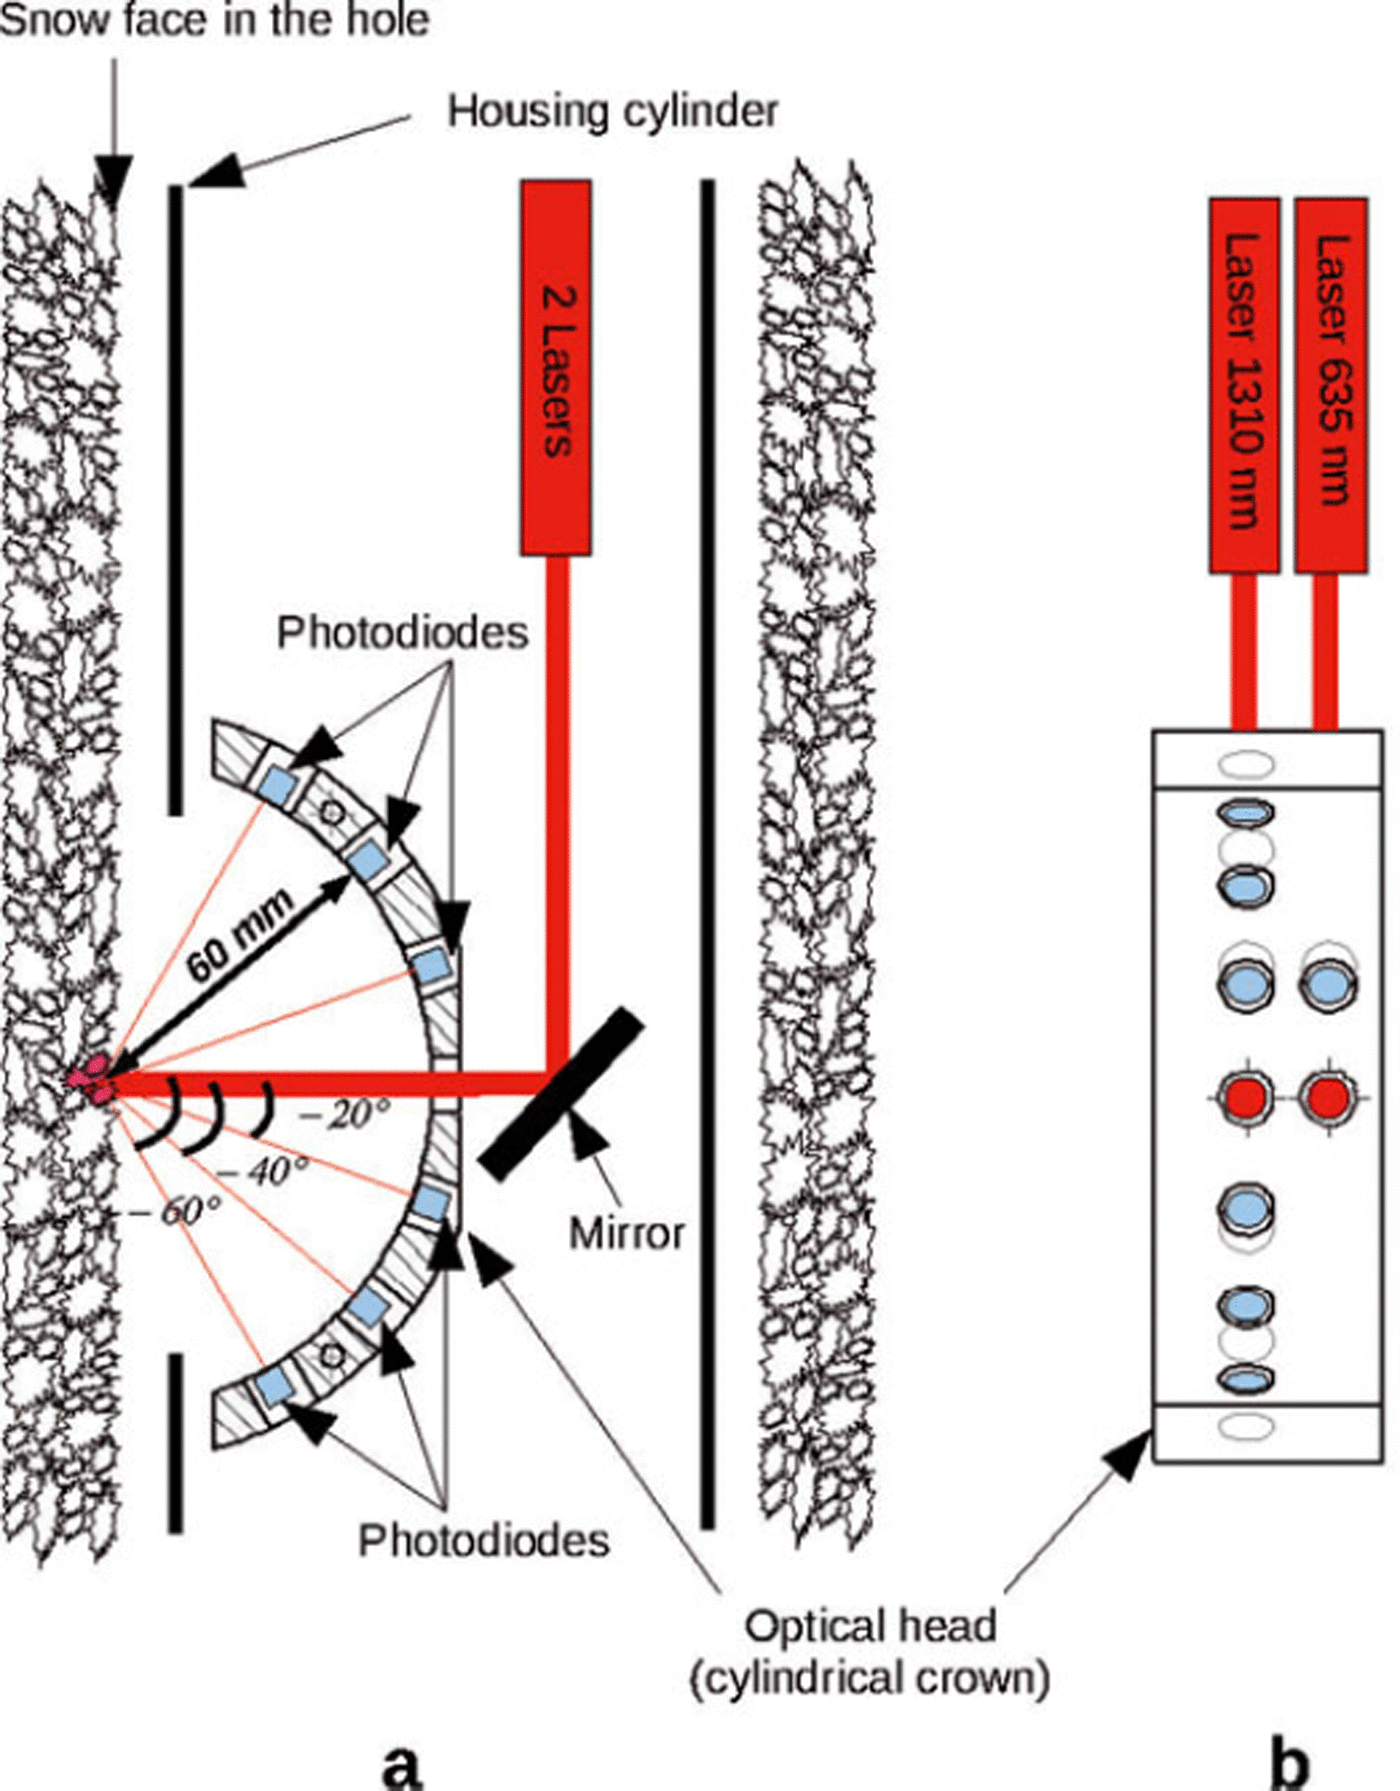
Fig. 2. Schematic view of the optical system of POSSSUM showing the relative positions of illumination source (laser) and reflectance measurements (photodiodes): (a) side view; (b) front view, in the axis of the illuminating beam.
To prevent multiple scattering within the optical head or between the optical head and the snow, all metallic parts and housing internal surface were painted black. The illumination source is an IR laser diode at 1310 nm (Mitsubishi ML725B8F) with a nominal power of 6 mW. The beam emerging from the diode is collimated, reflected at 90° by a mirror and goes straight to the snow, passing through an aperture in the external cylinder. The aperture is not closed by a glaze, to avoid undesired reflections, and is far enough from the snow to avoid snow grains falling into the optical part of the instrument. The beam is perpendicular to the snow surface, and the footprint is ∼10 mm in diameter. Radiation is scattered back by the snow and collected by six InGaAs photodiodes at different viewing zenith angles: ±60°, ±40° and ±20° (note, by convention, zenith angles are relative to the horizontal incident beam and are positive upward and negative downward). Even though estimating SSA from biconical rather than hemispherical reflectance is intrinsically less accurate (e.g. Reference Grenfell and WarrenGrenfell and Warren 1999), our choice is driven by the geometric constraints of operating in a drilled hole of 126 mm. Photodiodes are located on a crown having a radius of 60 mm. For ideal operation, the illuminated surface should be at the center of curvature of the crown, which implies a precise distance of 13 mm between the external cylinder housing and the snow surface (see Fig. 2).
To deduce accurate reflectances from these measurements, there are two important requirements: (1) the snow face must be smooth and perpendicular to the incident laser beam, and (2) the distance between the photodiodes and the snow must be known with an accuracy of ∼1 mm. Therefore, in addition to the IR measurements, we use red (635 nm) radiation to infer the distance between the photodiodes and the snow (see section 3 for details). The 635 nm laser diode (Hitachi HL6335G) is located parallel to the IR laser, 12 mm further horizontally (Fig. 2). The footprint is 10 mm wide. The emission of both lasers is stabilized and power-regulated using the photodiode built into the lasers. In addition, the lasers are modulated as described below. The scattered light in the red channel is received by a silicon photodiode at +20° zenith angle. The current generated by each photodiode is converted into voltage and amplified by a two-stage amplifier including an ultra-low-bias current operational preamplifier and a high-precision instrumentation amplifier. The digitalization is performed at the surface by a Campbell® data acquisition system (CR3000) with 16-bit resolution. POSSSUM is linked to the acquisition system by a low-noise cable with 12 twisted pair wires. Tests at temperatures from 0°C to −55°C showed correct operation, with negligible drift of the measurement and noise not exceeding the accuracy of the acquisition. In addition, a Pt100 sensor monitors the temperature of the system during measurements.
2.3. Measurement procedure
The Campbell CR3000® sequences the acquisition at a rate of 10 Hz which corresponds to a vertical resolution of 1 mm for a descent speed of 10 mm s−1. Each acquisition cycle comprises the following sequence:
-
1. IR laser on, measurement of the IR photodiodes.
-
2. Red laser on, measurement of the visible photodiode.
-
3. Both lasers off, measurement of all the photodiodes.
-
4. Measurement of the instrument temperature and reading of the depth from the pulse encoder.
The measurements when the lasers are off are used to subtract the background caused by solar illumination transmitted through snow and the inevitable gap between the cylindrical housing of POSSSUM and the hole (∼10–20 mm).
2.4. Field operation
The typical protocol includes two main steps: drilling the hole and lowering POSSSUM. For seasonal snowpacks 1–2 m deep, a PICO (Polar Ice Coring Office) hand-coring auger or a home-made ‘punch’ has been used to drill holes with diameters of 100–120 mm. For deeper applications in Antarctica, a new field-portable system for snow core drilling has been developed at the Laboratoire de Glaciologie et Géophysique de l’Environnement (LGGE) (Fig. 1a).
POSSSUM is then lowered at a speed of ∼10 mm s−1 with a manual winch, during which the hole is rebored to 126 mm diameter. With such a speed, one cycle of measurement is performed every millimeter, allowing a significant over-sampling within the laser footprint of 10 mm. During acquisition in the top 40 cm, the hole needs to be obstructed by a board (∼40 cm wide) to protect the measurement from intense solar illumination that may saturate the amplifier and prevent subtraction of the background. In practice, depending upon solar conditions and the fitting of the board, the red measurements are saturated only in the top 4 cm below the surface. The IR measurements are not affected by the saturation, but subtraction of the background is essential.
When POSSSUM is raised, measurements can also be made, but large movements of the instrument in the hole are now possible because the hole diameter was enlarged by the bore during the descent. This second acquisition proved useful for the method validation (see section 3).
3. Processing Algorithm
The processing algorithm includes different stages: the calibration to convert voltage measurements into bidirectional reflectance, the correction of the distance variations between the optical system and the snow face, and finally the conversion from bidirectional reflectance to SSA. Note that reflectances measured with POSSSUM are biconical reflectances and not true bidirectional reflectances, which denote only a conceptual quantity (Reference NicodemusNicodemus, 1970; Reference Schaepman-Strub, Schaepman, Painter, Dangel and MartonchikSchaepman-Strub and others, 2006). However, as the fieldof-view of the photodiode is small and the incoming radiation is well collimated, the reflectances measured by our instrument are very close to bidirectional reflectances. Therefore, the term bidirectional reflectance and the theoretical background associated with this concept will be used in what follows.
3.1. Reflectance calibration
This step is intended to convert voltage measurements into calibrated bidirectional reflectances. It is important to note that we assume here that the distance between optical head and snow is ideal, i.e. the convergence point of the six photodiodes is located exactly at the snow surface. In such a case, the snow surface is 60 mm from the photodiodes and 13 mm from the cylindrical housing (see Fig. 2). The case of non-ideal distance is treated in section 3.4.
The bidirectional reflectance, Rλ
(θ
0), is related to the voltage, Uλ
(θ
0), measured by the photodiode (θ
0 is the viewing zenith angle and λ is the wavelength of the laser) and the background ![]() measured when both lasers are off as follows:
measured when both lasers are off as follows:

where αλ (θ 0) is the calibration factor. A linear relationship is sufficient because the photodiodes and the amplifiers have a linear response and multiple reflections between the snow surface and the instruments are negligible. The wavelengths of the lasers, 1310 and 635 nm, are respectively written IR and R in subscript in subsequent notation. To determine αλ (θ 0), the calibration protocol consists in placing several reflectance standards (Spectralon®, http://www.sphereoptics.de) in front of the optical head using a dedicated guide machined with accuracy. The guide ensures that the standard is parallel to the vertical axis of the instrument and at the correct distance. However, the azimuth angle (rotation around the vertical axis) was difficult to control. To solve this problem, we performed slow oscillations by hand around the vertical axis while the acquisition was running. The maximum measured signal was taken for the calculation of αλ (θ 0). This calibration protocol was applied several times in the laboratory and in the field. Spanning a period of ∼2 years, these calibrations showed the absence of longterm drift. In addition, tests in a cold chamber down to −60°C showed that no temperature correction was necessary since the thermal drift was <1% in the range of application of the instrument.
Figure 3 shows the amplified signal of the +20° photodiode, U IR(+20°), as a function of the hemispherical reflectance of the reference panels. The response is linear (R 2 = 0.9995) and the offset is negligible (0.4 ± 3.8 mV). The slope of the trend is the inverse of the calibration factor.
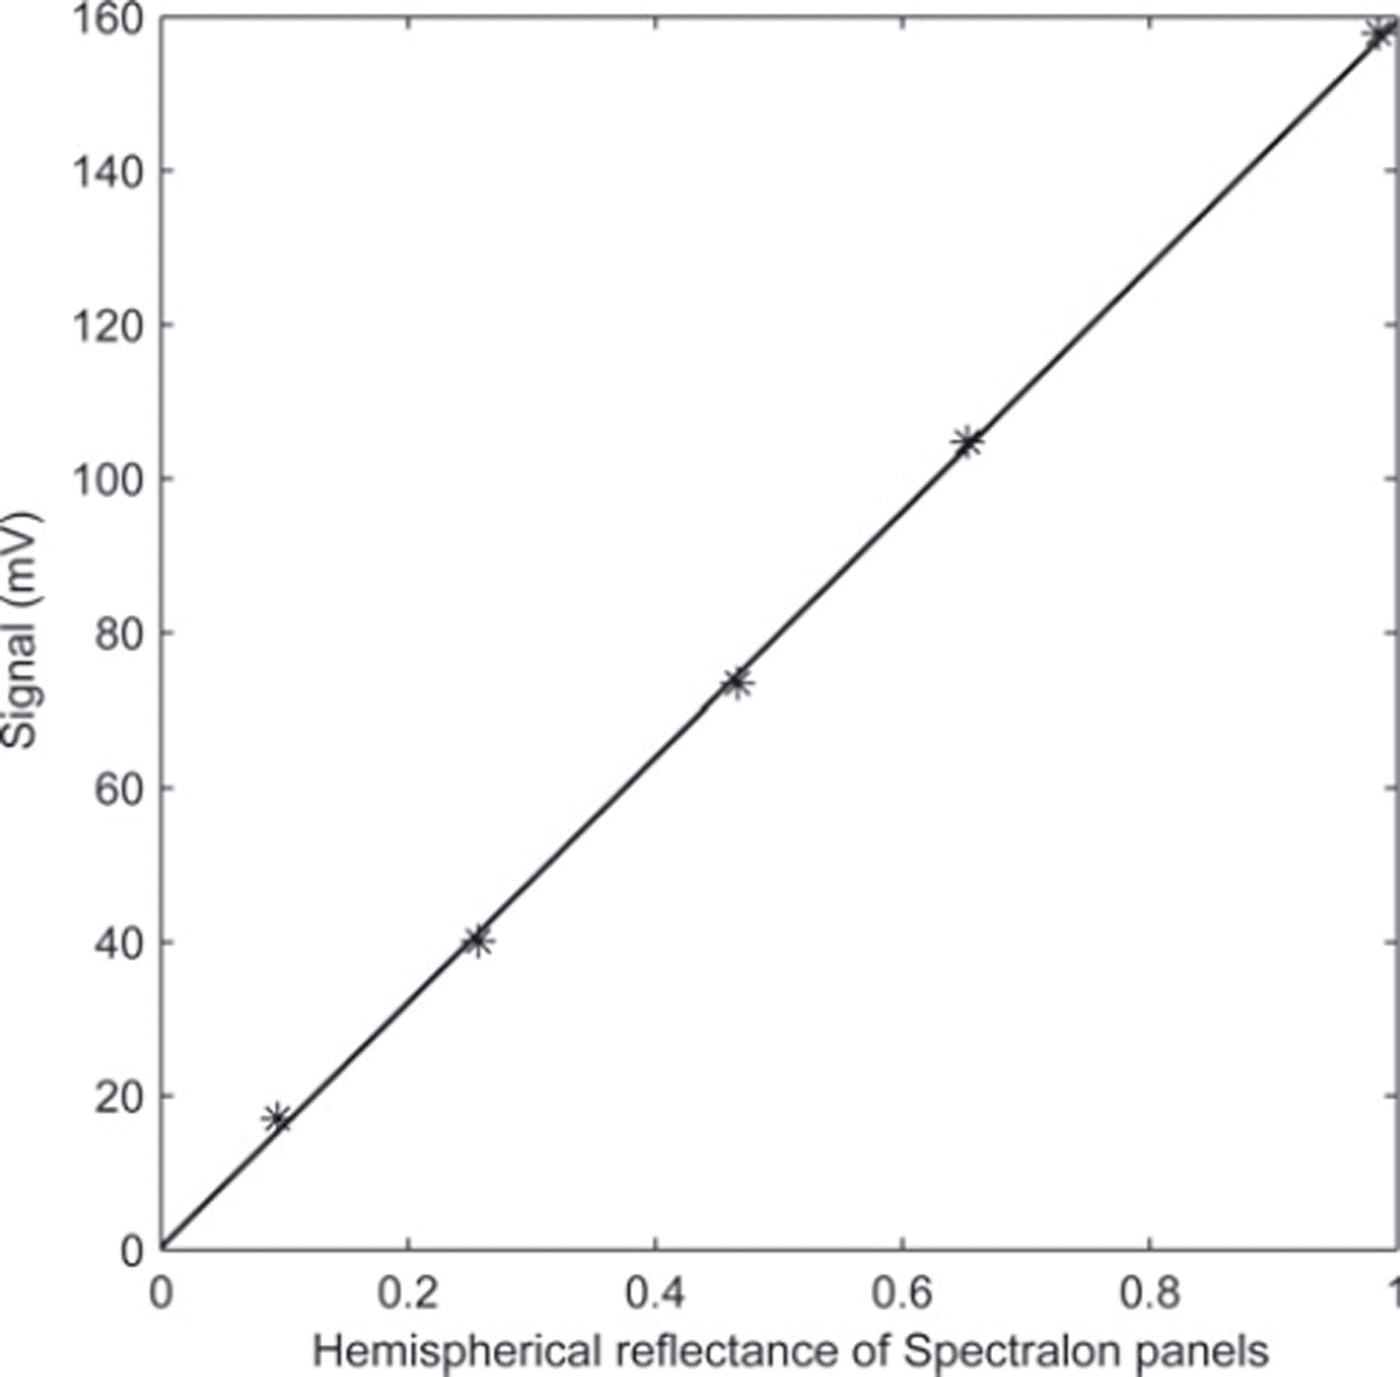
Fig. 3. Measured signal of the +20° photodiode for five different calibration panels. The reflectance of the calibration panels is the hemispherical reflectance at 1310 nm. The trend is the least-square linear regression.
Table 1 shows the mean calibration factor of each photodiode calculated with 42 calibration experiments performed both in the laboratory and in the field. The reproducibility values correspond to a calibration precision of 3–4%, which is small compared to the other sources of error. However, the ±60° photodiodes present a slightly worse reproducibility than the other photodiodes. We also found that the distance effect was difficult to correct for the ±60° photodiodes (see section 3.4). For these two reasons, we decided to exclude them from the final form of our algorithm.
Table 1. Calibration factor for reflectance calculation and reproducibility of each photodiode calculated with 42 different calibration experiments performed both in the laboratory and in the field
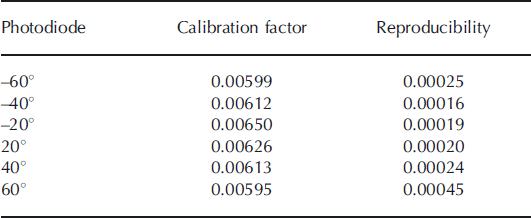
The different calibration factors are relatively close to each other (3% relative standard deviation, close to the reproducibility), with only a weak though visible dependence on the viewing zenith angle.
According to Reference Sandmeier, Müller, Hosgood and AndreoliSandmeier and others (1998), Spectralon standards exhibit a non-Lambertian behavior, at least in the spectral range 450–1000 nm where accurate measurements were performed. To study this effect on our calibration factors, we applied a direction-dependent correction to the reflectance of our standards using the anisotropy factors given by Reference Sandmeier, Müller, Hosgood and AndreoliSandmeier and others (1998) at 1000 nm, which were assumed to be valid at 1310 nm. This led to calibration factors varying much more strongly with zenith angle (9% relative std dev.) than without the correction. We conclude that the Lambertian approximation was more appropriate in our case than the anisotropy factors proposed by Reference Sandmeier, Müller, Hosgood and AndreoliSandmeier and others (1998).
3.2. Conversion from bidirectional to hemispherical reflectances
Existing relationships can be used to convert IR hemispherical reflectance to SSA (see section 3.3). First, however, the bidirectional reflectances need to be converted to hemispherical reflectances, ωλ . The conversion is performed by averaging bidirectional reflectances as follows:

where n is the number of viewing zenith angles θ 0,i and Aλ (θ 0,i ) is the anisotropy factor. For convenience, index i is removed in the following equations. The values of A IR(θ 0) were derived from reflectance measurements over natural snow samples (Reference Dumont, Brissaud, Picard, Schmitt, Gallet and ArnaudDumont and others, 2010), leading to the following equation in the case where the ±60° photodiodes are excluded:

Note that the anisotropy factor predicted by the DISORT (discrete-ordinate radiative transfer code) model (Reference Stamnes, Tsay, Wiscombe and JayaweeraStamnes and others, 1988) is larger than the experimental values used here. This is due to the use of perfectly spherical ice grains to model snow in DISORT. Natural snow is, however, more Lambertian than perfect spheres (Reference Dumont, Brissaud, Picard, Schmitt, Gallet and ArnaudDumont and others, 2010). In order to evaluate the error due to this approximation, we estimate that the anisotropy factors may vary in the range 1–1.04 for natural snow. Hence, the error induced by the anisotropy factor values chosen for Equation (5) is ∼2%. This approximation needs to be addressed in future work, especially by considering snow with highly textured microstructure such as chains of depth hoar.
3.3. Conversion from hemispherical reflectance to SSA
Several relationships exist to convert hemispherical reflectance to SSA based on experiments (Reference Gallet, Domine, Zender and PicardGallet and others, 2009) or theoretical calculations (Reference Kokhanovsky and ZegeKhokanovsky and Zege, 2004; Reference Picard, Brucker, Fily, Gallée and KrinnerPicard and others, 2009b). Since we need a relationship working at different wavelengths (1310 and 635 nm), we use the analytical relationship proposed by Reference Kokhanovsky and ZegeKhokanovsky and Zege (2004) and adapted to direct normal incidence (Reference Picard, Brucker, Fily, Gallée and KrinnerPicard and others, 2009b, equation (4)):

with ![]() , where γλ,, is the ice absorption coefficient at wavelength λ, and n
i is the imaginary part of the ice refraction index (n
i = 1.34 × 10⁻⁷ at 1310 nm, taken from Reference Warren and BrandtWarren and Brandt, 2008). The factor b depends solely on snow grain shape (Reference Picard, Brucker, Fily, Gallée and KrinnerPicard and others, 2009b), and for this study we use b = 4.53 which corresponds to spherical grains. The theoretical studies by Reference Kokhanovsky and ZegeKhokanovsky and Zege (2004) and Reference Picard, Brucker, Fily, Gallée and KrinnerPicard and others (2009b) suggest lower b values. Only the comparison with independent SSA values measured by a non-optical method can validate the choice of this shape factor (see section 4).
, where γλ,, is the ice absorption coefficient at wavelength λ, and n
i is the imaginary part of the ice refraction index (n
i = 1.34 × 10⁻⁷ at 1310 nm, taken from Reference Warren and BrandtWarren and Brandt, 2008). The factor b depends solely on snow grain shape (Reference Picard, Brucker, Fily, Gallée and KrinnerPicard and others, 2009b), and for this study we use b = 4.53 which corresponds to spherical grains. The theoretical studies by Reference Kokhanovsky and ZegeKhokanovsky and Zege (2004) and Reference Picard, Brucker, Fily, Gallée and KrinnerPicard and others (2009b) suggest lower b values. Only the comparison with independent SSA values measured by a non-optical method can validate the choice of this shape factor (see section 4).
3.4. Effect and correction of the distance between snow and optical head
The most important operation for the overall accuracy of POSSSUM is the control and correction of the distance between the snow and the optical head. Indeed, even a moderate 5 mm variation of this distance (8% of 60 mm) – due to horizontal movements of the instrument or to irregularities of the hole diameter – translates into a variation of ∼16% in the estimated reflectance. The conversion of the reflected energy into reflectance depends on the square of the distance between the illuminated area and the photodiodes. In the end, the initial distance variation of 5 mm implies a variation of 16% in SSA or more due to the nonlinearity of Equation (6). To limit this problem, the design of POSSSUM (guiding systems at the top and bottom and boring machine) is intended to keep the distance between the optical head and the snow face constant and equal to 60 mm. However, this control cannot be perfect because the hole is sometimes irregular in snow with weak cohesion. To solve this problem, a second laser diode operating at a wavelength of 635 nm ‘measures’ the distance. The wavelength is chosen to be weakly sensitive to SSA but affected by distance in a manner similar to the 1310 nm wavelength.
To illustrate this effect on the signal measured by the photodiodes, we performed the following experiments in the laboratory: POSSSUM oscillated as a pendulum in front of a snow surface or a reflectance standard (∼50%) positioned vertically. The horizontal shift at the level of the measurement window was between about −12 mm and +12 mm with respect to the ideal distance. The signals recorded by the photodiodes in front of a 50% standard are shown in Figure 4 (open circles). The amplitude of the variations is very large: for instance, U IR(20°) presents variations of ∼60 m V for a mean value of 90 m V, which corresponds to 66% solely due to a distance variation of ±12 mm.
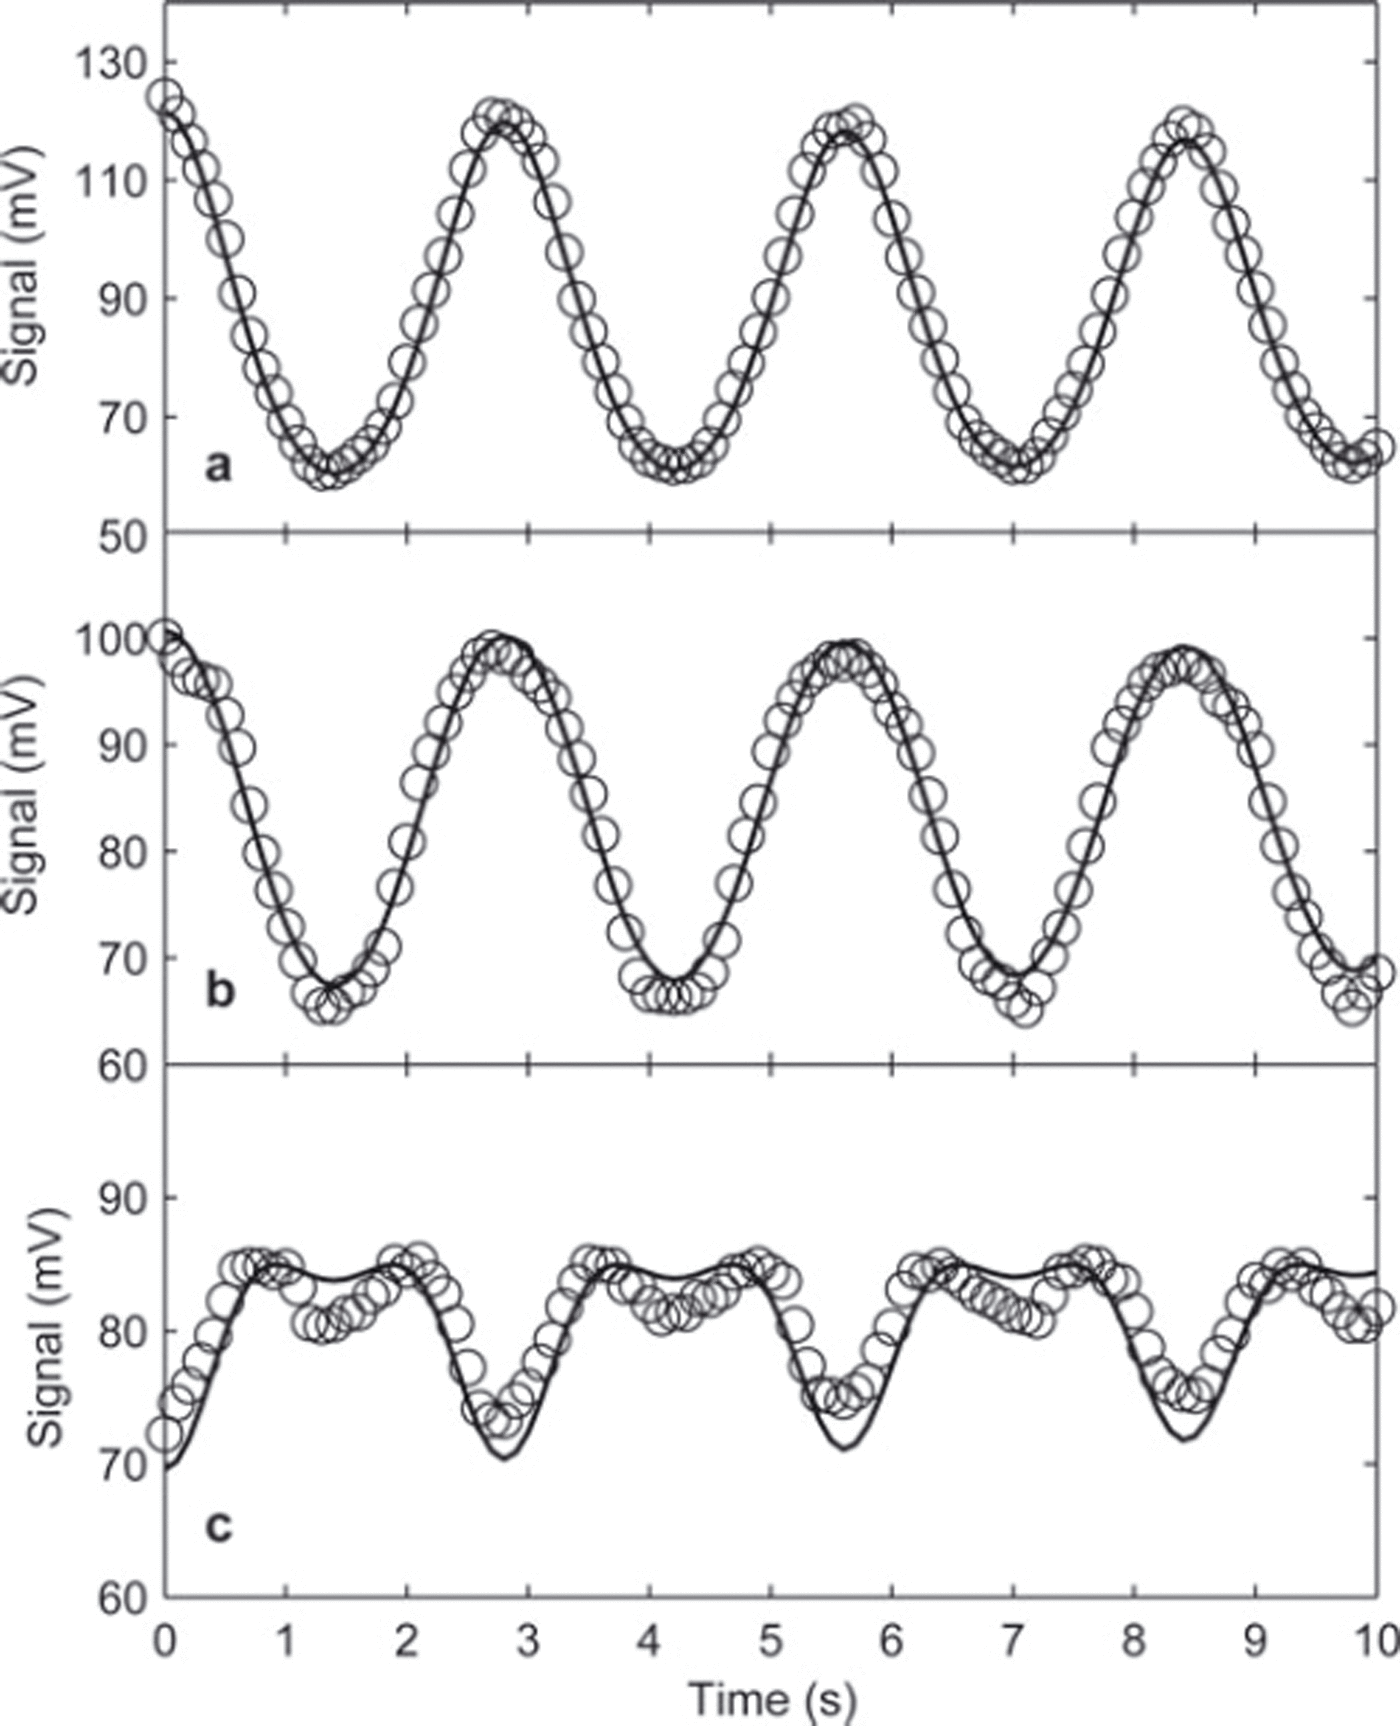
Fig. 4. Effect of the distance between the point of convergence of the photodiodes and the reflecting surface (Spectralon 50%) on the measured signal for the 20° (a), 40° (b) and 60° (c) photodiodes (circles). The horizontal displacement was varied from −12 mm to +12 mm relative to the ideal distance. Signals calculated (solid curves) with Equations (8–11) are compared to the experimental data.
The relationship between the signal and the distance is quite complex as shown in Figure 4. The +20° photodiode shows a nearly sinusoidal oscillation that mimics the oscillation of the distance, whereas the +60° photodiode presents more complex variations. The +40° photodiode presents an intermediate behavior. To better understand these signals and to establish a correction strategy, a geometrical model has been developed.
3.4.1. Modeling the effect of the distance
A simple model based on geometric optics was constructed to quantify the effect of the incorrect position of the snow face with respect to the optical head on the photodiode measurements. It predicts the power, φ λ , received by the photodiodes as a function of the distance between the snow and the point of convergence of the photodiodes. The origin, dy = 0, corresponds to the ideal position.
The geometry of the system, the angles and the distances involved in the calculation are shown in Figure 5a for the ideal position: dy = 0, and then θ = θ 0 ∊ {±20°; ±40°; ±60°} and r 0 = 60 mm; and in Figure 5b for a position which involves a distance correction: dy ≠ 0.
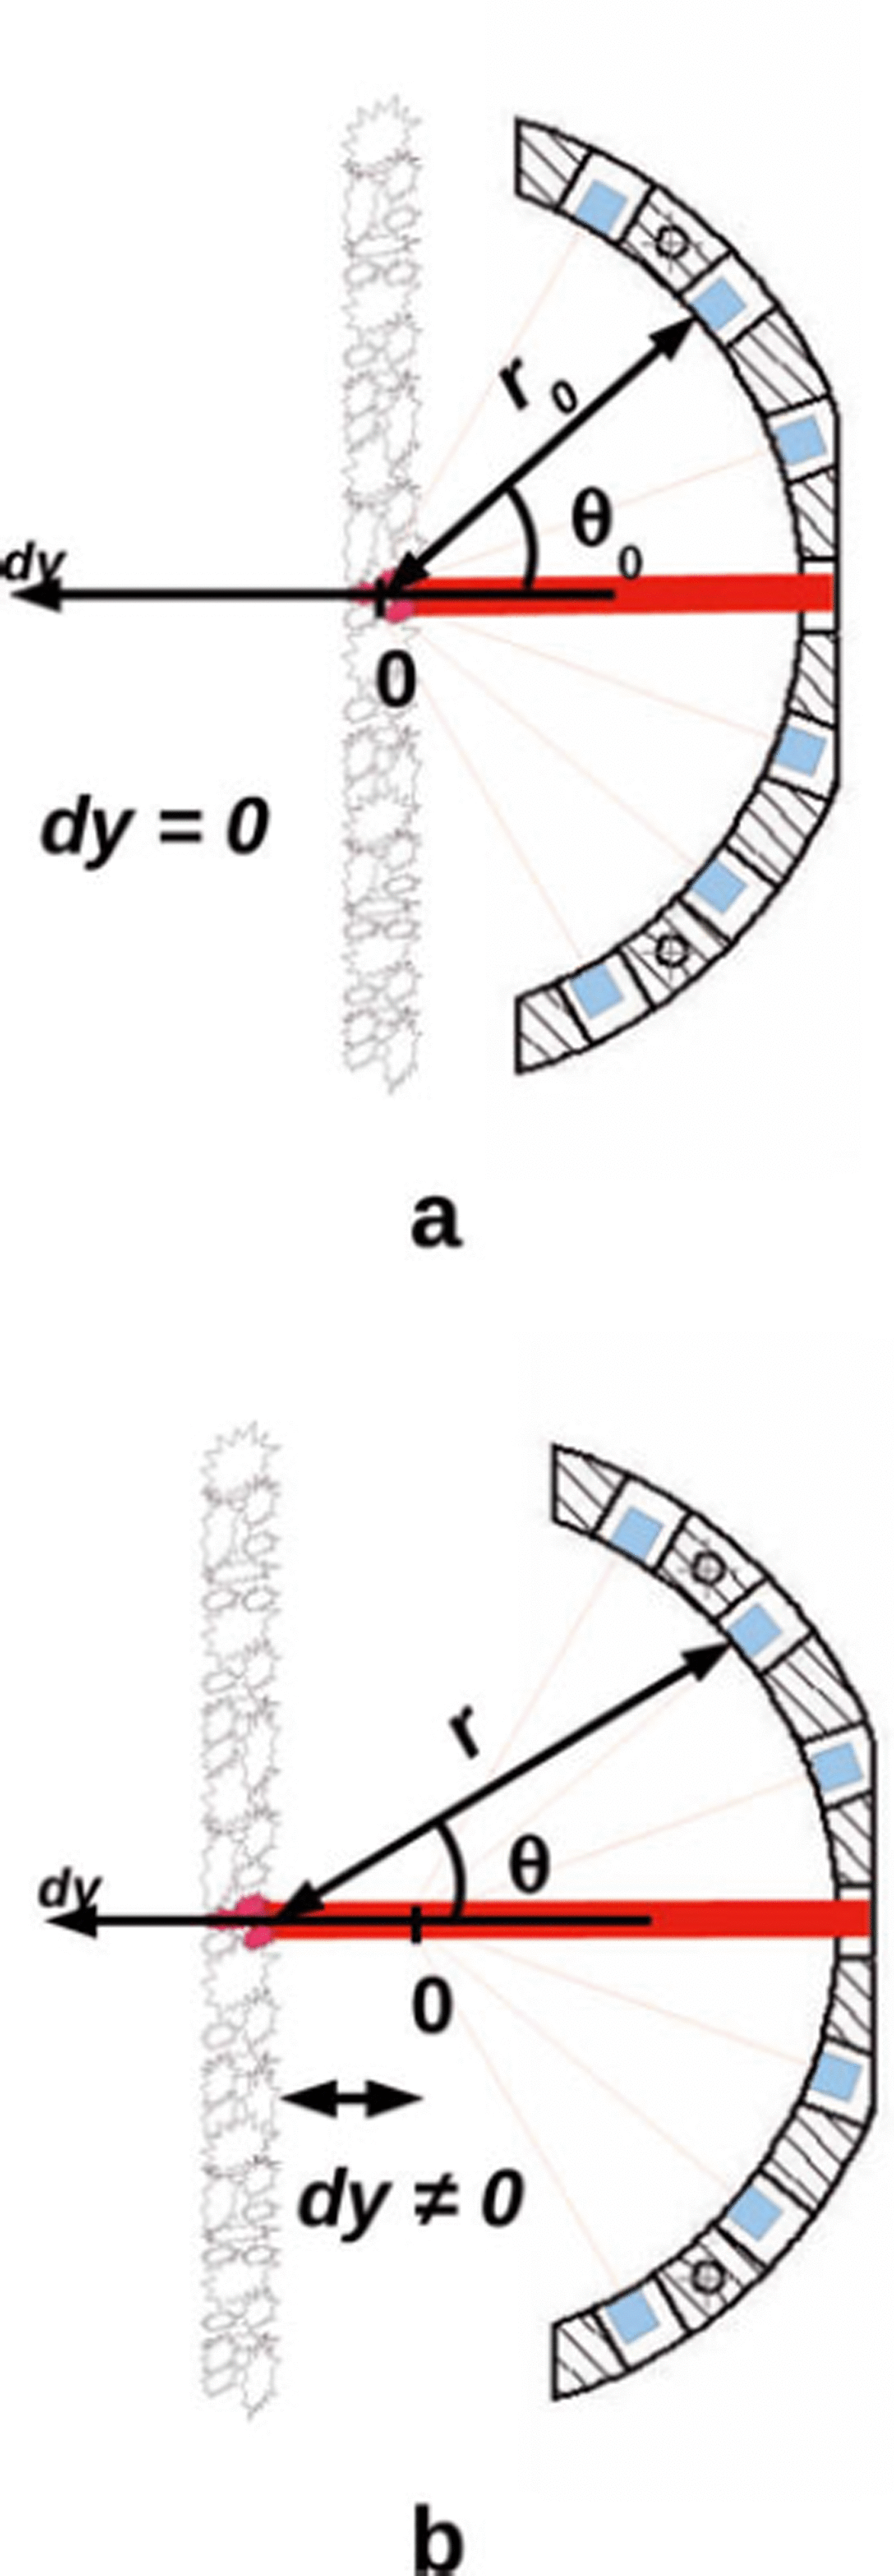
Fig. 5. Two geometrical configurations of POSSSUM’s optical head in the hole and parameters used in the calculation of the power received by the photodiode as a function of the distance dy. (a) dy = 0 ideal position (i.e. no correction needed) and (b) dy ≠ 0 position implying a distance correction.
The model assumes that the laser footprint is infinitely small and that POSSSUM’s vertical axis is parallel to the snow hole axis. Using a more complex model (not described here), we checked that both simplifications have negligible effects. As the model is based only on geometric considerations, it is independent of the wavelength and the reflection is assumed to occur exactly at the surface (i.e. non-scattering medium) which is partially applicable to snow.
The power, ϕλ , received by the photodiode ideally at θ 0 but now at θ is given by
with ![]() , where Iλ
is the incident power at the surface, θ is the viewing zenith angle accounting for the displacement dy, and Rλ
(θ) is the snow bidirectional reflectance at a given wavelength, λ, with nadir incident illumination and viewing zenith angle of θ. In the following, the variations of Rλ
(θ) from θ
0 to θ are neglected, i.e. Rλ
(θ), ≈ Rλ
(θ
0). Ω is the viewing solid angle, s is the sensitive surface area of the photodiode and r is the actual distance between the surface and the photodiode. If we consider a displacement of dy along the y-axis, Iλ
and s are constant and only r and θ vary with dy. These quantities are given by
, where Iλ
is the incident power at the surface, θ is the viewing zenith angle accounting for the displacement dy, and Rλ
(θ) is the snow bidirectional reflectance at a given wavelength, λ, with nadir incident illumination and viewing zenith angle of θ. In the following, the variations of Rλ
(θ) from θ
0 to θ are neglected, i.e. Rλ
(θ), ≈ Rλ
(θ
0). Ω is the viewing solid angle, s is the sensitive surface area of the photodiode and r is the actual distance between the surface and the photodiode. If we consider a displacement of dy along the y-axis, Iλ
and s are constant and only r and θ vary with dy. These quantities are given by
Combining Equations (8) and (9) yields:

The voltage measured at the output of the amplifiers connected to the photodiodes is directly proportional to ϕλ
(θ
0, dy). We denote ![]() ‘the measured uncorrected reflectance’ based on Equation (3) but with dy ≠ 0:
‘the measured uncorrected reflectance’ based on Equation (3) but with dy ≠ 0:
![]() is equal to the actual (unknown) reflectance, R
λ(θ0), only for the ideal position dy = 0:
is equal to the actual (unknown) reflectance, R
λ(θ0), only for the ideal position dy = 0: ![]() . Equation (10) becomes
. Equation (10) becomes

Equation (12) gives the relationship between measured ![]() and actual R
λ(θ0) values of the bidirectional reflectance when the optical head is not at the ideal distance of the snow surface.
and actual R
λ(θ0) values of the bidirectional reflectance when the optical head is not at the ideal distance of the snow surface. ![]() is the distance correction function which does not depend on the illumination wavelength, λ.
is the distance correction function which does not depend on the illumination wavelength, λ.
In Figure 4, the model is applied to the case of the pendulum experiment described in section 3.4. We assume that dy follows a sinusoid whose frequency and amplitude is fitted to match the observations. The best fit was obtained for an oscillation amplitude of ±11.8 mm, very close to the measured distance (12 mm). With such variations of dy, the model predicts the measurements correctly for 20° and 40° (Fig. 4). At 60° the remarkable pattern of double sinusoids is predicted only qualitatively by the model. This pattern is due to the fact that when the distance dy increases (effect 1), the zenith angle of the photodiode decreases from 60° toward lower grazing angles (effect 2). The first effect tends to reduce the energy received by the photodiode, while the second effect tends to increase it because of the larger apparent surface viewed by the receiver at smaller zenith angle. The ±20° photodiodes are dominated by the first effect, while the 60° ones are affected by both. From a practical point of view, the lesser performance of the model at 60° suggests that the distance correction will be less accurate at this angle and using the 60° photodiodes for calculating the hemispherical reflectance may result in larger uncertainties than if they were not used. We conclude that it is best not to use the data from the 60° photodiodes in subsequent data analysis.
3.4.2. Distance correction
The idea for correcting the distance with POSSSUM is, first, to estimate the distance dy using the measurements at 635 nm, ![]() , assuming that the bidirectional reflectance at 635 nm, R
R
(20%), is a priori known and almost independent of the SSA and, second, to correct the IR reflectance obtained after calibration using dy and the model. The two steps can be regrouped into a single formula with the correction function,
, assuming that the bidirectional reflectance at 635 nm, R
R
(20%), is a priori known and almost independent of the SSA and, second, to correct the IR reflectance obtained after calibration using dy and the model. The two steps can be regrouped into a single formula with the correction function, ![]() , without explicitly estimating the distance dy. Equation (12) applied to both wavelengths gives
, without explicitly estimating the distance dy. Equation (12) applied to both wavelengths gives

Figure 6 plots the variations of ![]() versus
versus ![]() calculated using the geometrical model for variations of dy in the range ±13 mm.
calculated using the geometrical model for variations of dy in the range ±13 mm.
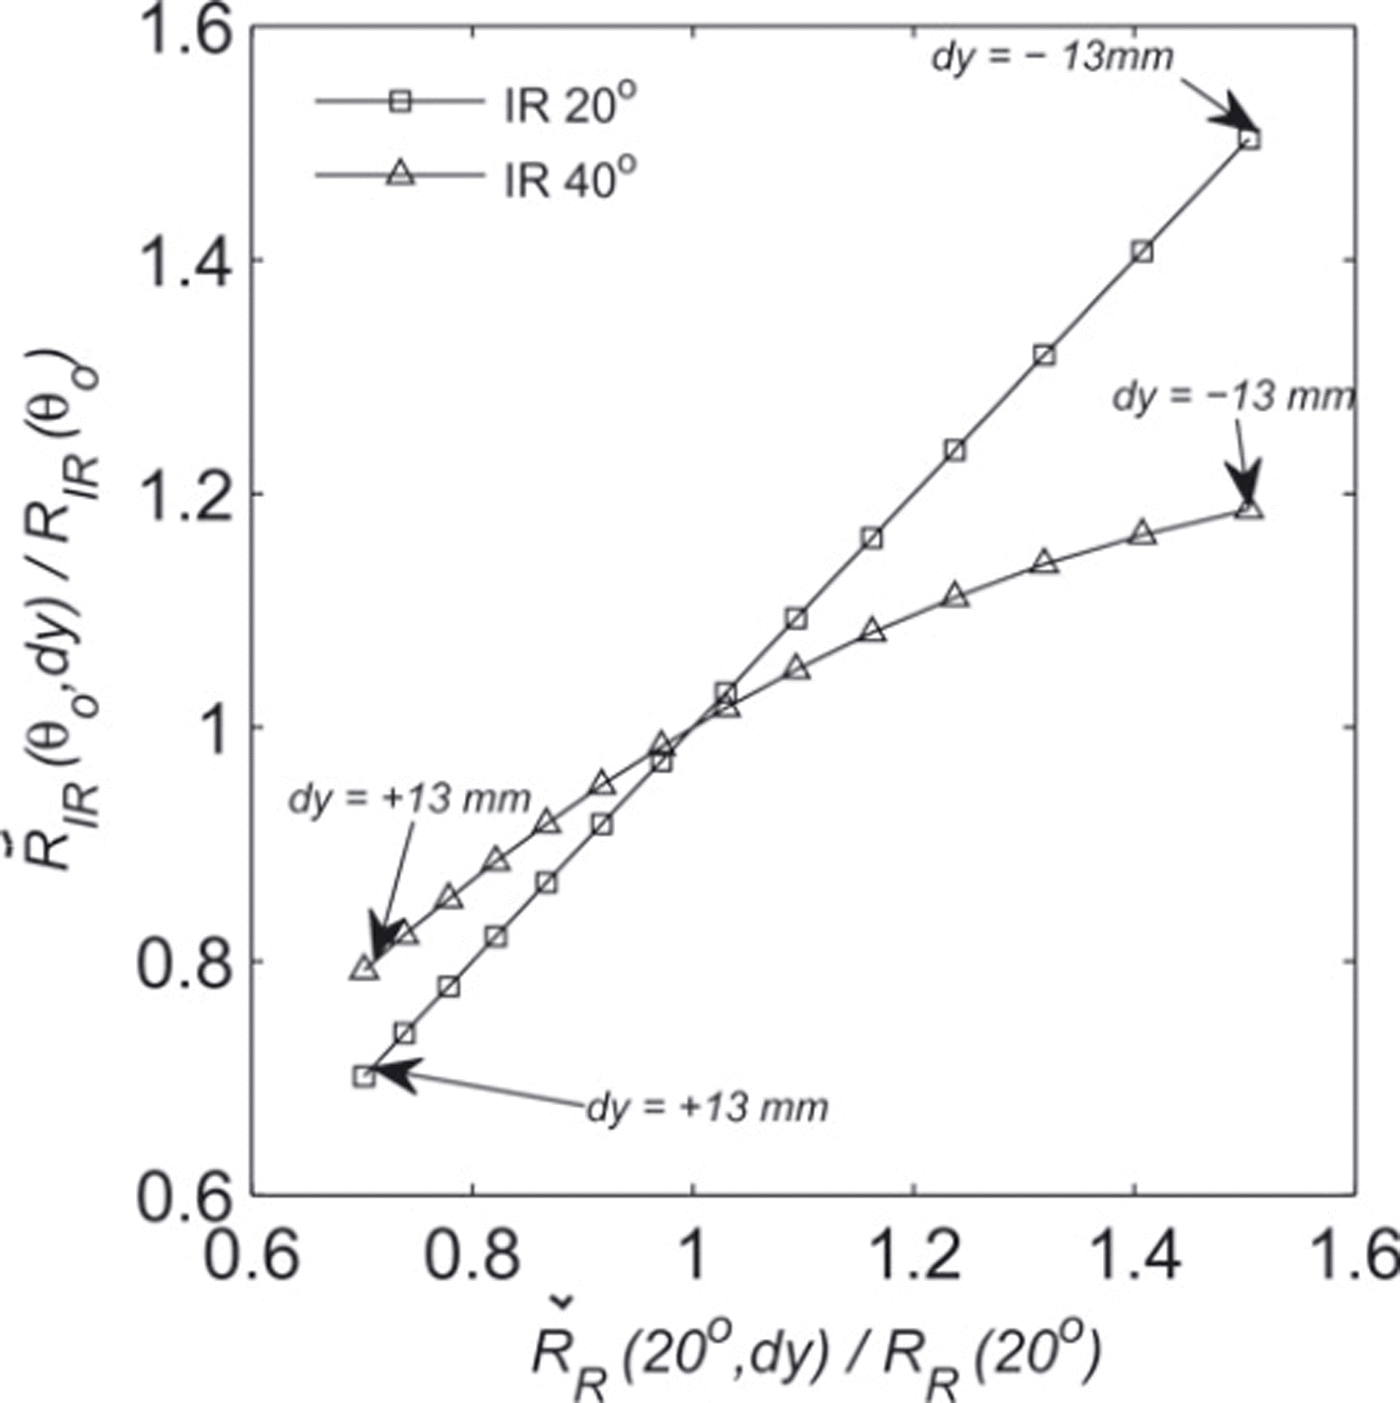
Fig. 6. Variations of ![]() versus
versus ![]() at two different viewing zenith angles, θ
0 (20° and 40°), calculated using the geometrical model for variations of dy in the range ±13 mm.
at two different viewing zenith angles, θ
0 (20° and 40°), calculated using the geometrical model for variations of dy in the range ±13 mm.
The relationship for 20° is the identity function because the model ![]() is independent of the wavelength. For the other angles, the relationship is nonlinear and has no simple analytical solution. To avoid numerical inversion of the model for every single measurement, we fitted polynomials to the curves obtained theoretically in Figure 6 and used the polynomials instead of the model without any loss of accuracy. The correction functions,
is independent of the wavelength. For the other angles, the relationship is nonlinear and has no simple analytical solution. To avoid numerical inversion of the model for every single measurement, we fitted polynomials to the curves obtained theoretically in Figure 6 and used the polynomials instead of the model without any loss of accuracy. The correction functions, ![]() , deduced from Figure 6 are
, deduced from Figure 6 are

with

Rearranging Equation (13) leads to the correction formula:

The left term is the reflectance needed for the conversion to SSA, and the right side contains only measured values except R R(20°). To estimate this unknown value, we use an iterative algorithm which (i) starts with R R(20°) = ω R = 0.94, (ii) calculates the SSA using Equations (17), (5) and (6), (iii) estimates R R(20°) using the estimated SSA and Equation (6) applied at 635 nm, and (iv) iterates (ii) and (iii) until convergence. In practice, the convergence is very rapid. In typical conditions, the variations of the estimated SSA remain below 0.2% after the first iteration.
The results of this correction applied to the pendulum experiment in front of a real snow surface are presented in Figure 7.
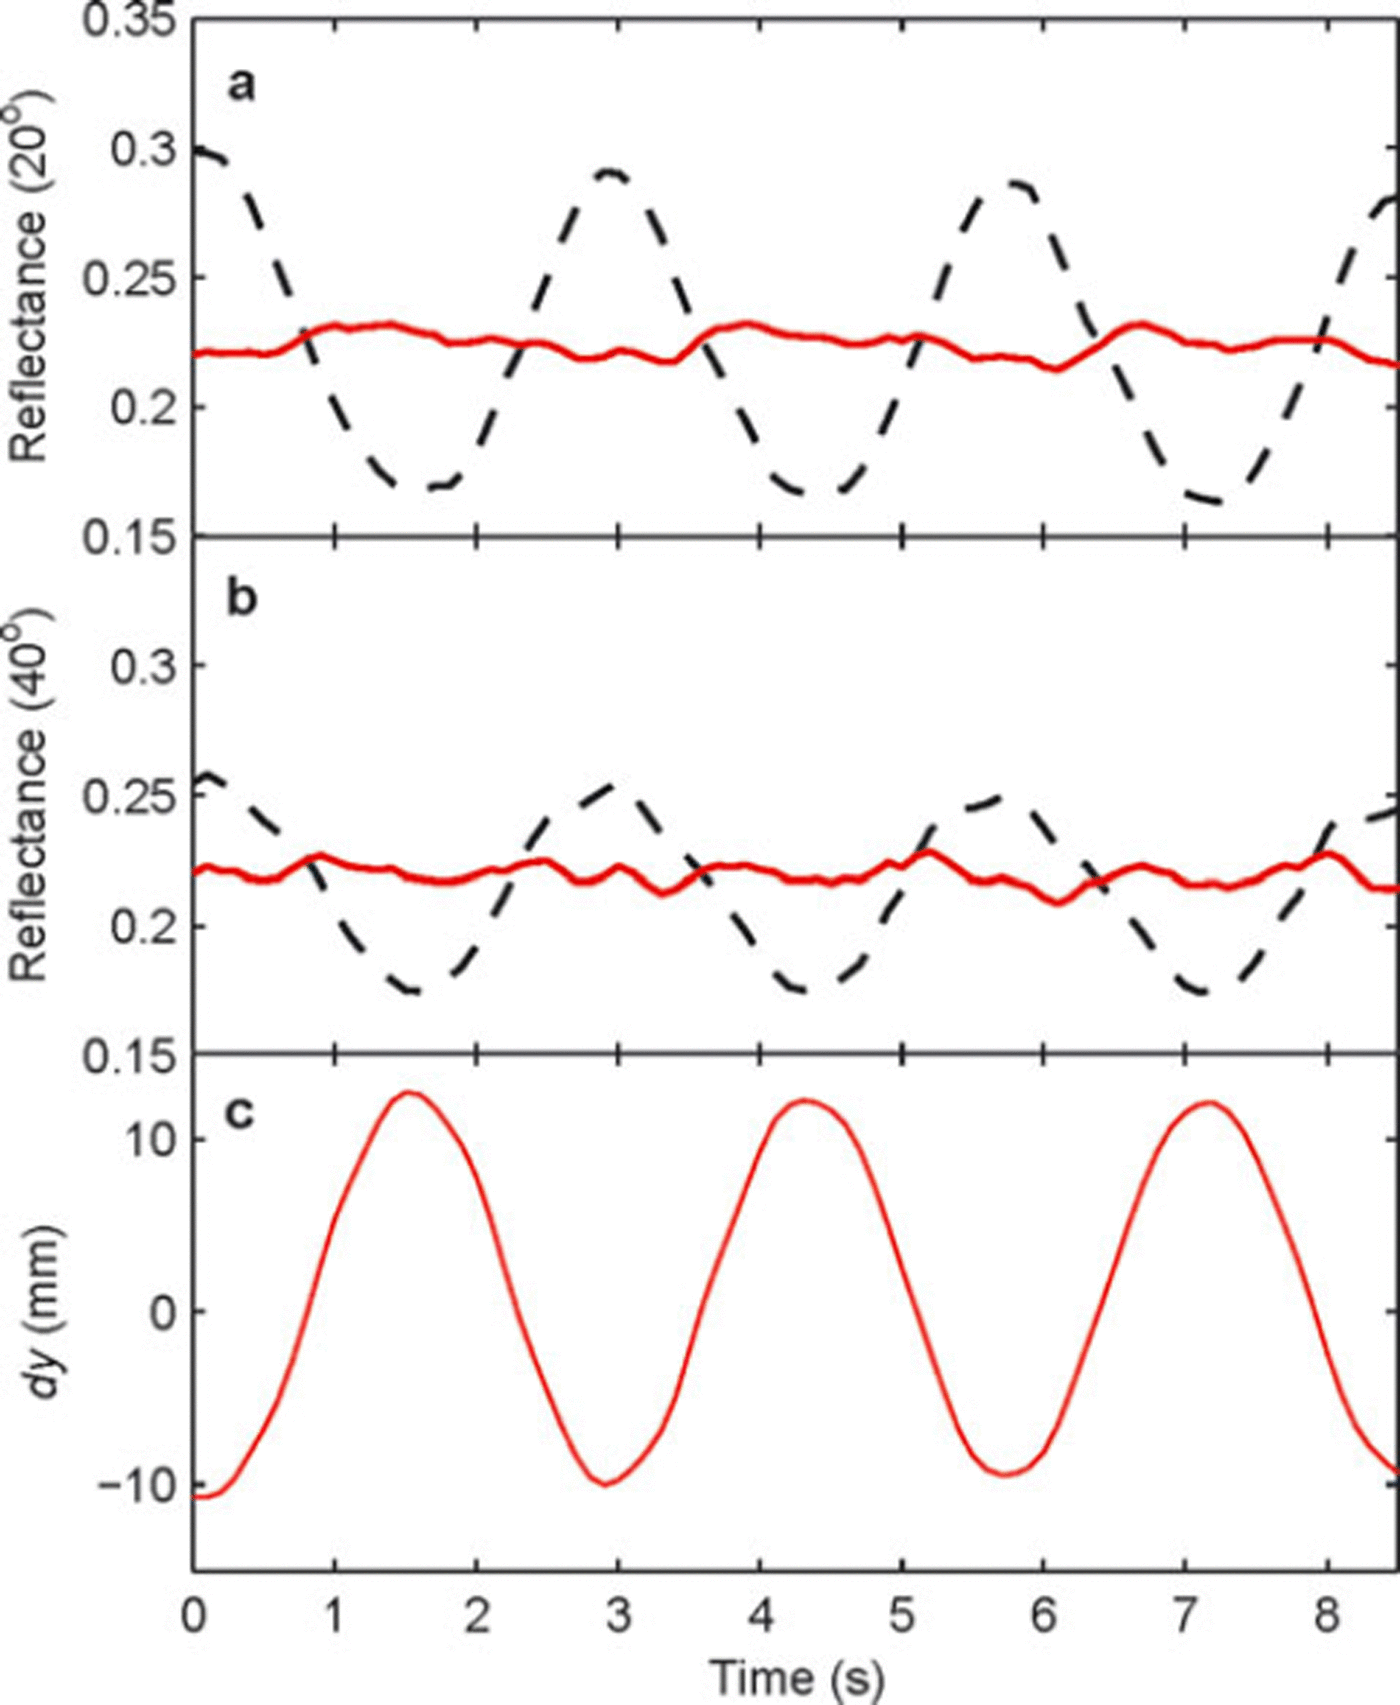
Fig. 7. Effect of the distance correction on the reflectance at two different viewing zenith angles: (a) 20° and (b) 40°. Dashed curves are snow reflectances during the pendulum experiment, and red solid curves are the distance-corrected signals. (c) Amplitude of the oscillations of POSSSUM dy calculated with the reflectance measured at 635 nm and Equation (12).
The variations due to the distance are still visible in the corrected signal. However, the standard deviation of the residual variations is small, 0.007 at 20° and 0.004 at 40°, corresponding to a reduction by a factor 6.5 and 7 of the oscillation amplitude with respect to the uncorrected signal. The residual variations of mean reflectance calculated with the photodiodes at ±20° and ±40° correspond to 2% of the reflectance for oscillations amplitude of ±12 mm (Fig. 7). The amplitude used for this test is also realistic in normal operation in the field. Hence, we estimate that the residual error on hemispherical reflectance due to the distance variations after the correction is <2%.
Larger errors can occur in the presence of impurities in snow, as snow reflectance in the visible is very sensitive even to a small amount of impurities. This effect is not taken into account in Equation (6). We estimate that an error of 5% on the reflectance at 635 nm translates directly into an error of 5% on IR reflectances and in turn into an error of at least 5% on SSA. As POSSSUM is primarily dedicated to measuring SSA in central Antarctica, impurities in snow should have a negligible impact.
4. Validation and Results
Several field campaigns and laboratory experiments were conducted in the Alps during the winter and spring of 2009 to test and validate the instrument. The main results of this validation are presented in this section considering different approaches:
Validation of the hemispherical reflectance by comparison with measurements from the DUFISSS IR instrument (Reference Gallet, Domine, Zender and PicardGallet and others, 2009).
Validation of the SSA by comparison with direct measurements of SSA by methane adsorption.
Test of reproducibility of SSA profile measurements.
4.1. Validation of the hemispherical reflectance
On several occasions, in the laboratory and in the field, POSSSUM and DUFISSS measurements were made on the same snow samples. DUFISSS and POSSSUM work at the same wavelength under nadir illumination. However, in DUFISSS, multiple scattering between snow and the integrating sphere is significant and results in an additional diffuse component in the illumination. Since the hemispherical reflectances of snow are different under diffuse and nadir illuminations, raw reflectance measurements from both instruments are in principle slightly different (-3%). For a precise comparison, we converted reflectances measured by DUFISSS into directional–hemispherical reflectances as measured by POSSSUM. To this end, we calculated the fraction of diffuse reflection present in DUFISSS (Reference Gallet, Domine, Zender and PicardGallet and others, 2009, equation (5)) which is specific to each exemplar of the instrument, and calculated the relationship between diffuse and directional reflectances using DISORT. By combining the two calculations, we obtained the theoretical relationship between the mixed diffuse/directional reflectances as measured by DUFISSS and the directional reflectance as measured by POSSSUM. Only converted reflectances are shown in the following even if not explicitly stated.
For the comparison with laboratory experiments, the protocol of DUFISSS was applied to POSSSUM: Snow samples were placed in a sample holder of inner diameter 63 mm and depth 25 mm (see Reference Gallet, Domine, Zender and PicardGallet and others, 2009) and the reflectance was measured successively by both instruments. POSSSUM was positioned precisely with respect to the sample so that dy = 0. The distance correction was disabled in the algorithm because the penetration depth at 635 nm is larger than the sample depth, and the measured reflectance does not correspond to the reflectance of a semi-infinite medium as expected in the algorithm. Figure 8 shows the hemispherical reflectances of 23 samples measured by both instruments in the laboratory. The difference between the two instruments is 0.012 RMS, which corresponds to 3% variations (coefficient of variation of the root-mean-square deviation defined as CV(RMSD) = RMSD/Mean) and the bias is insignificant (−0.0006).
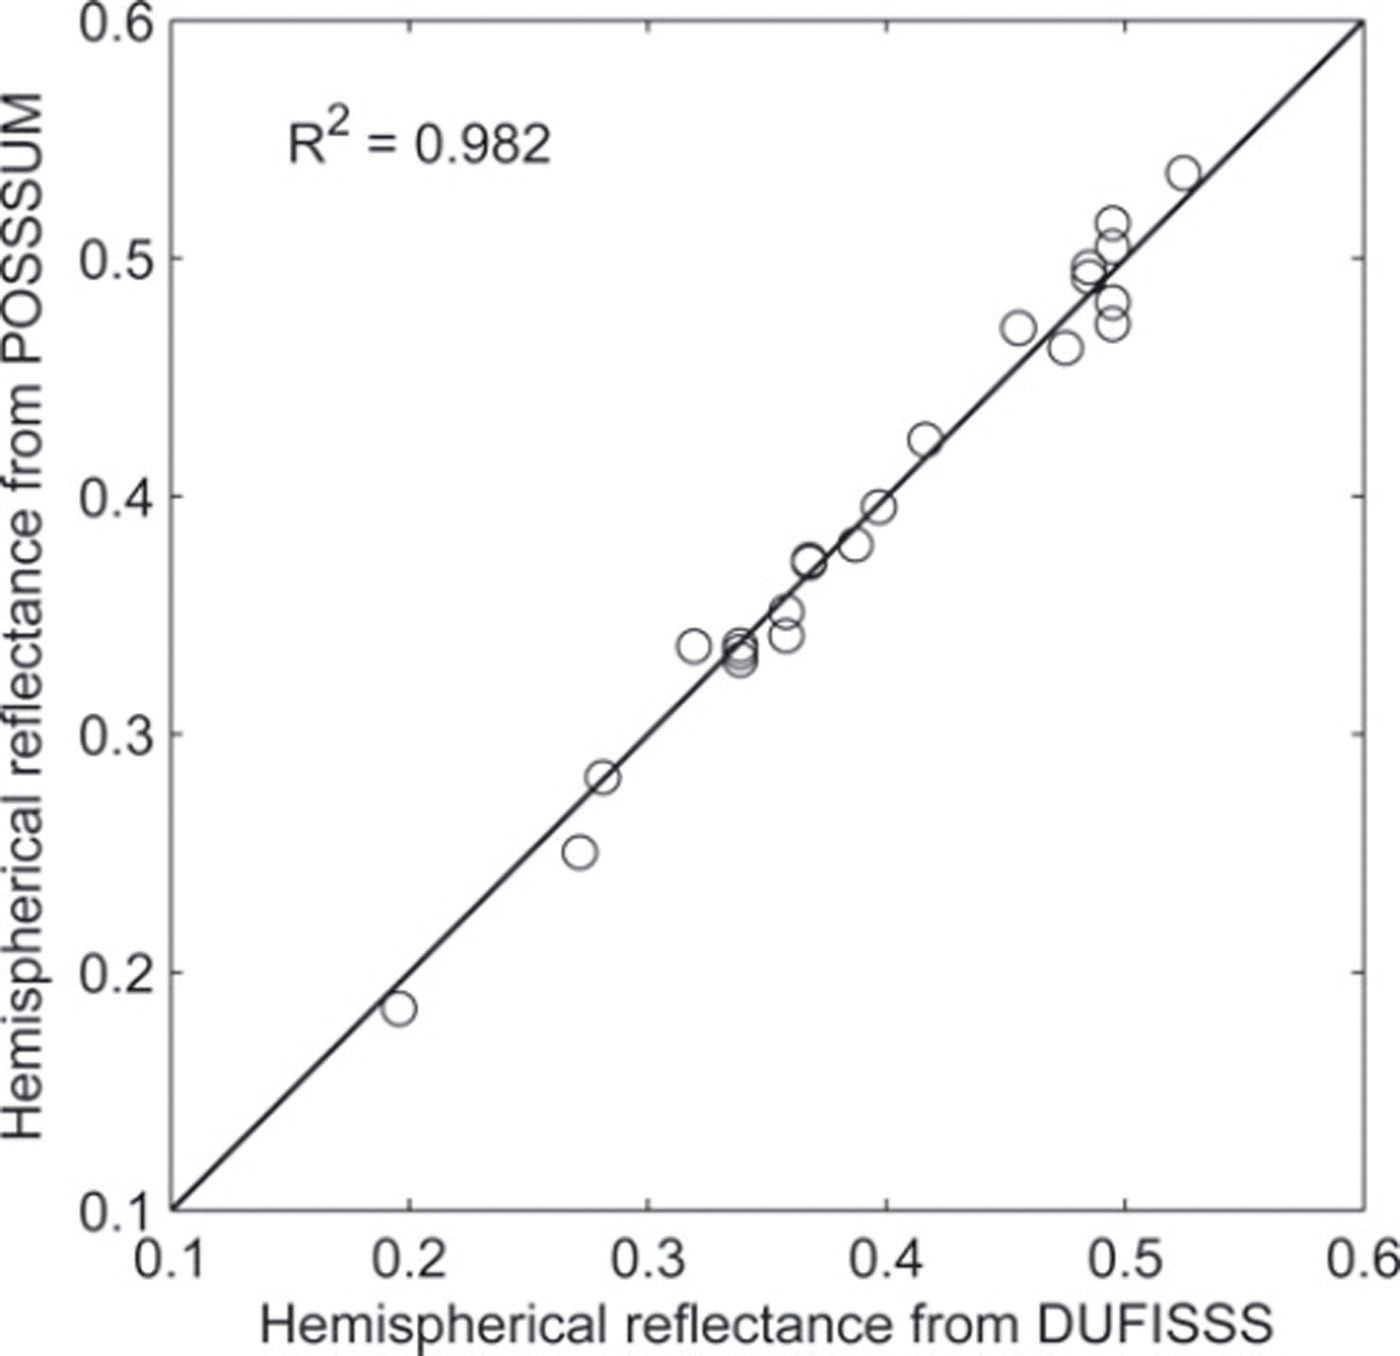
Fig. 8. Comparison of hemispherical reflectances obtained in the laboratory using snow samples with POSSSUM and DUFISSS (circles). R 2 is computed with the residual sum of squares errors between the real data points and the y = x model.
In the validation experiments done in the field, POSSSUM was operated in a hole drilled using the protocol described above (see section 2.4) at Glacier de la Girose, located in the French Alps in the La Meije area (45°0′19″ N, 6°15′55″ E), on 17 April 2009. A snow pit was dug along the hole, and the SSA profile was measured with DUFISSS with a 30 mm vertical resolution, using the sampling protocol adapted to DUFISSS (Reference Gallet, Domine, Zender and PicardGallet and others, 2009). In addition, samples were collected, stored in liquid nitrogen and transported to the laboratory for additional measurements (reflectance again and SSA measured with methane adsorption). Only the validation of POSSSUM is discussed here. The profile of hemispherical reflectance measured with POSSSUM, averaged at a vertical resolution of 10 mm, is shown in Figure 9, together with 41 samples measured with DUFISSS.
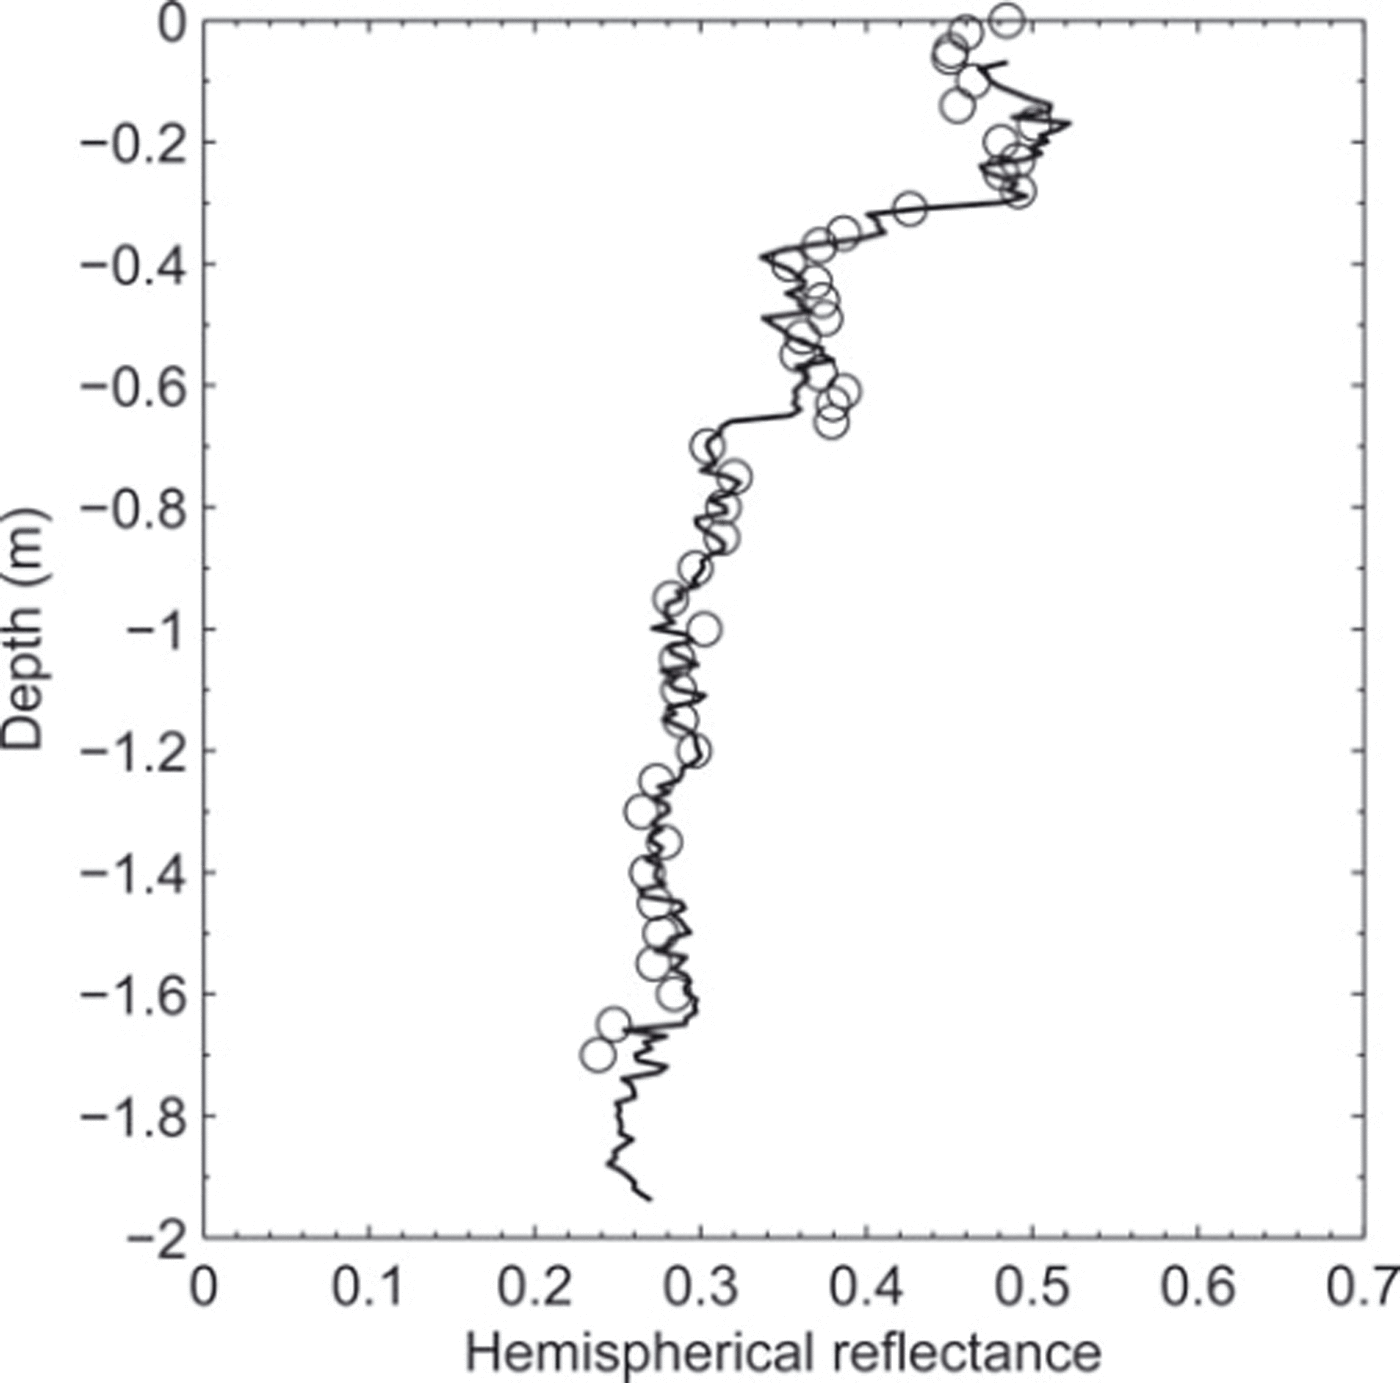
Fig. 9. Profiles of hemispherical reflectance measured with POSSSUM (solid line) and discontinuous measurements with DUFISSS (circles) obtained on Glacier de la Girose on 17 April 2009.
The reflectance measured by POSSSUM at the same depth as the DUFISSS samples was extracted and is compared to DUFISSS reflectance in Figure 10. The overall difference is 0.02, i.e. 6% CV(RMSD), and the bias is 0.0015. These are larger than the errors obtained in the laboratory experiments. Additional sources of error were present in the field. Part of the error may be explained by the distance correction which was activated in the field and can itself account for 0.007 RMS as seen during the pendulum experiment. However, other large sources of error, and not the instruments, most likely explain the 6% finding. Indeed, the snow pit where DUFISSS samples were taken was ∼1 m from the POSSSUM hole. The reference for the depth measurements is thus uncertain and, even for a given depth, real differences of reflectance are possible due to the natural spatial variability of the snow. Despite the larger errors in field conditions, this comparison shows that both instruments agree on the hemispherical reflectance values within 6%, which remains sufficiently small for the targeted accuracy of SSA.
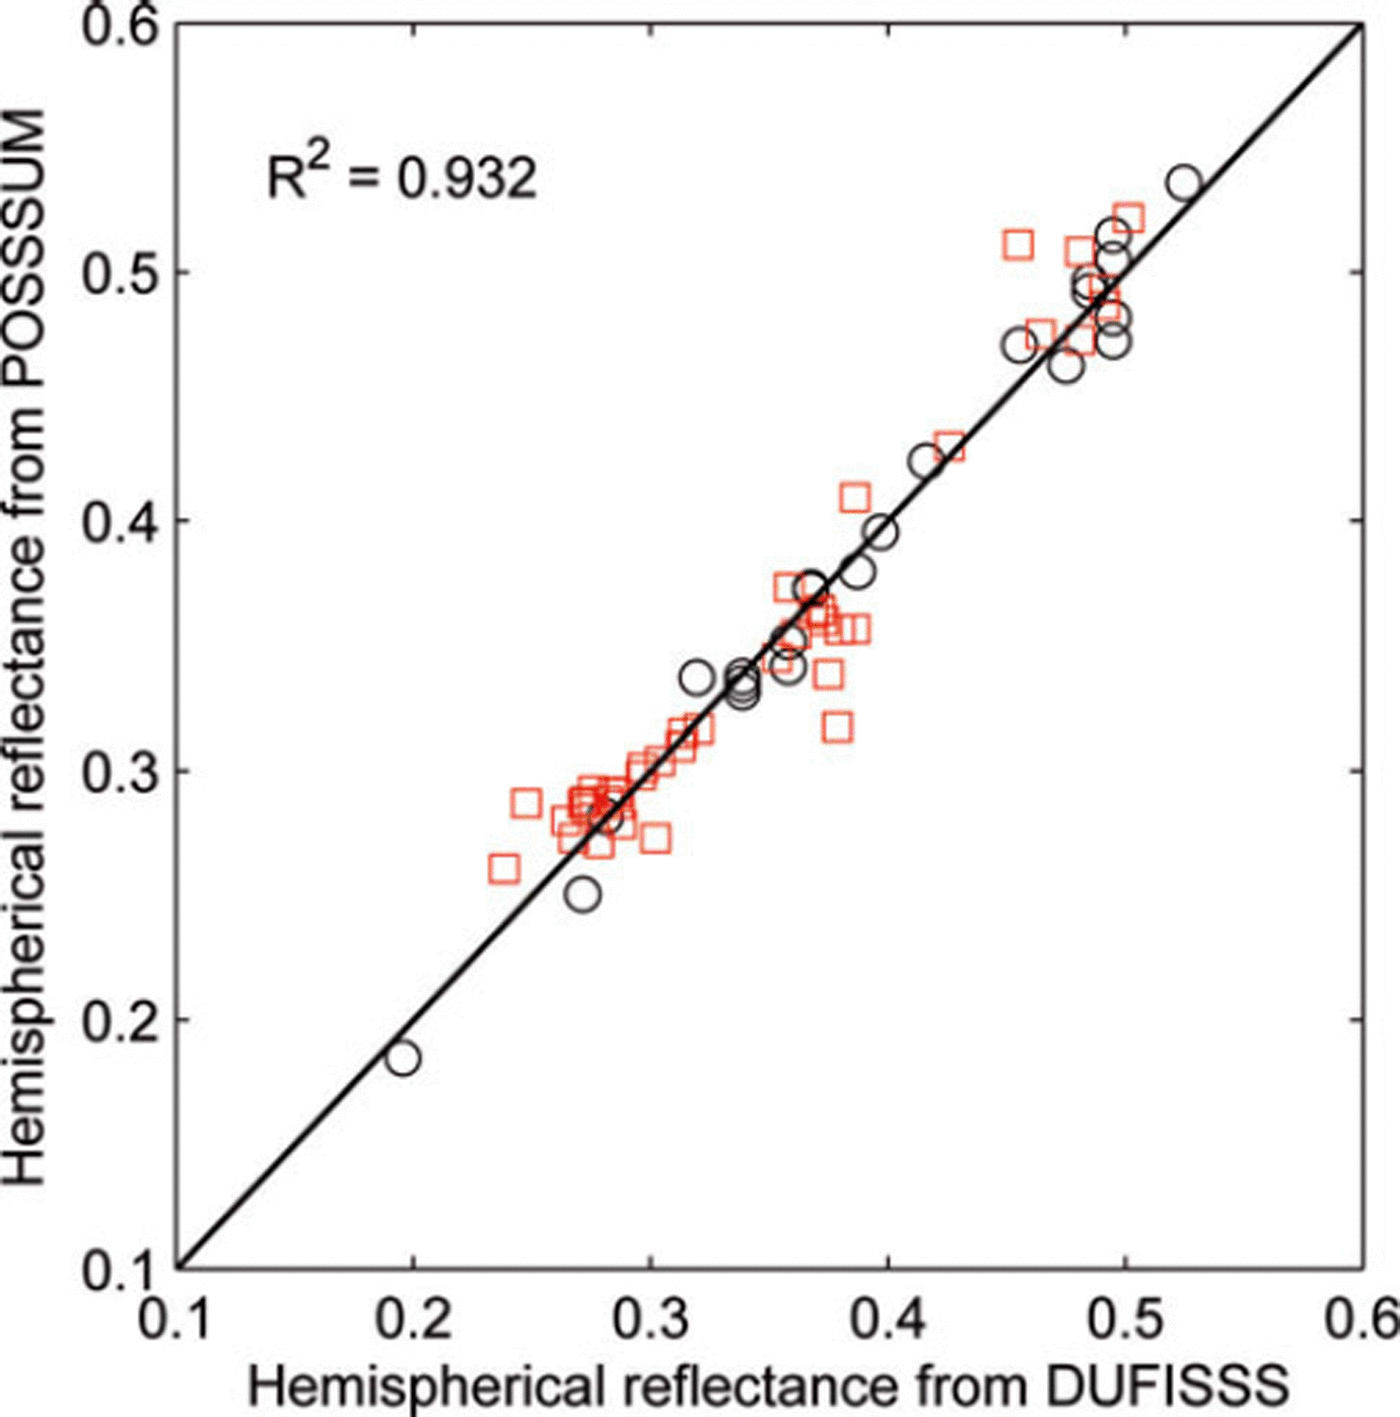
Fig. 10. Comparison of hemispherical reflectances obtained with POSSSUM and DUFISSS. Squares are field measurements, and circles are laboratory measurements. R 2 is computed with the residual sum of squares errors between the real data points and the y = x model.
4.2. Validation of SSA with independent measurements by methane adsorption
Reference and independent measurements of SSA were provided by determining the adsorption isotherm of methane at liquid nitrogen temperature (Reference Chaix, Ocampo and DomineChaix and others, 1996; Reference Legagneux, Cabanes and DomineLegagneux and others, 2002; Reference Domine, Taillandier and SimpsonDomine and others, 2007).
Snow samples were taken at Glacier de la Girose, immersed in liquid nitrogen on the glacier (Reference Legagneux, Cabanes and DomineLegagneux and others, 2002) and transported to our laboratory. In the laboratory we measured the SSA with POSSSUM, just before the methane adsorption measurements. Measurements of SSA with POSSSUM are compared to the adsorption results in Figure 11. The overall difference between SSA from methane adsorption and POSSSUM measurements is 1.8 m2 kg−1 (RMSD), which corresponds to a relative difference lower than 8% CV(RMSD). The bias (POSSSUM minus methane adsorption) is −0.4 m2 kg−1.
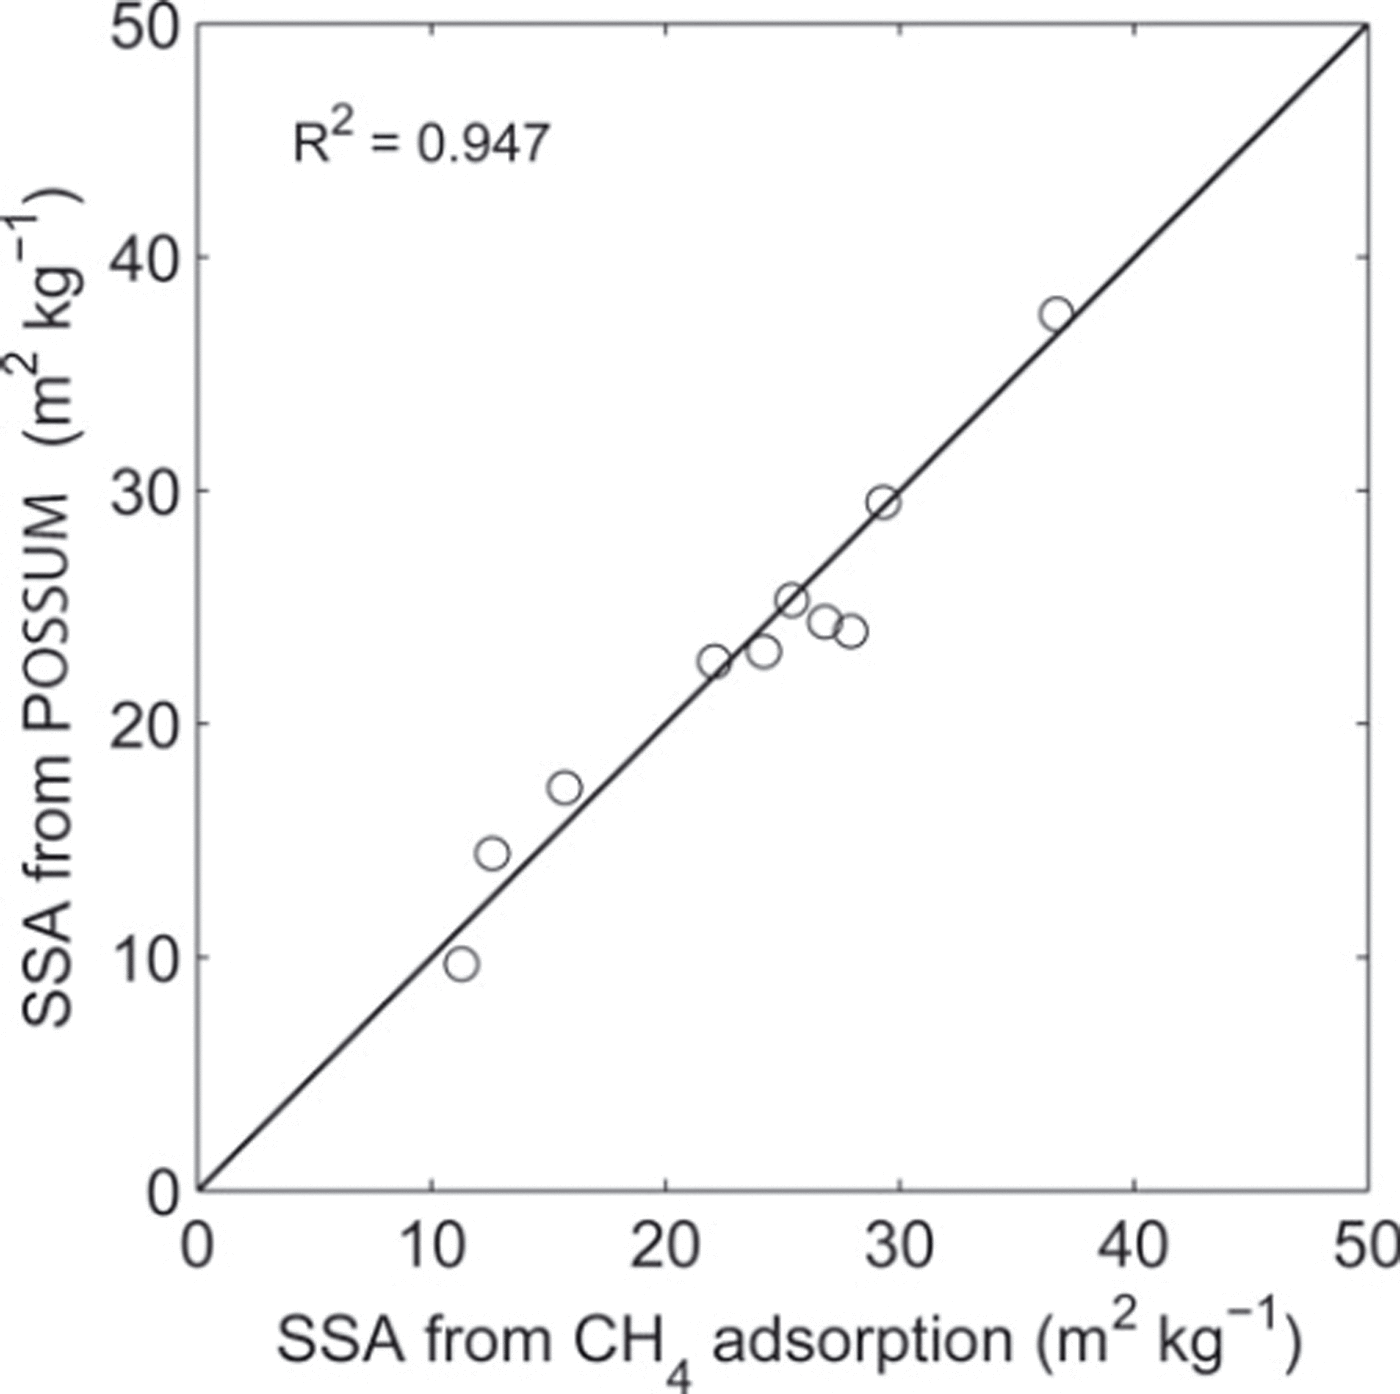
Fig. 11. SSA calculated with the processing algorithm from the reflectance measured with POSSSUM versus SSA measured using CH4 adsorption at 77 K. R 2 is computed with the residual sum of squares errors between the real data points and the y = x model.
4.3. Test of reproducibility of SSA profile measurements
Given that snow stratigraphy and, therefore, its physical properties vary at very short horizontal scales (Reference Matzl and SchneebeliMatzl and Schneebeli, 2006), the best way to evaluate the instrument’s reproducibility is to perform SSA measurements in a drilled hole during both the ascent and the descent. Figure 12 shows SSA profiles with and without correction of the distance with a vertical resolution of 10 mm. Without correction, the difference between the descent and the ascent is very large, 14.3 m2 kg−1 (RMSD), and the bias is significant.
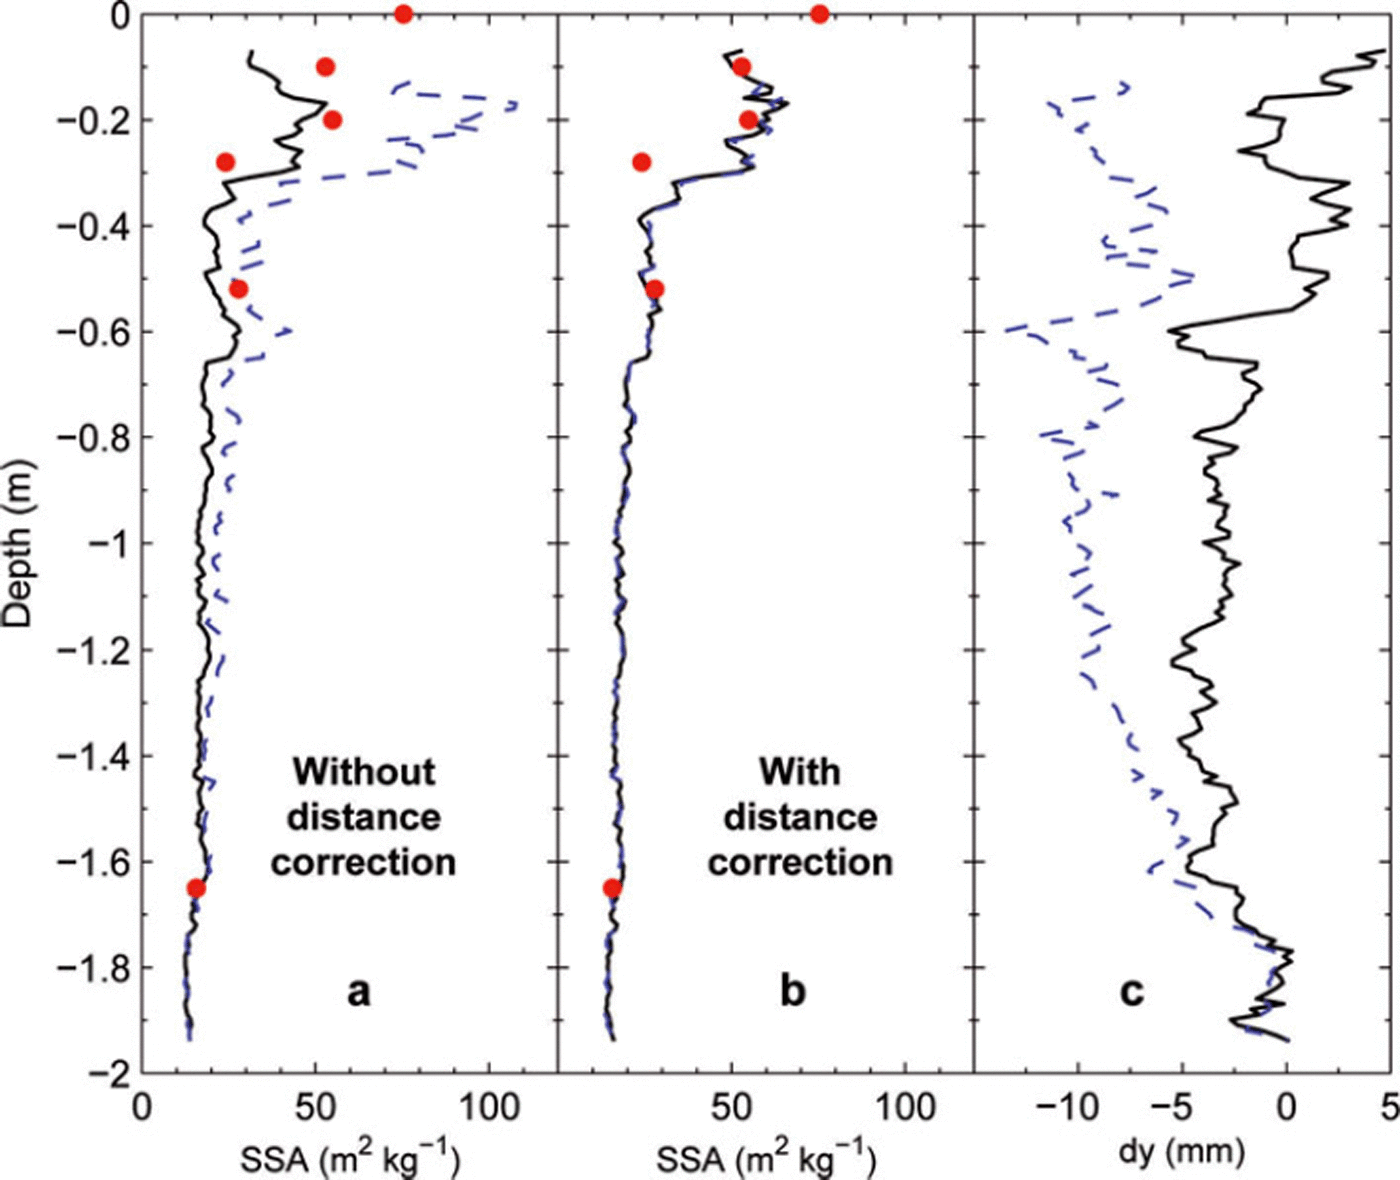
Fig. 12. Profiles of SSA obtained with POSSSSUM on Glacier de la Girose on 17 April 2009 without (a) and with (b) distance correction during the descent (solid curves) and the ascent (blue dashed curves). To quantify the distance correction during descent and ascent, the distance dy calculated with Equations (12–16) is plotted (c). Some SSA measurements using methane adsorption on sampled snow (red circles) are also shown for direct comparison.
During the descent, the amplitude of the correction (Fig. 12) is weak and corresponds to variations of 3 mm RMSD of POSSSUM around dy = 0. This indicates that the bore fully plays its part in maintaining the adequate distance. In contrast, the correction is larger during the ascent (8 mm RMSD and mean value of −7.4 mm), probably because the hole is larger than the bore diameter after the descent. The correction further increases near the surface when the anti-torques are out of the snow and the instrument is less maintained. However, despite the movements of the instrument, the corrected SSA profile is very close to methane adsorption measurements and to the profile obtained during the descent, with a RMS difference of 1.1 m2 kg−1 which corresponds to a relative difference of <6% CV(RMSD) between the ascent and descent profiles. The difference observed at 30 cm may be due to a discrepancy in depth measurement between sampling for methane adsorption and POSSSUM measurements. These results clearly demonstrate the need for the distance correction and the efficiency of the algorithm. In addition, they suggest that it is useful to make measurements in both ways (descent and ascent) as this requires little extra time (2 min per meter of snowpack) and makes it possible to detect potential inconsistencies and/or to average both profiles to improve the accuracy.
Other similar experiments to test the reproducibility have been conducted, such as (1) comparing two descents of the same hole (the hole was inevitably larger for the second descent), (2) comparing two descents with a rotation of 120° of the tripod, (3) comparing two holes several meters apart, and (4) comparing holes at the same location but measured after a 16 day interval. All these experiments confirmed the good reproducibility of the measurements and the suitability of the distance correction.
4.4. Measurement accuracy
Here we evaluate the absolute uncertainty of our measurement using two methods: (1) direct comparison with methane absorption and the known error on this technique, and (2) an error propagation method.
The direct comparison of SSA between POSSSUM and the independent method of methane absorption yields a random error of ∼8% RMS with a negligible bias. However, the methane adsorption technique is not perfect: the systematic error was evaluated at 10% by Reference Legagneux, Cabanes and DomineLegagneux and others (2002) and subsequently reduced to 5% by Reference Gallet, Domine, Zender and PicardGallet and others (2009) based on a comparison with X-ray micro-tomography (Reference Kerbrat, Pinzer, Huthwelker, Gäggeler, Ammann and SchneebeliKerbrat and others, 2008). Summing up the random and the systematic error, the overall accuracy is 10%. This places the POSSSUM accuracy in the same range as those of the other techniques (Reference Matzl and SchneebeliMatzl and Schneebeli, 2006; Reference Gallet, Domine, Zender and PicardGallet and others, 2009). However, the number of samples in this validation was limited (n = 10) and the SSA values were 10–40 m2 kg−1, corresponding to metamorphosed snow. This is adequate for Antarctic snow but is insufficient to include fresh snow which is frequently found in the Alps. To enhance confidence in POSSSUM, we can rely on the small error found on the hemispherical reflectances with respect to DUFISSS (6% RMS), and the validation done for this instrument (Reference Gallet, Domine, Zender and PicardGallet and others, 2009) in the range 20–60 m2 kg−1.
The second way to estimate measurement uncertainty is to quantify the propagation of errors through all the steps of the processing algorithm. The random error on the calibration of each photodiode is 4% RMS, which reduces to 2% by averaging the four photodiodes and assuming independent errors. The systematic error is <1% because the reference panels are well calibrated by the manufacturer. The random and systematic errors on the snow anisotropy factors are probably <2%. The distance correction resulted in a random error of 2% in a laboratory experiment. However, we believe that in field conditions the distance correction is a larger source of error, which depends on the quality of the hole and the operations during the descent of the instrument. A conservative value of 4% is retained in this analysis. Summing up these independent errors, we obtain a random error of 4.9% RMS for the hemispherical reflectance (assuming independent errors, we estimate the total error as the root of the sum of the square errors) and a systematic error less than 3%. The overall error on hemispherical reflectance is then 5.7%.
To convert the hemispherical reflectance to SSA, we use the theoretical relationship of Reference Kokhanovsky and ZegeKokhanovsky and Zege (2004), which is an approximate solution of the radiative transfer equation. It depends, like any other radiative transfer model, on the description of the medium and in particular on the grain shape. The shape factor, b, was calculated for several perfect geometrical shapes (Reference Kokhanovsky and ZegeKokhanovsky and Zege, 2004; Reference Picard, Brucker, Fily, Gallée and KrinnerPicard and others, 2009b) but is unknown for natural snow and may depend on the snow type. Using the SSA measured by methane adsorption and reflectance by POSSSUM (i.e. the data in Fig. 11), the optimal value of b (least-square meaning) is 4.56, with a large uncertainty range of 4.45–4.68 (95% confidence interval) due to the limited sample size. Since the experimental value, b = 4.56, is close to the theoretical value for spheres, b = 4.53, we chose to use the value for spheres in our data analysis, as it yields results comparable with the methane adsorption and spheres are traditionally used in most radiative transfer calculations for snow. However, this choice is not definitive and progress on this issue is necessary and would benefit a wide range of applications, from SSA measurements to surface energy-budget calculations. Meanwhile, the error on the conversion of the hemispherical reflectance into SSA is difficult to evaluate. It mostly depends on the accuracy of the b value, which we estimate at 2%. Accounting for errors on the hemispherical reflectance, on b and for the nonlinearity of the conversion function (Equation (6)) gives an overall error of ∼10% for SSA = 17 m2 kg−1 and 13% for SSA = 35 m2 kg−1.
We conclude that both ways of evaluating the accuracy converge to an overall accuracy of SSA measured with POSSSUM of ∼10%.
5. Conclusion
This paper presents a new instrument dedicated to the measurement of profiles of snow SSA with a vertical resolution of 10 mm in holes drilled by hand or using a light electromechanical drill down to depths of ∼20 m. Following the same approach as Reference Gallet, Domine, Zender and PicardGallet and others (2009), POSSSUM estimates SSA from measurements of IR reflectance at 1310 nm. To measure reflectance with an accuracy that allows satisfactory SSA estimation, the intensity of the illumination and the geometry of acquisition (incident and viewing angles, distance between the target and the detectors) must be controlled precisely and must remain constant during the descent of the instrument in the hole. This is the most critical point in the design of POSSSUM, which we addressed, first, by implementing a mechanical control of the position of the instrument in the hole and, second, by indirectly measuring the position to correct the measured signal from the residual and unavoidable movements in the hole. The processing algorithm features three steps: calibration, position correction, and estimation of SSA from the reflectances.
The validation of POSSSUM has been carried out in two steps. First, the reflectances have been compared with those obtained from the DUFISSS instrument (Reference Gallet, Domine, Zender and PicardGallet and others, 2009). The difference on the hemispherical reflectances between the two instruments is ∼6% RMS in field conditions. Second, the SSA estimated by POSSSUM has been validated by independent measurements of SSA using the reference method of methane adsorption, and yields an RMS error of about 8% and a non-significant bias. Taking into account the various sources of error, we estimate the uncertainty of SSA determination with POSSSUM is ∼10%.
Acknowledgements
The development of POSSSUM was supported by UJF– TUNES, CNRS–INSU (program LEFE–NIEVE), ANR (program ANR-07-VULN-013 VANISH) and the LGGE. We also thank the technical staff of the LGGE, and J. Pellenq for her comments and corrections.


