In figure 6 of our paper (Vega-Martínez et al.
Reference Vega-Martínez, Rodríguez-Rodríguez, Khabakhpasheva and Korobkin2019), incorrect values of the plate lifted height,
![]() $h_{e}$
, were used for the horizontal axis. These values correspond to correct measurements of the plate height, but at later times, due to a mistake in the frame rate of one of the videos that was introduced in the image processing algorithm. As a consequence, the values of
$h_{e}$
, were used for the horizontal axis. These values correspond to correct measurements of the plate height, but at later times, due to a mistake in the frame rate of one of the videos that was introduced in the image processing algorithm. As a consequence, the values of
![]() $h_{e}$
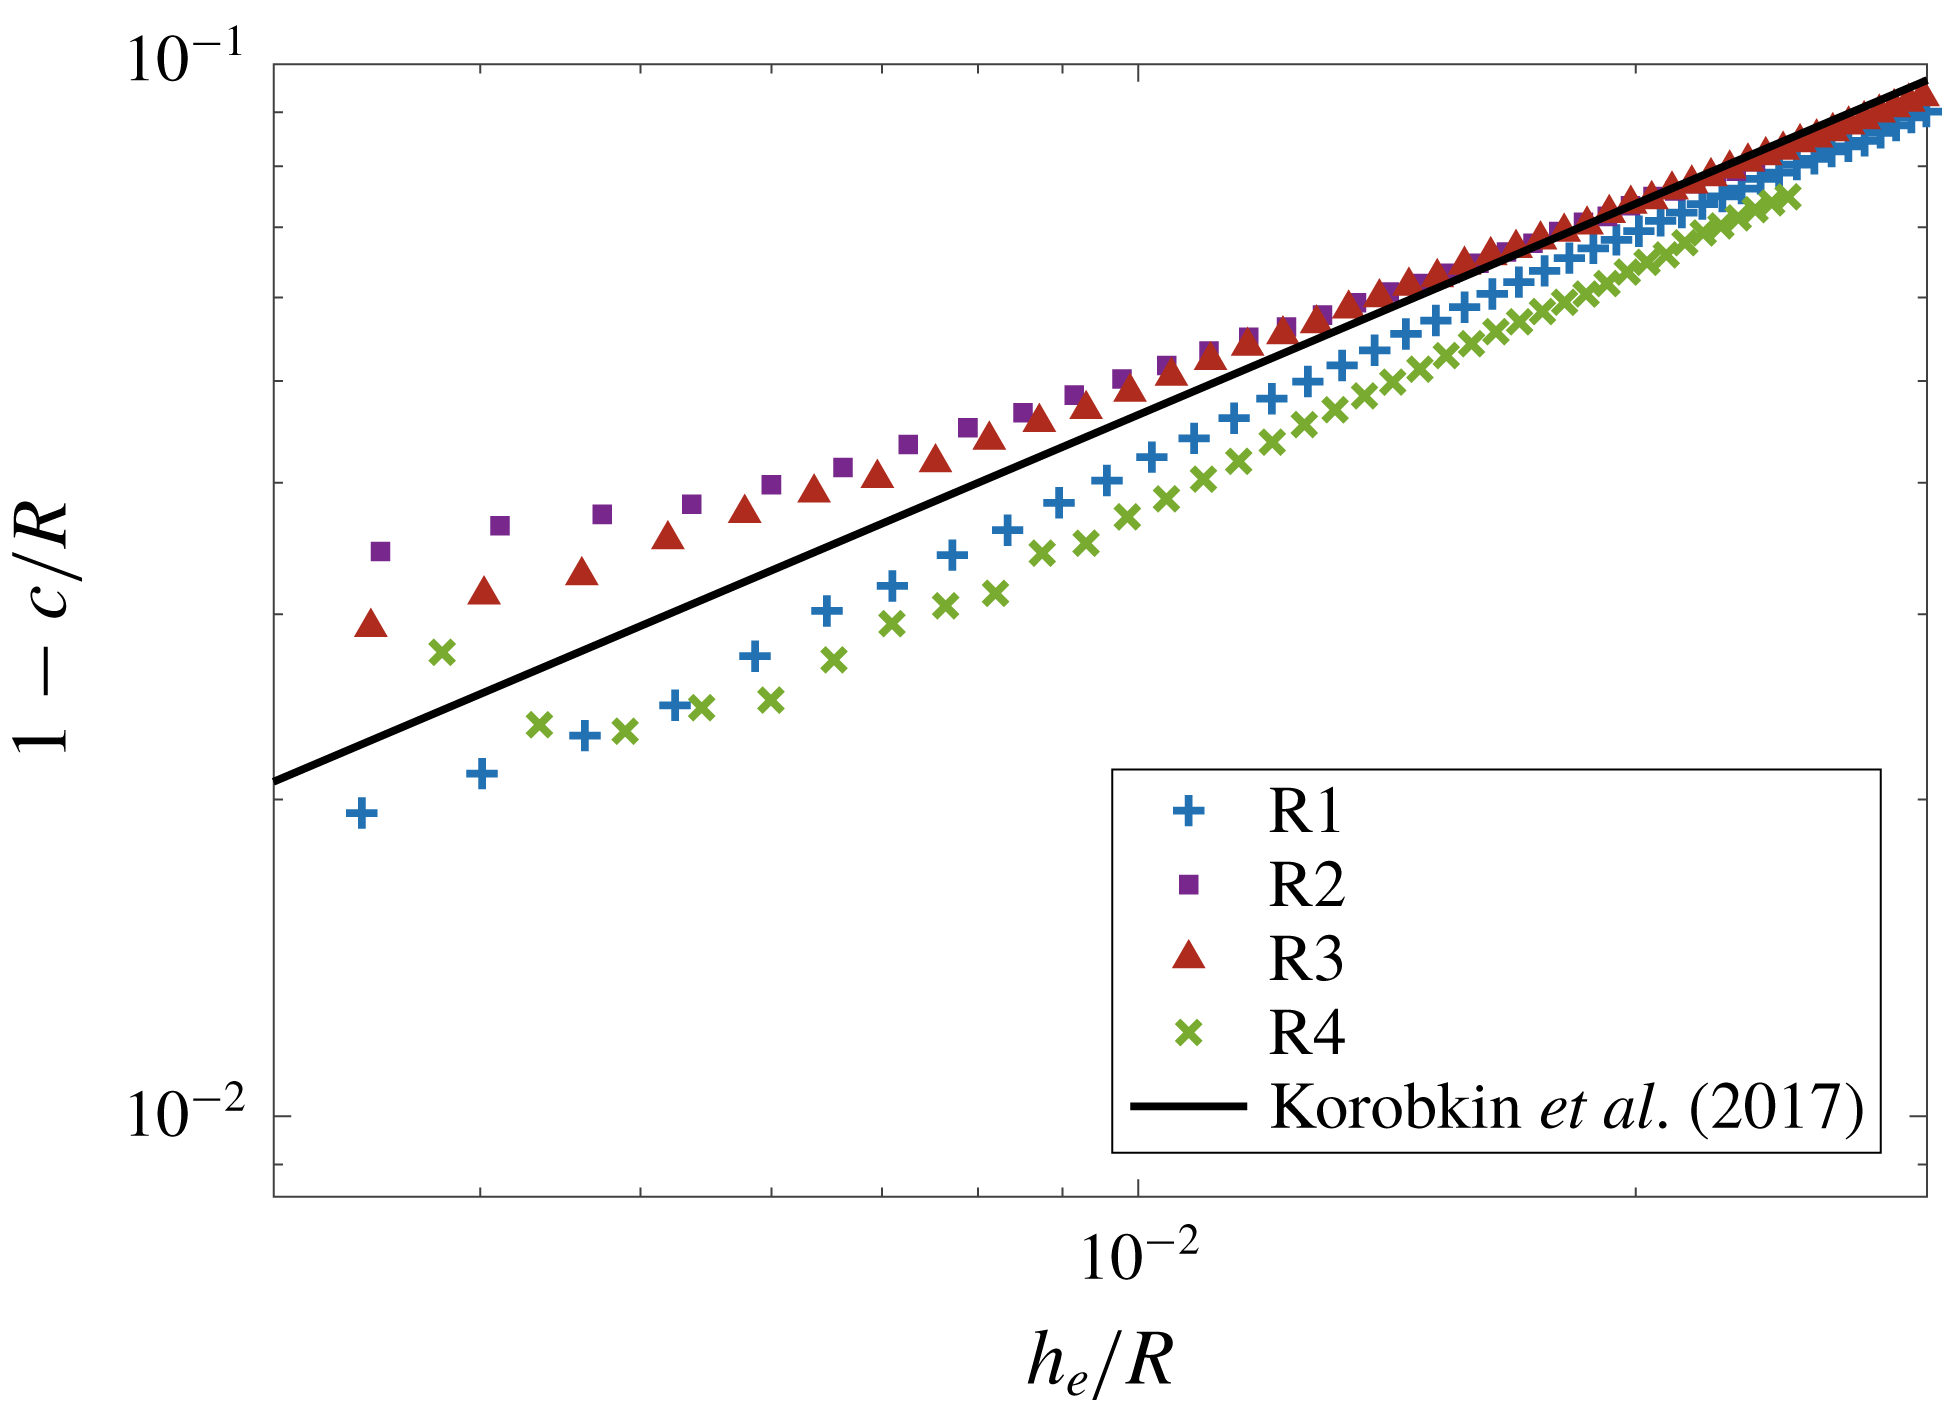
shown in figure 6 are inconsistent with those in figure 5(b), which are the right ones. Figure 1 of this corrigendum is the correct version of figure 6 of the paper.
$h_{e}$
shown in figure 6 are inconsistent with those in figure 5(b), which are the right ones. Figure 1 of this corrigendum is the correct version of figure 6 of the paper.
Note that, when the right data are plotted, the agreement between the experimental measurements and the theoretical prediction by Korobkin, Khabakhpasheva & Rodríguez-Rodríguez (Reference Korobkin, Khabakhpasheva and Rodríguez-Rodríguez2017) is actually better than what was shown in the original paper.

Figure 1. Log–log plot of
![]() $1-c/R$
versus
$1-c/R$
versus
![]() $h_{e}/R$
, showing the convergence to the law
$h_{e}/R$
, showing the convergence to the law
![]() $1-c/R\sim (h_{e}/R)^{2/3}$
(solid line) predicted by Korobkin et al. (Reference Korobkin, Khabakhpasheva and Rodríguez-Rodríguez2017).
$1-c/R\sim (h_{e}/R)^{2/3}$
(solid line) predicted by Korobkin et al. (Reference Korobkin, Khabakhpasheva and Rodríguez-Rodríguez2017).
Acknowledgement
We are indebted to Mr T. Breton, who pointed out this inconsistency when examining our original data.


