Over the past 30 years, mathematical modelling (specifically model-based compartmental analysis) of vitamin A kinetic data has generated important information about the whole-body metabolism of this essential nutrient. In model-based compartmental analysis, temporal data on plasma (and sometimes organ) retinol response following administration of labelled vitamin A are analysed mathematically in light of a postulated compartmental model that describes the vitamin A system. The simplest model that provides a good fit to the data generates both quantitative and predictive information about the system( Reference Cifelli, Green and Green 1 ).
In the 1980s and 1990s, Green and colleagues used model-based compartmental analysis to study vitamin A metabolism in rodent models following IV administration of [3H]retinol in its physiological transport complex. In addition to an active recycling of retinol between the plasma and tissues, these researchers found correlations between plasma vitamin A concentrations and both vitamin A disposal rates( Reference Lewis, Green and Green 2 ) and storage pool size( Reference Green, Green and Lewis 3 ). Later, Cifelli et al. ( Reference Cifelli, Green and Wang 4 ) developed a compartmental model for vitamin A kinetics in humans following oral administration of a labelled dose and confirmed that vitamin A disposal rate is positively correlated with vitamin A stores in well-nourished American and Chinese subjects (n 26).
In human subjects, one challenge in advancing models for vitamin A metabolism is the between-subject variability in absorption of the orally administered isotopic dose. In a previous report( Reference Cifelli, Green and Wang 4 ), the standard deviations for the fractional transfer coefficients related to vitamin A absorption were over half (0·5–2 times) the estimates. A fractional standard deviation (FSD) less than 0·5 is significant, because it indicates 95 % confidence that the parameter value is different from zero( Reference Wastney, Patterson and Linares 5 ). Thus, models for which the FSD for the parameter estimates are less than 0·5 can be considered to have adequate numerical identifiability. Using these criteria, the fractional transfer coefficients related to vitamin A absorption calculated for the Cifelli et al. ( Reference Cifelli, Green and Wang 4 ) model have not been well identified. Therefore, in the present study, we investigated whether fixing a few of these parameters would positively affect the statistical aspects of the model. Specifically, we investigated whether fixing parameters related to vitamin A absorption would provide (1) sufficient statistical certainty for other parameter values, (2) the lowest sum of squares for individual subject data, and (3) reasonable population correlation coefficients for parameter estimates.
Methods
Study design and subjects
The kinetic data used in the present analysis were collected by Tang et al. ( Reference Tang, Qin and Dolnikowski 6 ) at Tufts University. For the present analysis, we included data sets from nine American subjects for whom sampling times were identical and for whom there were no missing data points. The ages of the subjects ranged from 47 to 70 years; the average age was 60·9 years. Average BMI was 25·3 kg/m2, and the highest BMI was 29·3 kg/m2. The subjects had no acute or chronic disease signs or symptoms. More details about the characteristics of the subjects have been given in the original report( Reference Tang, Qin and Dolnikowski 6 ). The present study was conducted according to the guidelines laid down in the Declaration of Helsinki, and all procedures involving human subjects were approved by the Human Investigation Review Committee of Tufts University and the Tufts-New England Medical Center. Written informed consent was obtained from all the subjects.
For the kinetic study, the participants were given a capsule containing 3 mg [2H8]retinyl acetate (8·9 μmol) in 170 mg maize oil and provided a formulated liquid breakfast containing 25 % energy from fat. Blood samples were collected by venepuncture at baseline and from 3 h to 56 d after dosing. The percentage enrichment of labelled retinol derived from retinyl acetate in serum was determined using GC-electron capture negative chemical ionisation MS as described previously( Reference Tang, Qin and Dolnikowski 6 ). More details about the methodologies and data on isotopic enrichments of serum vitamin A after dosing of [2H8]retinyl acetate have been given in the original report( Reference Tang, Qin and Dolnikowski 6 ).
Kinetic analysis and parameters
The fraction of the administered dose remaining in the serum at each time point for each subject was calculated as serum tracer concentration divided by the dose divided by the estimated serum volume. Serum volume was calculated as body weight (g) × 0·0435 ml serum/g body weight( Reference Tang, Qin and Dolnikowski 6 , Reference Wang, Yin and Zhao 7 ). Model-based compartmental analysis was applied to the tracer data for each subject using the Windows version of Simulation, Analysis and Modeling software (WinSAAM)( Reference Wastney, Patterson and Linares 5 ).
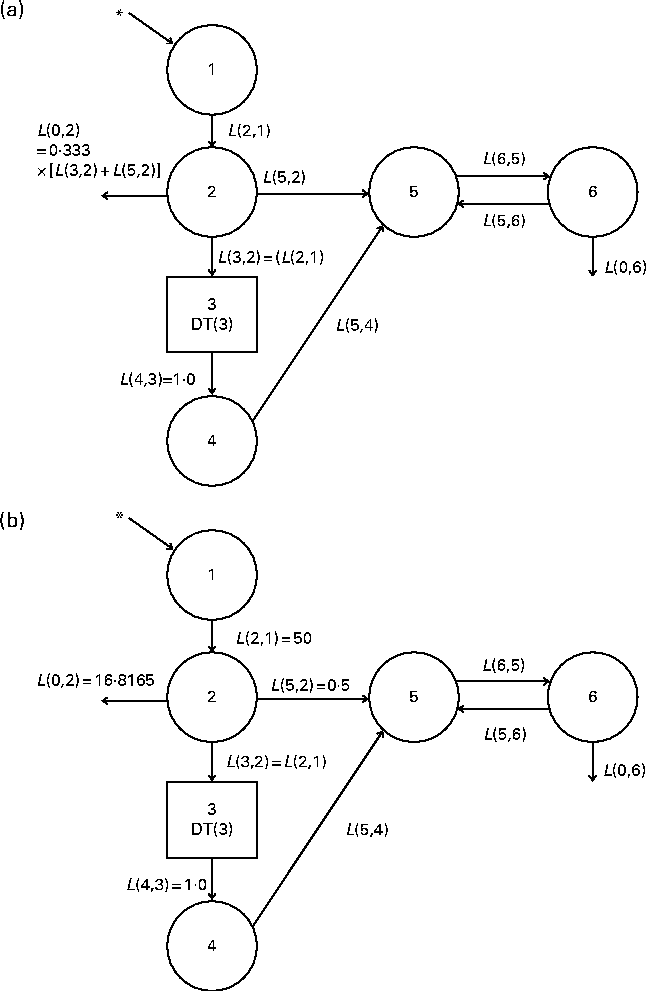
A six-compartment model with seven adjustable parameters (‘original model’; Fig. 1(a)) was first redeveloped for each subject. This original model had been developed by Cifelli et al. ( Reference Cifelli, Green and Wang 4 ), who retrospectively analysed the kinetic data collected by Tang et al. ( Reference Tang, Qin and Dolnikowski 6 ). Later, each subject's data were reanalysed using a ‘fixed-parameter model’ (Fig. 1(b)). In the fixed-parameter model, the following fractional transfer coefficients (L(I, J) (per d); the portion of vitamin A in compartment J that is transferred to compartment I each day) for absorption were fixed: L(2,1) = 50; L(5,2) = 0·5 (1 % of L(2,1)); L(0,2) = 16·8165 based on 75 % absorption efficiency( Reference Allen, Green and Green 8 ); rationale will be discussed in the Results section. Once a satisfactory fit of the data to the model was obtained for each subject, the final estimates of the fractional transfer coefficients were generated using the ITERation command for weighted non-linear regression analysis in WinSAAM. A FSD of 0·05 was used as the weighting factor.

Fig. 1 (a) Original and (b) fixed-parameter models for vitamin A kinetics in American subjects. Compartments are represented as circles, and interconnectivities between compartments correspond to fractional transfer coefficients (L(I, J), the fraction of retinol in compartment J that is transferred to compartment I each day); component 3 is a delay element. Compartments 1–4 (including component 3) represent the physiological processes of vitamin A digestion and absorption, chylomicron production and metabolism, liver uptake of chylomicron remnants, and hepatic processing of retinol. Compartment 5 represents plasma retinol bound to retinol-binding protein; this retinol exchanges with vitamin A in one extravascular pool (compartment 6). * The site of input of [2H8]retinyl acetate tracer and also the site of input for dietary vitamin A. The original multicompartmental model was proposed by Cifelli et al. ( Reference Cifelli, Green and Wang 4 ). In the fixed-parameter model, the values for several parameters related to vitamin A absorption (i.e. L(2,1), L(0,2) and L(5,2)) were held constant.
The following kinetic parameters were determined for each subject to compare the results obtained from the original and fixed-parameter models. The average time for a molecule of vitamin A to appear in the blood (mean time to plasma) after ingestion of the oral dose was calculated by summing the modified transit times in each compartment that preceded the appearance of labelled retinol in serum. Serum vitamin A pool sizes (μmol) were estimated from each subject's average serum vitamin A concentration during the study and from the estimated serum volume. Then, serum vitamin A pool sizes were used in a steady-state solution in WinSAAM to estimate vitamin A pool sizes or traced mass (M(I); μmol).
Population analysis using Extended Multiple Studies Analysis
The WinSAAM input files from the final fits for individual subjects were combined into an Extended Multiple Studies Analysis (EMSA)( Reference Lyne, Boston and Pettigrew 9 ) input file using the Project option in WinSAAM. Using this tool, the optimised parameter estimates for the subjects were reanalysed for improved parameter and variance–covariance estimates. The analysis was continued iteratively until the conditions were satisfied for a convergent maximum-likelihood solution, yielding final estimates for the population means and the variance–covariance matrices( Reference Novotny, Greif and Boston 10 ). Population parameter estimates from EMSA and parameter estimates from each individual analysis were compared.
Assessment of the numerical identifiability of the estimates
The standard deviations and correlation coefficients for parameter estimates from both individual and population estimates were used to evaluate the numerical identifiability of the parameter estimates. We assumed that a FSD less than 0·5 indicates that a parameter has been estimated with sufficient statistical certainty (chapter 11 in Wastney et al. ( Reference Wastney, Patterson and Linares 5 )). We chose a correlation coefficient threshold of 0·8, because absolute values of correlation coefficients ranging from 0·8 to 0·99 have been proposed as thresholds above which there may be a problem with numerical identifiability and multicollinearity( Reference Landaw and DiStefano 11 , Reference Rawlings, Pantula and Dickey 12 ). Individual and population covariance matrices were also analysed to evaluate numerical identifiability.
Statistical analysis
All the results are expressed as means and standard deviations. A normality test was carried out using the Anderson–Darling test before statistical analysis. Model-predicted parameters from the original v. fixed-parameter models were compared statistically using a paired t test in Minitab 16. A P value < 0·05 was considered to be significant.
Results
Model development and proposed model
We developed a model with fixed fractional transfer coefficients based on a whole-body vitamin A compartmental model proposed previously( Reference Cifelli, Green and Wang 4 ). Both the original (Fig. 1(a)) and fixed-parameter models (Fig. 1(b)) are six-compartment models that provide the best fit to the previously published serum data for individual subjects. As has been described elsewhere( Reference Cifelli, Green and Wang 4 ), compartments 1–4 represent vitamin A digestion and absorption, chylomicron metabolism including production, and liver uptake of chylomicron remnants. Compartment 1 is the site where the oral dose of labelled retinyl acetate enters the system. Compartment 2 is required as a buffer before the delay element (component 3), because WinSAAM does not allow tracer input to go directly into a delay element. We assumed an absorption efficiency of 75 %( Reference Allen, Green and Green 8 ) as in the Cifelli et al. ( Reference Cifelli, Green and Wang 4 ) study, and thus 25 % of the ingested dose was lost directly from compartment 2. Also, direct secretion of retinol bound to retinol-binding protein from enterocytes into the plasma (compartment 5) was reflected as L(5,2). Component 3, the delay element, is required in this model to account for chylomicron metabolism. The output from the delay element (L(4,3)) is set to 1·0. Compartment 4 represents hepatic processing of retinol and the subsequent secretion of retinol bound to retinol-binding protein from hepatocytes into the plasma (compartment 5). One extravascular compartment (compartment 6) is required. It is a large, slowly turning-over pool that represents vitamin A stored in the liver and extrahepatic tissues. Retinol in compartment 5 exchanges with vitamin A in compartment 6 (L(6,5) and L(5,6)).
In the fixed-parameter model (Fig. 1(b)), we fixed the values for L(2,1) and L(5,2) based on the mean values calculated using the original model for the subjects included in the present analysis. L(0,2) was calculated using the equation L(0,2) = 0·333 × (L(2,1)+L(5,2)) = 16·8165, where the constant 0·333 indicates an absorption efficiency of 75 %. All other L(I, J) were adjustable.
Comparison of model-predicted kinetic parameters for the original and fixed-parameter models
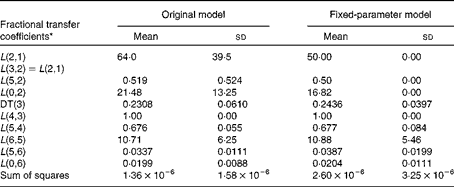
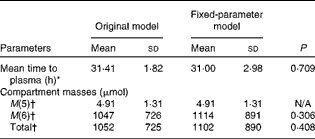
The original model has seven adjustable fractional transfer coefficients and one delay element (delay time (DT(3))), whereas the fixed-parameter model has just five adjustable parameters, since L(2,1), L(5,2) and L(0,2) are fixed. Long-term plots of the fit of the data to the original and fixed-parameter models are shown in Fig. 2. The two plots look similar upon visual inspection. The values for the fractional transfer coefficients and sums of squares for the original and fixed-parameter models are given in Table 1. The data–model fits based on the sums of squares were not different between the two models. Several other model-derived kinetic parameters were calculated (Table 2), and a paired t test was used to determine whether there were any significant differences between the model-predicted kinetic parameters for the original model and those for the fixed-parameter model. None of the predicted kinetics parameters was significantly different between the two models.

Fig. 2 Long-term plots of the data on serum tracer v. time and model predictions for vitamin A kinetics in one representative subject fit to the (a) original and (b) fixed-parameter models. Data on the fraction of the administered dose remaining in the serum at each time point were calculated as serum tracer concentration divided by the dose divided by the estimated serum volume. Serum volume was calculated as body weight (g) × 0·0435 ml serum/g body weight.
Table 1 Fractional transfer coefficients for the original and fixed-parameter models for vitamin A kinetics in American subjects (Mean values and standard deviations, n 9)

DT, delay time.
* The model-predicted fractional transfer coefficients (L(I, J) or the fraction of retinol in compartment J that is transferred to compartment I each day) and DT (DT(3) or the delay in the appearance of retinol from the time it leaves compartment 2 to the time it enters compartment 4) for the data for nine American subjects analysed in light of both the original and fixed-parameter models are reported. By convention, L(4,3) was fixed at a value of 1·00 since it follows the delay element. The models are shown in Fig. 1.
Table 2 Calculated and model-predicted kinetic parameters for the original and fixed-parameter models for vitamin A kinetics in American subjects (Mean values and standard deviations, n 9)

N/A, not applicable.
* The time after dosing for the average retinol molecule to appear in the plasma bound to retinol-binding protein.
† M(5) was calculated as the mean serum retinol concentration × estimated serum volume; M(6) is the model-predicted traced mass in extravascular compartment 6, and total = M(5)+M(6). The models are shown in Fig. 1.
Numerical identifiability of the kinetic parameter estimates for the original and fixed-parameter models
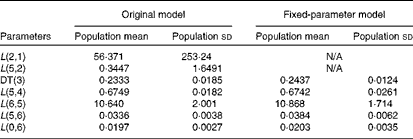
Table 3 summarises the population means and estimated errors for parameter estimates based on WinSAAM's EMSA. The FSD for L(2,1) and L(5,2) in the original model were greater than 0·5, indicating a lack of numerical identifiability. Estimation of the population parameter correlation coefficient matrices showed that there were no pairs with correlation coefficients greater than 0·8, a threshold in the present analysis (data not shown). However, individual correlation coefficient matrices for the original model showed a strong correlation between L(2,1) and/or L(5,2) and other fractional transfer coefficients in most of the subjects (Table 4). In individual correlation coefficient matrices for the fixed-parameter model, a strong correlation was observed between L(5,6) and L(0,6) for most of the subjects.
Table 3 Adjustable parameters following the Extended Multiple Studies Analysis of the original and fixed-parameter models for vitamin A kinetics in American subjects* (Population mean values and standard deviations, n 9)

N/A, not applicable; DT, delay time.
* The model-predicted fractional transfer coefficients (L(I, J)s or the fraction of retinol in compartment J that is transferred to compartment I each day) and DT (DT(3) or the delay in the appearance of retinol from the time it leaves compartment 2 to the time it enters compartment 4) for nine American subjects are reported. By convention, L(4,3) was fixed at a value of 1·00 since it follows a delay element. The models are shown in Fig. 1.
Table 4 Individual correlation coefficient matrices for the original and fixed-parameter models for vitamin A kinetics in one representative subject*

DT, delay time.
* The model-predicted fractional transfer coefficients (L(I, J) or the fraction of retinol in compartment J that is transferred to compartment I each day) and DT (DT(3) or the delay in the appearance of retinol from the time it leaves compartment 2 to the time it enters compartment 4) are reported. The models are shown in Fig. 1.
Discussion and conclusions
Although the original model( Reference Cifelli, Green and Wang 4 ) added much useful knowledge to our understanding of whole-body vitamin A kinetics in humans, the FSD for the L(I, J) associated with the initial steps in vitamin A absorption were greater than 0·5, indicating a lack of identifiability. This is probably attributable to limited data collected during the 3 h after dosing. Thus, we fixed two of the early fractional transfer coefficients (L(2,1) and L(5,2)) and reanalysed the data to determine whether this simplification would improve the model, especially the non-absorption parts.
In developing the fixed-parameter model, the focus was on evaluating several criteria. First, we examined the goodness of fit of the model to individual subjects' kinetic data, initially by visual inspection of data–model plots in WinSAAM and then by monitoring the sums of squares of residuals. In particular, we carefully examined whether the fixed-parameter model was able to accurately predict the first data point, which reflects the initial absorption of ingested labelled vitamin A. The second criterion was numerical identifiability. The numerical identifiability of the parameters in the fixed-parameter model was evaluated by comparing individual and population correlation coefficients and FSD from the EMSA output. We focused on investigating how much the fixed-parameter model would improve the individual and population numerical identifiabilities compared with those predicted by the original model.
The fractional transfer coefficients related to the initial steps in vitamin A absorption (i.e. L(2,1), L(5,2) and L(0,2); Fig. 1(a)) showed high inter-individual variability in the original model. According to the parameter classification of Jacquez et al. ( Reference Jacquez and Perry 13 , Reference Jacquez 14 ), these parameters would be categorised as non-identifiable but estimable. Jacquez( Reference Jacquez 14 ) pointed out that with SAAM, the predecessor of WinSAAM, there might be a problem in the estimation of non-identifiable parameters. Bates & Watts( Reference Bates and Watts 15 ) have noted that the modified Gauss–Newton method, which is employed in SAAM, might make a non-identifiable parameter identifiable, because the iteration process in WinSAAM seeks to minimise the sum of squared function values. Thus, WinSAAM may generate a parameter estimate with a large standard deviation, but a small sum of squares.
The data–model fit for the fixed-parameter model was as close as that for the original model (Table 1 and Fig. 2). Also, the early data points were well predicted in most of the subjects using the fixed-parameter model. Thus, based on this sample of nine subjects, we conclude that the fixed-parameter model is an adequate compartmental model for human vitamin A metabolism. In the fixed-parameter model used in the present study, we fixed L(5,2) for each subject at a value of 0·5; however, the value did not need to be the same for each subject. Since each individual may have a different pattern of kinetics for the early absorption of vitamin A, an individualised but fixed L(5,2) could be investigated as a next step in advancing the model. Since L(5,2) is affected by only one data point (the first one), it is best to fix it to reduce the number of adjustable parameters and to make the model simpler. If a value of 0·5 does not provide a good match with the first data point, a smaller value could be tested until the first data point is fit; or once a satisfactory fit is obtained using a model in which L(5,2) is adjustable, L(5,2) can be fixed later with an adjusted number from WinSAAM. The fixed-parameter model, or the suggested fixed-parameter model with an individually determined value for L(5,2) based on a careful initial review of the raw data, may hold promise as a future compartmental model for vitamin A kinetics.
As part of our evaluation of the fixed-parameter model, kinetic parameters were compared using the two models to confirm that the fixed-parameter model did not cause significant changes in the kinetic parameters. Based on the present results (Table 2), we conclude that fixing certain L(I, J) related to absorption does not affect the value of post-absorption L(I, J).
We used FSD and a correlation coefficient matrix from population and individual analyses to test whether the fixed-parameter model improved the numerical identifiability of the model parameters. The fractional transfer coefficients related to the initial steps in vitamin A absorption (L(2,1), L(5,2) and L(0,2) in Table 1) had FSD greater than 0·5 in the original model. These results are based on the aggregation of FSD from the EMSA output for individual analyses. In the original model, even though the population correlation coefficient matrix did not have any correlation coefficient with absolute values greater than 0·8, the individual correlation coefficient matrices (Table 4) showed high correlations (absolute value of correlation coefficient >0·8) between the following pairs in all the subjects: DT(3) and L(2,1); DT(3) and L(5,2); L(2,1) and L(5,2). In addition, high correlations were also found between DT(3) and L(6,5), DT(3) and L(5,4), and L(5,2) and L(6,5) in some subjects. In contrast, the individual analysis using the fixed-parameter model (Table 4) showed high correlation coefficients between only one pair in most of the subjects: L(5,6) and L(0,6). A high correlation between L(5,6) and L(0,6) is physiologically reasonable. Overall, we conclude that the fractional transfer coefficients for the fixed-parameter model were independent of each other and identifiable.
The application of model-based compartmental analysis has provided important information about vitamin A metabolism and kinetics in both animal models and humans. We showed that a model in which certain parameters are fixed improves numerical identifiability and thus holds promise for advancing compartmental modelling of vitamin A kinetics in humans when the dose must be administered orally. The present study was conducted as part of an effort to determine what are the most sensitive time points after administration of dose for collecting the smallest possible number of blood samples in human vitamin A kinetic studies. Fewer blood samples are required to develop a compartmental model when the model has a smaller number of adjustable parameters. The fixed-parameter model with just five adjustable parameters is simpler and more affordable and feasible for studies in human subjects and it does not compromise the accuracy of fitting the data. It should be noted that the validation of the fixed-parameter model approach in other populations (i.e. children, pregnant women and vitamin A-deficient individuals) is needed before it is applied more broadly.
Acknowledgements
The authors thank Dr G. Tang for generous permission to use the raw data described in Tang et al. ( Reference Tang, Qin and Dolnikowski 6 ) and J. B. Green (Penn State University) and Hyunju Park for the technical and scientific editing of this manuscript.
The present study received financial support from the College of Health and Human Development, The Pennsylvania State University. The College of Health and Human Development had no role in the design and analysis of the study or in the writing of this article.
The authors' contributions are as follows: H. P. and M. H. G. were responsible for study design, data analysis, and manuscript writing.
None of the authors has any conflicts of interest to declare.


