Hostname: page-component-586b7cd67f-t7fkt Total loading time: 0 Render date: 2024-11-28T10:27:46.980Z Has data issue: false hasContentIssue false

Spanwise unsteadiness in the sidewall-confined shock-wave/boundary-layer interaction

Published online by Cambridge University Press:  21 May 2024
Xu Liu
Affiliation:
School of Mechanical Engineering, Shanghai Jiao Tong University, Shanghai 200240, PR China
Liang Chen
Affiliation:
College of Energy and Power Engineering, Nanjing University of Aeronautics and Astronautics, Nanjing 210016, PR China
Yue Zhang
Affiliation:
College of Energy and Power Engineering, Nanjing University of Aeronautics and Astronautics, Nanjing 210016, PR China
Huijun Tan
Affiliation:
College of Energy and Power Engineering, Nanjing University of Aeronautics and Astronautics, Nanjing 210016, PR China
Yingzheng Liu
Affiliation:
School of Mechanical Engineering, Shanghai Jiao Tong University, Shanghai 200240, PR China
Di Peng*
Affiliation:
School of Mechanical Engineering, Shanghai Jiao Tong University, Shanghai 200240, PR China
*
Email address for correspondence: [email protected]

Abstract

Three-dimensional effects of sidewalls on the low-frequency unsteadiness of the shock-wave/boundary-layer interaction (SBLI) are of academic and practical importance but not yet well understood. Considerable attention has been paid to the viscous effect of sidewalls, whereas the potential inviscid confinement effect of sidewalls has received little attention. The present work provides experimental evidence of multiscale spanwise travelling waves crossing the separation front under the confinement of sidewalls. Global pressure measurements were made for a sidewall-confined 24$^\circ$ compression ramp interaction in Mach-2.83 flow using fast-responding pressure-sensitive paint. The unsteady pressure in a statistically two-dimensional intermittent region suggests that in addition to the canonical streamwise oscillation, the separation front exhibits significant low-frequency, multiscale spanwise distortion. Modal analysis further reveals that multiscale spanwise unsteadiness has higher intensity and frequency than the streamwise oscillation. Such strong spanwise unsteadiness calls attention to the low-frequency unsteadiness in previous sidewall-confined SBLI experiments and encourages further study on the mechanism of the confinement effect.

Type
JFM Rapids
Copyright
© The Author(s), 2024. Published by Cambridge University Press

1. Introduction

The sidewall-confined shock-wave/boundary-layer interaction (SBLI) commonly encountered at an inlet has attracted much attention for its academic and practical importance. The presence of sidewalls has three-dimensional (3-D) effects on the SBLI in terms of flow topology and unsteadiness. The former effect has been well clarified in terms of the viscous effect of sidewalls, which includes the displacement effect of the low-momentum corner flow and corner separation (Bruce et al. Reference Bruce, Burton, Titchener and Babinsky2011; Xiang & Babinsky Reference Xiang and Babinsky2019; Sabnis et al. Reference Sabnis, Galbraith, Babinsky and Benek2022) and the interaction between the sidewall SBLI and main SBLI (Wang et al. Reference Wang, Sandham Neil, Hu and Liu2015; Lusher & Sandham Reference Lusher and Sandham2020). The viscous aspect ratio between the boundary-layer thickness of the sidewall $\delta$ and the duct width $w$ is usually used to characterize the viscous effect of sidewalls (Bruce et al. Reference Bruce, Burton, Titchener and Babinsky2011), and the shape and size of the central separation have been found to be appreciably affected by the corner separation at $\delta /w> 0.04$. In contrast, there is an insufficient understanding of the 3-D effects on unsteadiness, especially low-frequency unsteadiness that triggers unexpected coupling with the structure and inlet instability (Clemens & Narayanaswamy Reference Clemens and Narayanaswamy2014). The low-frequency unsteadiness observed in the corner separation region possibly affects the central separation unsteadiness. However, no direct link between the corner separation unsteadiness and central separation unsteadiness was found in pressure fluctuations measured by high-frequency transducers (Funderburk & Narayanaswamy Reference Funderburk and Narayanaswamy2016; Rabey et al. Reference Rabey, Jammy, Bruce and Sandham2019).

Recently, interesting correlations between the corner and central intermittent regions were revealed through high-fidelity simulation and advanced experimental techniques. Poggie & Porter (Reference Poggie and Porter2019) performed a large-eddy simulation for a highly confined 24$^\circ$ compression ramp interaction with a large $\delta /w$ of 0.12. Their results and further unsteadiness analysis (Deshpande & Poggie Reference Deshpande and Poggie2021) highlighted the correlation of the pressure fluctuations in the corner and central intermittent regions. More interestingly, not only symmetric but also antisymmetric breathing motions of the integrated separated regions were observed. Such a spanwise antisymmetric mode was also identified in our previous work on a sidewall-confined 24$^\circ$ compression ramp interaction with a moderate $\delta /w$ of 0.05 based on fast-responding pressure-sensitive paint (fast PSP) measurements (Liu et al. Reference Liu, Zhang, Ji, He, Liu and Peng2022b). This mode corresponds to the wave-like behaviour of the separation front, which suggests another potential mechanism affecting unsteadiness, namely the confinement effect (an inviscid effect). Specifically, the sidewalls restrict the spanwise travelling waves induced by disturbances, and the continuous reflection and superposition of these waves lead to appreciable spanwise unsteadiness. The concept of the spanwise travelling wave could also explain the discrepancy between the half-span and full-span calculations of large-eddy simulation as proposed by Bisek (Reference Bisek2015).

The spanwise travelling wave is potentially an important source of low-frequency unsteadiness under the confinement effect, and it is independent of the corner separation in principle. However, it has received little attention, mainly because of the following two challenges. First, research on the 3-D effects of sidewalls is presently focused on scenarios having marked viscous effects. The existence of a spanwise travelling wave is likely masked by the coupling of the concomitant 3-D flow structures and the confinement effect. Second, there are methodological limitations to both experimental and numerical approaches. A discrete point measurement using the transducer is usually insufficient to fully capture the large-scale 3-D flow. In addition, high-fidelity numerical simulation is limited in terms of the time span and frequency resolution, which introduces difficulties in revealing low-frequency characteristics (Rabey et al. Reference Rabey, Jammy, Bruce and Sandham2019). In contrast, fast PSP measurements are a promising technique owing to their spatial and temporal advantages for fully resolving the large-scale unsteadiness in 3-D flows (Peng & Liu Reference Peng and Liu2020), for example, the unsteadiness in various SBLIs (Running & Juliano Reference Running and Juliano2021; Liu et al. Reference Liu, Zhang, Ji, He, Liu and Peng2022b; Jenquin, Johnson & Narayanaswamy Reference Jenquin, Johnson and Narayanaswamy2023).

In the present work, we have minimized the displacement effect of the corner flow and addressed the fundamental question of whether a statistically two-dimensional (2-D) region exhibits 3-D low-frequency unsteadiness due to the confinement effect and how strong. Accordingly, a fast PSP measurement combined with multiscale modal analysis was performed to investigate the spanwise unsteadiness in a supersonic sidewall-confined 24$^\circ$ compression ramp interaction with a small $\delta /w$ of 0.014, where a statistically 2-D intermittent region was obtained. The fast PSP measurement provided a global view of low-frequency unsteady pressure features in the intermittent region, especially multiscale spanwise travelling waves crossing the separation front. And the canonical streamwise oscillation was found not to be dominant in the pressure unsteadiness from the two-point correlation analysis. The intensity and spectrum of the strong spanwise unsteadiness were further analysed through discrete-Fourier-transformation-based proper orthogonal decomposition (DFT-POD) and compared with those of the canonical streamwise oscillation.

2. Methodology

2.1. Facility and test model

An experiment was conducted in the supersonic blowdown wind tunnel at Nanjing University of Aeronautics and Astronautics with an incoming flow of Mach number 2.83. The wind tunnel was an open-jet-type tunnel with a square nozzle exit section having dimensions of $200\ {\rm mm} \times 200\ {\rm mm}$. The total pressure and temperature were 101 kPa and 293 K, respectively, and the unit Reynolds number was $8.5\times 10^{6}$ m$^{-1}$. As shown in figure 1, the test model comprised a flat plate, ramp and two fences, all of which were made of steel. To obtain a fully turbulent boundary layer, the flat plate was flush mounted to the bottom of the nozzle exit. A previous velocity profile measurement (Zhuang Reference Zhuang2019) showed that the incoming boundary-layer thickness of the smooth flat plate was $\delta = 11.6$ mm (based on 99 $\%$ velocity). Moreover, the displacement thickness and the momentum thickness were $\delta ^{*} = 1.4$ mm and $\theta = 1.07$ mm (incompressible integral values), respectively, and the corresponding shape factor was $H = 1.30$. Nevertheless, a PSP layer with thickness and roughness of approximately 50 and 5 $\mathrm {\mu }$m, respectively, was applied on the plate in the present work, resulting in a slightly thicker and fuller turbulent boundary layer. The deflection angle of the compression ramp was 24$^\circ$, and the height of the ramp was 30 mm. The streamwise length between the ramp edge and nozzle exit was 100 mm. The width between the two fences was $w = 140$ mm and the height of each fence was 70 mm. A previous planar laser scattering (PLS) experiment (Zhuang et al. Reference Zhuang, Tan, Liu, Zhang and Ling2017) showed that the incoming boundary-layer thickness of the sidewall $\delta$ (based on 99 $\%$ velocity) was approximately 2.0 mm. The aspect ratio in the present work was thus estimated to be $\delta /w = 0.014$.

Figure 1. Schematic of the experimental set-up. One side of the fence is drawn as transparent to provide an internal view.

2.2. Fast PSP measurement system

The formula for fast PSP measurement adopted in the present work was developed in house (Peng et al. Reference Peng, Gu, Li and Liu2018). For the fast PSP, we selected Pt(II) meso-tetrakis (pentafluorophenyl) porphine (PtTFPP) as the luminophore and mesoporous silica particles as the host for the luminophore. The hollow structure of the mesoporous particles expanded the path of oxygen diffusion and thus reduced the response time. The frequency response calibrations show an attenuation of 6 dB at 4 kHz for the fast PSP.

The fast PSP measurement system included a pco.dimax HS4 high-speed camera and a high-power illumination excitation source, as shown in figure 1. The camera was equipped with a Nikon 50 mm/f1.2 lens and a $650\pm 25$ nm bandpass filter. The sampling rate was set at 8 kHz and the spatial resolution was determined to be 0.2 mm pixel$^{-1}$. To provide the basis of in-situ calibration, a set of pressure taps with a diameter of 1.1 mm and depth of 1.2 mm were arranged on the centreline of the plate and ramp. The pressure taps were connected to CYG503A absolute pressure transducers with a diameter of 3.5 mm through a conical segment. The transducer had a natural frequency of 200 kHz and accuracy of 0.5 $\%$ of full scale. The signals of the pressure transducers were captured using a National Instruments DAQ-PCI-6225 Card at a sampling rate of 20 kHz.

2.3. Data processing and analysis

Data for a period of 2 s were used in the subsequent processing and analysis. Postprocessing of the intensity-based measurement was conducted to obtain the spatiotemporal pressure data (Liu et al. Reference Liu, Zhang, Ji, He, Liu and Peng2022b). To improve the signal-to-noise ratio, the pressure image at each time instance was spatially filtered using a mean window with dimensions of $5 \times 5$ pixels. The power spectral density (PSD) was calculated using Welch's method with 39 segments and a 50 % overlap ratio, resulting in a frequency resolution of 10 Hz. The PSD and root-mean-square (r.m.s.) were spectrally corrected to mitigate the spectral attenuation due to the paint response and the integral effect within a finite exposure time (Funderburk & Narayanaswamy Reference Funderburk and Narayanaswamy2019; Liu et al. Reference Liu, Qin, Tang, Zhao, Wang, Liu, He and Peng2022a).

The spatiotemporal characteristics of the multiscale spanwise waves were then analysed through DFT-POD. Similar to spectral POD (Towne, Schmidt & Colonius Reference Towne, Schmidt and Colonius2018), DFT-POD in the present work first conducts DFT on the data and then performs POD on the transformed data. Nevertheless, DFT-POD conducts the spatial DFT along the span to extract spanwise wave features, which is different from the temporal DFT conducted in spectral POD. First, the spatial DFT on the spanwise fluctuating pressure ${\boldsymbol p}^\prime (x,{z,t}_j)$ was conducted for each time instance $j = 1, 2,\ldots, N_t$, where $N_t$ is the number of time instances. Considering that the half-wave is often used as a fundamental unit in spatial wave analysis, the number of DFT points was set as $N_{DFT} = 2N_z$, where $N_z$ is the number of spanwise pixels. Therefore, the spanwise DFT of ${\boldsymbol p}^\prime (x,{z,t}_j)$ is

(2.1)\begin{equation} \hat{p}(x,{\kappa,t}_j)=\sum_{m=1}^{2N_z}{p^\prime(x,{z_m,t}_j)}\ {\rm e}^{-{\rm i}{\rm \pi} (m-1)(\kappa-1)/N_z},\quad \kappa=1,2,\ldots,2N_z, \end{equation}

where ${p}^\prime (x,{z_m,t}_j)$ is set at zero for $m\geq N_z+ 1$. The resolved spanwise wavenumber $k_z$ is

(2.2)\begin{equation} k_{z,\kappa}=\begin{cases} (\kappa-1)/(2w) & \kappa\le N_z\\ (\kappa-1-2N_z)/(2w) & \kappa>N_z \end{cases}. \end{equation}

For each $k_{z,\kappa }$, we stacked $\hat {\boldsymbol p}_\kappa ^j=\hat {\boldsymbol p}(x,{\kappa,t}_j)$ for each time instance to obtain

(2.3)\begin{equation} {\hat{\boldsymbol{\mathsf{P}}}}_{k_{z,\kappa}}=[\kern 1.5pt {\hat{\boldsymbol p}}_\kappa^1\quad {\hat{\boldsymbol p}}_\kappa^2\quad \cdots \quad {\hat{\boldsymbol p}}_\kappa^{N_t}]. \end{equation}

Considering the $\hat {{\boldsymbol{\mathsf{P}}}}_{{-k}_{z,\kappa }}=\hat {\boldsymbol{\mathsf{P}}}_{k_{z,\kappa }}^{\ast }$ symmetry, where $\ast$ denotes the complex conjugate, only $k_{z,\kappa }\geq 0$ (i.e. $\kappa \le N_z$) needed to be computed. Next, we performed classical POD (Taira et al. Reference Taira, Brunton, Dawson, Rowley, Colonius, McKeon, Schmidt, Gordeyev, Theofilis and Ukeiley2017) on $\hat {\boldsymbol{\mathsf{P}}}_{k_{z,\kappa }}$ for each $k_{z,\kappa }$ according to

(2.4)\begin{equation} {\hat{\boldsymbol{\mathsf{P}}}}_{k_{z,\kappa}}{\hat{\boldsymbol{\mathsf{P}}}}_{k_{z,\kappa}}^{\rm H}{\hat{\boldsymbol \phi}}_{k_{z,\kappa},n}={\lambda_{k_{z,\kappa},n}\hat{\boldsymbol \phi}}_{k_{z,\kappa},n},\quad n=1,2,\ldots,N_x, \end{equation}

where H denotes the conjugate transpose, $\lambda _{k_{z,\kappa },n}$ and ${\hat {\boldsymbol \phi }}_{k_{z,\kappa },n}$ are, respectively, the eigenvalue and eigenvector, and $N_x$ is the number of streamwise pixels. The complex time coefficient was obtained as

(2.5)\begin{equation} a_{k_{z,\kappa},n}(t_j)=\langle \kern 1.5pt\hat{\boldsymbol p}_{\kappa}^{j} ,{\hat{\boldsymbol \phi}}_{k_{z,\kappa},n} \rangle. \end{equation}

The spatial mode ${\boldsymbol \phi }_{k_{z,\kappa },n}(x,z)$ and reconstructed fluctuating pressure were determined through the inverse DFT of ${\hat {\boldsymbol \phi }}_{k_{z,\kappa },n}(x)$ and ${a_{k_{z,\kappa },n}(t_j)\hat {\boldsymbol \phi }}_{k_{z,\kappa },n}(x)$.

3. Results and discussion

3.1. Time-averaged characteristics

Figure 2 shows the time-averaged pressure results including the global pressure distribution and streamwise pressure profiles at different spanwise locations. There is no remarkable sign of corner separation near the sidewall in figure 2(a), which was as expected owing to the small aspect ratio $\delta /w = 0.014$. A basically 2-D pressure distribution is observed across the span of the floor and the ramp in figure 2(b). After normalizing the streamwise coordinates using upstream influence length $L_u$ (defined as the distance between the onset point of the pressure change and the ramp edge), the streamwise profiles at three spanwise locations, namely $z/w = 0.02$, 0.25 and 0.45, agree well with each other and with the results for a 24$^\circ$ compression ramp interaction in a high Reynolds number, Mach-2.85 flow reported by Settles, Fitzpatrick & Bogdonoff (Reference Settles, Fitzpatrick and Bogdonoff1979), especially on the floor, which is commonly regarded as a free-interaction zone. There is a maximum difference of 8 % in $L_u$ between the midspan and two sides, which is attributed to the Mach wave originating at the leading edge of the fence, even though the leading edge was made as sharp as possible. Nevertheless, the above agreement of the streamwise profiles reveals that almost the entire span of the floor is dominated by ramp-induced separation, and the displacement effect of the corner flow and the Mach-wave effect are thus limited in this work. The spanwise average separation length $L_{sep}$ in the present work is estimated to be 37.3 mm. The PLS visualization on a similar configuration (Zhuang Reference Zhuang2019) can be referred to to further understand the global flow structure, which also exhibited that the spanwise range affected by the single-sided corner flow on the floor was within 7 mm.

Figure 2. Time-averaged dimensionless pressure: (a) pressure map on the 3-D model and (b) streamwise pressure profiles at different spanwise locations with the streamwise coordinate normalized by the upstream influence length, where S and R indicate the separation and reattachment points. The symbols $p_w$ and $p_\infty$ represent the time-averaged wall pressure and the free-stream static pressure, respectively.

3.2. Unsteadiness in the intermittent region

Figure 3 shows the distribution of the pressure fluctuation and premultiplied PSDs on the floor estimated from the fast PSP measurements, where the noise floor has been removed. In figure 3(a), there is a remarkable region with appreciable unsteadiness across the entire span within the range $x = -17$ to $-$36 mm (indicated by two white dashed lines). This statistically 2-D region is commonly regarded as the intermittent region of separation shock oscillation. The pressure signal in the intermittent region exhibits low-frequency characteristics in the range of the separation-length-based Strouhal number $St = 0.005\unicode{x2013}0.05$, as shown in figure 3(b). The weighted-average $\overline {St}$ within the resolved frequency range of 0–4000 Hz is defined as

(3.1)\begin{equation} \overline{St}=\left.\int_{0}^{4000}StG(\,f)\,\mathrm{d}f\right/\int_{0}^{4000}G(\,f)\,\mathrm{d}f, \end{equation}

where $G(\,f)$ is the PSD function. The determined $\overline {St} = 0.023$ is located in a previously reported peak $St$ range of 0.02–0.05 that is associated with the breathing motion of a separation shock and bubble system (Piponniau et al. Reference Piponniau, Dussauge, Debiève and Dupont2009). According to $\overline {St} = 0.023$, approximately 746 cycles of the low-frequency separation shock motion were captured during the 2-second signal length. As shown in figure 3(c), the streamwise variation of the premultiplied PSD along the centreline shows similar low-frequency unsteadiness throughout the intermittent region with a peak intensity located at $x = -27$ mm.

Figure 3. Pressure unsteadiness on the floor: (a) r.m.s. pressure ($p_{RMS}$) map normalized by the local time-averaged pressure, with an intermittent region between the two white dashed lines ($x = -17$ and $-$36 mm); (b) premultiplied PSDs for the PSP and transducer at the location of the cyan solid circle in (a); and (c) premultiplied PSD variation along the green solid line in (a).

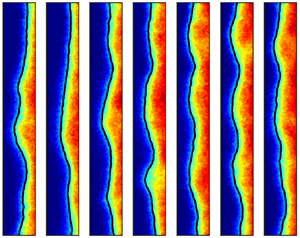
To determine the origin of the low-frequency unsteadiness in the intermittent region, consecutive pressure maps are presented in figure 4 with a time span of 3 ms (approximately one time period corresponding to $\overline {St} = 0.023$). In the instantaneous pressure maps shown in figure 4(a), in contrast with the general spanwise homogeneity in the time-averaged results, there is appreciable distortion of the separation front (approximated by the isoline of $p/p_\infty = 1.35$) across the span. This distortion has multiscale spanwise wave features as proposed by (Bisek Reference Bisek2015). The wavelengths of observed spanwise waves are several times larger than the boundary-layer thickness on the bottom wall. Such scales are distinct from the wrinkling of the separation shock induced by high-speed and low-speed streaks in the upstream boundary layer (Ganapathisubramani, Clemens & Dolling Reference Ganapathisubramani, Clemens and Dolling2007; Humble et al. Reference Humble, Elsinga, Scarano and van Oudheusden2009). Besides, the scale of these waves is significantly larger than the spanwise size of Görtler-like vortices downstream of the reattachment region (Grilli, Hickel & Adams Reference Grilli, Hickel and Adams2013; Priebe et al. Reference Priebe, Tu, Rowley and Martín2016; Zhuang et al. Reference Zhuang, Tan, Liu, Zhang and Ling2017). Such Görtler-like vortices were also observed in the present work (see supplementary movie available at https://doi.org/10.1017/jfm.2024.356), whose spanwise scales were found to be comparable with the boundary-layer thickness of the bottom wall. The spanwise behaviour of the separation front is believed to be the result of the multiple reflections and accumulation of spanwise travelling disturbances under the confinement of sidewalls. Furthermore, the shape of the separation front varies rapidly with time. The variations are superimposed into a trend of canonical streamwise oscillation that is recognized at $t = 0.5\unicode{x2013}2.5$ ms. Moreover, the spanwise distortion of the separation front is accompanied by the spanwise travelling of fluctuating pressure features as indicated by the blue dashed line in figure 4(b). It is thus basically understood that the unsteadiness in the intermittent region arises from not only streamwise oscillation but also time-varying spanwise distortion of the separation shock, namely spanwise unsteadiness.

Figure 4. Consecutive pressure maps with a time interval of 0.5 ms: (a) instantaneous pressure maps superimposed with the black isoline of $p/p_\infty = 1.35$ and (b) fluctuating pressure maps where the blue dashed lines indicate the trace of several pressure features. The coordinate range corresponds to the region enclosed by the two white dashed lines in figure 3(a).

3.3. Two-point correlation analysis

Two-point correlation analysis of fluctuating pressure is performed to examine the relationship inside the intermittent region. The correlation coefficient is determined as

(3.2)\begin{equation} R_{pp} (x,z,x_0,z_0,t,\tau)=\frac{\langle \,\boldsymbol{p}'(x,z,t+\tau), \boldsymbol{p}' (x_0,z_0,t) \rangle }{\sigma(x,z,t+\tau ) \sigma (x_0,z_0,t)}, \end{equation}

where $x$, $z$ are the streamwise and spanwise coordinates, the subscript 0 means the reference point, $t$ is the time and $\tau$ is the time delay, and $\sigma$ is the standard deviation of fluctuating pressure. The zero-delay correlation coefficient distributions on the floor with different reference points are shown in figure 5(a). High positive coefficients are found in a local area of intermittent region relative to the reference location with a spanwise range of approximately 30 mm. In other areas of intermittent region away from the reference location, the coefficient is still positive but the value decreases rapidly. This implies that the role of streamwise oscillation is not dominant in the separation shock unsteadiness, which is significantly different from the spanwise-periodic SBLI (Priebe & Martín Reference Priebe and Martín2012; Poggie & Porter Reference Poggie and Porter2019). Besides, when the reference point locates near the sidewall, no asymmetric pattern or notable negative coefficient is observed in the intermittent region, which is different from the observation in our previous work (Liu et al. Reference Liu, Zhang, Ji, He, Liu and Peng2022b). This indicates that the scales and temporal behaviour of spanwise travelling waves are more diverse in the present work. Moreover, a notable region with negative coefficient is found in the separation bubble just downstream of the reference location, which is similar to the findings reported by Jenquin et al. (Reference Jenquin, Johnson and Narayanaswamy2023) and implies the possible relationship between the intermittent region and the bubble. The space–time correlation coefficient distributions along the spanwise line of $x = -27$ mm are shown figure 5(b). Here $T$ in the horizontal axis represents a period length corresponding to $\overline {St} = 0.023$. High positive coefficient is restricted not only in the adjacent spanwise region but also in the adjacent time range, which is similar to the results in a sidewall-confined oblique SBLI reported by Rabey et al. (Reference Rabey, Jammy, Bruce and Sandham2019). Nevertheless, no obvious signature regarding the velocity or frequency of spanwise travelling pressure perturbations can be observed from the space–time correlation results. This is not surprising because the scales of pressure perturbations are various and the velocity magnitude and direction of spanwise travelling are both time-varying. In contrast, DFT-POD can provide more comprehensive evaluation about the spanwise unsteadiness as presented later.

Figure 5. Two-point correlation results with different reference points: (a) zero-delay correlation coefficient distributions on the floor; (b) space–time correlation coefficient distributions along the spanwise line at $x = -27$ mm. The $x$ coordinate of the reference points is $-$27 mm and the $z$ coordinates are $-$63, $-$35 and 0 mm, respectively. The locations of vertical dashed lines in (a) are the same as in figure 3(a).

3.4. The DFT-POD analysis

For analysis of the above multiscale spanwise unsteadiness, DFT-POD results of the fluctuating pressure in the intermittent region for $k_{z}w = 0\unicode{x2013}4$ are presented in figure 6. The results for larger $k_{z}$ are not presented here because the energy at larger $k_{z}$ is less than 20 % of the energy at $k_{z} = 0$. For each $k_{z}$, several POD modes are obtained, but the energy of the first mode is predominant as indicated by the large gap between the eigenvalues of the first two modes in figure 6(a). The subsequent analysis thus focuses on the first POD mode for each $k_{z}$. As $k_{z}$ increases from 0, the eigenvalue first increases and then gradually decreases. The peak eigenvalue is at $k_{z}w = 0.5$ and has a value 1.5 times that of the eigenvalue for $k_{z} = 0$ (labelled as $\lambda _0$). The sum of the eigenvalues for $k_{z}w = 0.5\unicode{x2013}4$ is 5.2 times $\lambda _0$, which means that non-zero $k_{z}$ (spanwise modes) make much larger contributions to the total unsteadiness relative to the contribution of $k_{z} = 0$ (streamwise oscillation mode as explained below). This is substantially different from the spanwise-periodic scenarios where streamwise oscillation dominates in the separation shock unsteadiness (Priebe & Martín Reference Priebe and Martín2012). On the other hand, the dominant scale of spanwise modes in the present work is $k_zw = 0.5$. This is significantly larger than the scale of streamwise Görtler-like vortices which were found to move along the span in the high-fidelity simulation and dynamic modal analysis of spanwise-periodic SBLIs (Priebe et al. Reference Priebe, Tu, Rowley and Martín2016; Pasquariello, Hickel & Adams Reference Pasquariello, Hickel and Adams2017). The scale of the latter is comparable with the incoming boundary-layer thickness. The same dominant scale of $k_zw = 0.5$ is also found in our measurements of other ramp angles with various separation sizes, and this is different from the streamwise streak identified in the global stability analysis (Hao Reference Hao2023), whose spanwise scale is dependent on the streamwise length of separation bubble. Moreover, the significant asymmetric modes of separation identified in different duct widths (Poggie & Porter Reference Poggie and Porter2019; Liu et al. Reference Liu, Zhang, Ji, He, Liu and Peng2022b) also imply the dominance of the spanwise mode with $k_zw = 0.5$. Therefore, the scales of spanwise modes due to the confinement effect of sidewalls are believed to be scaled with the duct width.

Figure 6. The DFT-POD results for the region shown in figure 4: (a) eigenvalue ($\lambda$) ratios of the first two POD modes for dimensionless $k_{z}w = 0\unicode{x2013}4$ relative to the first mode for $k_{z} = 0$; (b) spatial mode contours for $k_{z}w = 0\unicode{x2013}4$; (c) and (d) reconstructed consecutive fluctuating pressure maps for $k_{z}w = 0$ and 1, respectively, which are superimposed with the black isoline of $p/p_\infty = 1.35$. The amplitude of fluctuating pressure is magnified by a factor of four to zoom in the variation of the separation front; (e) dimensionless premultiplied PSDs of the time coefficient for $k_{z}w = 0\unicode{x2013}1$; (f) $\overline {St}$ variation with $k_{z}w$, where the black dashed line indicates the $\overline {St}$ of the transducer signal in the intermittent region. All the results in (bf) are for the first POD mode.

As to the spatial mode for each $k_{z}$, the mode for $k_{z} = 0$ is a spanwise homogeneous scenario as shown in figure 6(b), and the reconstructed consecutive fluctuating pressure maps show the alternating change of positive and negative fluctuating pressure in the intermittent region, which corresponds to the streamwise oscillation of the separation shock as shown in figure 6(c). In contrast, the modes for non-zero $k_{z}$ are the spanwise sinusoidal scenarios with a spatial period number of $k_{z}w$. Although these modes for non-zero $k_{z}$ exhibit standing-wave characteristics with the two sidewalls acting as free boundaries, the temporal behaviour represented by these modes is not an alternating positive and negative change at a fixed location, but rather with the simultaneous spanwise travelling owing to the complex time coefficient. Taking $k_{z}w = 1$ as an example, figure 6(d) shows that the spanwise sinusoidal pressure distribution moves in the spanwise direction with varying amplitude, and the separation front exhibits spanwise travelling wave behaviour. Such behaviour is assumed to be the superposition of multiple travelling waves with the same $k_{z}$ but different phases and frequencies.

The representative premultiplied PSDs of time coefficients for $k_{z}w = 0\unicode{x2013}1$ are presented in figure 6(e). All these spectra have low-frequency characteristics, and the overall distribution shifts to higher $St$ as $k_{z}$ increases. Interestingly, the shift does not continue as $k_{z}$ further increases. Figure 6(f) shows that the weighted-average $\overline {St}$ decreases slightly at $k_{z}w> 1$ and then increases again after $k_{z}w> 2.5$. $\overline {St} = 0.023$ for the transducer signal in the intermittent region is plotted in figure 6(f) for reference. The $\overline {St}$ for the canonical streamwise oscillation ($k_{z} = 0$) is only 0.016, and the overall $\overline {St}$ is pulled up by the spanwise unsteadiness. Consequently, it is established that the spanwise unsteadiness contributes appreciably to the intensity and frequency of the total low-frequency unsteadiness, which was previously overlooked in the analysis of measurements made at discrete points.

4. Conclusion and remark

The 3-D effects of sidewalls on the low-frequency unsteadiness of SBLI were investigated for a sidewall-confined 24$^\circ$ compression ramp interaction with $\delta /w = 0.014$ using fast PSP. The instantaneous global pressure distributions clearly show multiscale spanwise travelling waves crossing the separation front in a statistically 2-D intermittent region. These waves are superimposed on the streamwise oscillation of the separation shock. Correlation analysis shows that the high positive coefficient is restricted in the adjacent space and time ranges and the streamwise oscillation seems not dominant in the separation shock unsteadiness. The DFT-POD analysis further decomposes the spatiotemporal behaviour in the intermittent region and revealed that the multiscale spanwise unsteadiness exhibits low-frequency characteristics and has higher intensity and frequency than the canonical streamwise oscillation. The most energetic scale of $k_zw = 0.5$ distinguishes the spanwise unsteadiness in the intermittent region due to the confinement effect from that caused by streamwise vortices (Priebe et al. Reference Priebe, Tu, Rowley and Martín2016; Pasquariello et al. Reference Pasquariello, Hickel and Adams2017) in terms of the scale and intensity.

The spanwise unsteadiness in the present work likely arises from the response of the confined separation bubble and shock system to the external disturbance. And the spanwise perturbation should be taken into the consideration based on the existing models regarding the quasi-2-D scenario (Plotkin Reference Plotkin1975; Touber & Sandham Reference Touber and Sandham2011; Poggie et al. Reference Poggie, Bisek, Kimmel and Stanfield2015). Further experimental and numerical investigations, as well as stability analysis, are needed to fully reveal the origins of spanwise unsteadiness. Moreover, the current findings raise an important question about how to understand, scale and model low-frequency unsteadiness in previous quasi-2-D SBLI experiments with possible spanwise unsteadiness. Further efforts should be made to clarify the effects of key factors (e.g. the aspect ratio, interaction strength and geometry) on the spanwise unsteadiness. Interestingly, spanwise propagating pressure perturbations are also identified in the intermittent region in an inward-turning axisymmetric compression ramp (Jenquin et al. Reference Jenquin, Johnson and Narayanaswamy2023), which implies the broadness of confinement effect (caused by concave surface in their work) on the separation shock unsteadiness.

Supplementary movie

Supplementary movie is available at https://doi.org/10.1017/jfm.2024.356.

Funding

This work was supported by the National Natural Science Foundation of China (NSFC nos 12022202 & 12227803) and the Gas Turbine Research Institute of Shanghai Jiao Tong University.

Declaration of interests

The authors report no conflict of interest.

References

Bisek, N.J. 2015 Sidewall interaction of a supersonic flow over a compression ramp. AIAA Paper 2015-1976.CrossRefGoogle Scholar
Bruce, P.J.K., Burton, D.M.F., Titchener, N.A. & Babinsky, H. 2011 Corner effect and separation in transonic channel flows. J. Fluid Mech. 679, 247262.CrossRefGoogle Scholar
Clemens, N.T. & Narayanaswamy, V. 2014 Low-frequency unsteadiness of shock wave/turbulent boundary layer interactions. Annu. Rev. Fluid Mech. 46 (1), 469492.CrossRefGoogle Scholar
Deshpande, A.S. & Poggie, J. 2021 Large-scale unsteadiness in a compression ramp flow confined by sidewalls. Phys. Rev. Fluids 6 (2), 024610.CrossRefGoogle Scholar
Funderburk, M. & Narayanaswamy, V. 2016 Experimental investigation of primary and corner shock boundary layer interactions at mild back pressure ratios. Phys. Fluids 28 (8), 086102.CrossRefGoogle Scholar
Funderburk, M.L. & Narayanaswamy, V. 2019 Spectral signal quality of fast pressure sensitive paint measurements in turbulent shock-wave/boundary layer interactions. Exp. Fluids 60 (10), 154.CrossRefGoogle Scholar
Ganapathisubramani, B., Clemens, N.T. & Dolling, D.S. 2007 Effects of upstream boundary layer on the unsteadiness of shock-induced separation. J. Fluid Mech. 585, 369394.CrossRefGoogle Scholar
Grilli, M., Hickel, S. & Adams, N.A. 2013 Large-eddy simulation of a supersonic turbulent boundary layer over a compression–expansion ramp. Intl J. Heat Fluid Flow 42, 7993.CrossRefGoogle Scholar
Hao, J. 2023 On the low-frequency unsteadiness in shock wave–turbulent boundary layer interactions. J. Fluid Mech. 971, A28.CrossRefGoogle Scholar
Humble, R.A., Elsinga, G.E., Scarano, F. & van Oudheusden, B.W. 2009 Stimulated detached eddy simulation of three-dimensional shock/boundary layer interaction. J. Fluid Mech. 622, 3362.CrossRefGoogle Scholar
Jenquin, C., Johnson, E.C. & Narayanaswamy, V. 2023 Investigations of shock–boundary layer interaction dynamics using high-bandwidth pressure field imaging. J. Fluid Mech. 961, A5.CrossRefGoogle Scholar
Liu, X., Qin, C., Tang, Y., Zhao, K., Wang, P., Liu, Y., He, C. & Peng, D. 2022 a Resolving dynamic features of kilohertz pressure fluctuations using fast-responding pressure-sensitive paint: measurement of inclined jet impingement. Exp. Fluids 63 (4), 72.CrossRefGoogle Scholar
Liu, X., Zhang, L., Ji, Y., He, M., Liu, Y. & Peng, D. 2022 b Fast PSP measurement of three-dimensional low-frequency unsteadiness in sidewall-confined shock wave/turbulent boundary layer interaction. Exp. Therm. Fluid Sci. 134, 110599.CrossRefGoogle Scholar
Lusher, D.J. & Sandham, N.D. 2020 The effect of flow confinement on laminar shock-wave/boundary-layer interactions. J. Fluid Mech. 897, A18.CrossRefGoogle Scholar
Pasquariello, V., Hickel, S. & Adams, N.A. 2017 Unsteady effects of strong shock-wave/boundary-layer interaction at high Reynolds number. J. Fluid Mech. 823, 617657.CrossRefGoogle Scholar
Peng, D., Gu, F., Li, Y. & Liu, Y. 2018 A novel sprayable fast-responding pressure-sensitive paint based on mesoporous silicone dioxide particles. Sens. Actuators A Phys. 279, 390398.CrossRefGoogle Scholar
Peng, D. & Liu, Y.Z. 2020 Fast pressure-sensitive paint for understanding complex flows: from regular to harsh environments. Exp. Fluids 61 (1), 8.CrossRefGoogle Scholar
Piponniau, S., Dussauge, J.P., Debiève, J.F. & Dupont, P. 2009 A simple model for low-frequency unsteadiness in shock-induced separation. J. Fluid Mech. 629, 87108.CrossRefGoogle Scholar
Plotkin, K.J. 1975 Shock wave oscillation driven by turbulent boundary-layer fluctuations. AIAA J. 13 (8), 10361040.CrossRefGoogle Scholar
Poggie, J., Bisek, N.J., Kimmel, R.L. & Stanfield, S.A. 2015 Spectral characteristics of separation shock unsteadiness. AIAA J. 53 (1), 200214.CrossRefGoogle Scholar
Poggie, J. & Porter, K.M. 2019 Flow structure and unsteadiness in a highly confined shock-wave–boundary-layer interaction. Phys. Rev. Fluids 4 (2), 024602.CrossRefGoogle Scholar
Priebe, S. & Martín, M.P. 2012 Low-frequency unsteadiness in shock wave–turbulent boundary layer interaction. J. Fluid Mech. 699, 149.CrossRefGoogle Scholar
Priebe, S., Tu, J.H., Rowley, C.W. & Martín, M.P. 2016 Low-frequency dynamics in a shock-induced separated flow. J. Fluid Mech. 807, 441477.CrossRefGoogle Scholar
Rabey, P.K., Jammy, S.P., Bruce, P.J.K. & Sandham, N.D. 2019 Two-dimensional unsteadiness map of oblique shock wave/boundary layer interaction with sidewalls. J. Fluid Mech. 871, R4.CrossRefGoogle Scholar
Running, C.L. & Juliano, T.J. 2021 Global measurements of hypersonic shock-wave/boundary-layer interactions with pressure-sensitive paint. Exp. Fluids 62 (5), 91.CrossRefGoogle Scholar
Sabnis, K., Galbraith, D.S., Babinsky, H. & Benek, J.A. 2022 Nozzle geometry effects on supersonic wind tunnel studies of shock–boundary-layer interactions. Exp. Fluids 63 (12), 191.CrossRefGoogle Scholar
Settles, G.S., Fitzpatrick, T.J. & Bogdonoff, S.M. 1979 Detailed study of attached and separated compression corner flowfields in high Reynolds number supersonic flow. AIAA J. 17 (6), 579585.CrossRefGoogle Scholar
Taira, K., Brunton, S.L., Dawson, S.T.M., Rowley, C.W., Colonius, T., McKeon, B.J., Schmidt, O.T., Gordeyev, S., Theofilis, V. & Ukeiley, L.S. 2017 Modal analysis of fluid flows: an overview. AIAA J. 55 (12), 40134041.CrossRefGoogle Scholar
Touber, E. & Sandham, N.D. 2011 Low-order stochastic modelling of low-frequency motions in reflected shock-wave/boundary-layer interactions. J. Fluid Mech. 671, 417465.CrossRefGoogle Scholar
Towne, A., Schmidt, O.T. & Colonius, T. 2018 Spectral proper orthogonal decomposition and its relationship to dynamic mode decomposition and resolvent analysis. J. Fluid Mech. 847, 821867.CrossRefGoogle Scholar
Wang, B., Sandham Neil, D., Hu, Z. & Liu, W. 2015 Numerical study of oblique shock-wave/ boundary-layer interaction considering sidewall effects. J. Fluid Mech. 767, 526561.CrossRefGoogle Scholar
Xiang, X. & Babinsky, H. 2019 Corner effects for oblique shock wave/turbulent boundary layer interactions in rectangular channels. J. Fluid Mech. 862, 10601083.CrossRefGoogle Scholar
Zhuang, Y. 2019 Multiple observation scales based fundamental investigations on the shock wave/turbulent boundary-layer interaction. PhD thesis, Nanjing University of Aeronautics and Astronautics.Google Scholar
Zhuang, Y., Tan, H., Liu, Y., Zhang, Y. & Ling, Y. 2017 High resolution visualization of Görtler-like vortices in supersonic compression ramp flow. J. Vis. 20 (3), 505508.CrossRefGoogle Scholar
Figure 0

Figure 1. Schematic of the experimental set-up. One side of the fence is drawn as transparent to provide an internal view.

Figure 1

Figure 2. Time-averaged dimensionless pressure: (a) pressure map on the 3-D model and (b) streamwise pressure profiles at different spanwise locations with the streamwise coordinate normalized by the upstream influence length, where S and R indicate the separation and reattachment points. The symbols $p_w$ and $p_\infty$ represent the time-averaged wall pressure and the free-stream static pressure, respectively.

Figure 2

Figure 3. Pressure unsteadiness on the floor: (a) r.m.s. pressure ($p_{RMS}$) map normalized by the local time-averaged pressure, with an intermittent region between the two white dashed lines ($x = -17$ and $-$36 mm); (b) premultiplied PSDs for the PSP and transducer at the location of the cyan solid circle in (a); and (c) premultiplied PSD variation along the green solid line in (a).

Figure 3

Figure 4. Consecutive pressure maps with a time interval of 0.5 ms: (a) instantaneous pressure maps superimposed with the black isoline of $p/p_\infty = 1.35$ and (b) fluctuating pressure maps where the blue dashed lines indicate the trace of several pressure features. The coordinate range corresponds to the region enclosed by the two white dashed lines in figure 3(a).

Figure 4

Figure 5. Two-point correlation results with different reference points: (a) zero-delay correlation coefficient distributions on the floor; (b) space–time correlation coefficient distributions along the spanwise line at $x = -27$ mm. The $x$ coordinate of the reference points is $-$27 mm and the $z$ coordinates are $-$63, $-$35 and 0 mm, respectively. The locations of vertical dashed lines in (a) are the same as in figure 3(a).

Figure 5

Figure 6. The DFT-POD results for the region shown in figure 4: (a) eigenvalue ($\lambda$) ratios of the first two POD modes for dimensionless $k_{z}w = 0\unicode{x2013}4$ relative to the first mode for $k_{z} = 0$; (b) spatial mode contours for $k_{z}w = 0\unicode{x2013}4$; (c) and (d) reconstructed consecutive fluctuating pressure maps for $k_{z}w = 0$ and 1, respectively, which are superimposed with the black isoline of $p/p_\infty = 1.35$. The amplitude of fluctuating pressure is magnified by a factor of four to zoom in the variation of the separation front; (e) dimensionless premultiplied PSDs of the time coefficient for $k_{z}w = 0\unicode{x2013}1$; (f) $\overline {St}$ variation with $k_{z}w$, where the black dashed line indicates the $\overline {St}$ of the transducer signal in the intermittent region. All the results in (bf) are for the first POD mode.

Supplementary material: File

Liu et al. supplementary movie

Instantaneous pressure fields
Download Liu et al. supplementary movie(File)
File 7.2 MB