Introduction
The most species-rich lichen communities are found in tropical rainforests and various types of dry forest and climatic and edaphic savannah vegetation, including the Brazilian Cerrado and Caatinga, where they cover the bark and leaves of trees and shrubs from the shady understorey to the exposed canopy (Cornelissen & ter Steege Reference Cornelissen and ter Steege1989; Sipman & Harris Reference Sipman and Harris1989; Montfoort & Ek Reference Montfoort and Ek1990; Marcelli Reference Marcelli1992; Wolf Reference Wolf1993; Biedinger & Fischer Reference Biedinger and Fischer1996; Komposch & Hafellner Reference Komposch and Hafellner1999, Reference Komposch and Hafellner2000, Reference Komposch and Hafellner2002, Reference Komposch and Hafellner2003; Lücking Reference Lücking2001, Reference Lücking2008; Nöske & Sipman Reference Nöske and Sipman2004; Holz & Gradstein Reference Holz and Gradstein2005; Lakatos et al. Reference Lakatos, Rascher and Büdel2006; Cáceres et al. Reference Cáceres, Lücking and Rambold2007, Reference Cáceres, Lücking and Rambold2008). Such communities hold various ‘richness’ records, from the most species on single leaves (50–82 in Costa Rica and Ecuador; Lücking & Matzer Reference Lücking and Matzer2001), to the most species on a single tree (173 in Papua New Guinea; Aptroot Reference Aptroot1997), to the most species within a given plot (up to 600 in Costa Rica; Lücking et al. Reference Lücking, Seavey, Common, Beeching, Breuss, Buck, Crane, Hodges, Hodkinson and Lay2011).
While these tropical lichen communities are taxonomically diverse, they are dominated by a few, large families of crustose to microsquamulose taxa: the Gomphillaceae, Graphidaceae, Pilocarpaceae, Porinaceae, Pyrenulaceae, Ramalinaceae, and Trypetheliaceae (Sipman & Harris Reference Sipman and Harris1989; Rivas Plata et al. Reference Rivas Plata, Lücking and Lumbsch2008). Trypetheliaceae is the second most diverse group among corticolous lichens after Graphidaceae, both in number of species and in morphological diversity, and is found abundantly in rainforests, dry forests, and savannahs (Komposch & Hafellner Reference Komposch and Hafellner1999, Reference Komposch and Hafellner2000, Reference Komposch and Hafellner2002, Reference Komposch and Hafellner2003; Aptroot et al. Reference Aptroot, Lücking, Sipman, Umaña and Chaves2008, 2013 Reference Aptroot, Menezes, de Lima, Xavier-Leite and Cáceresa ; Aptroot 2009 Reference Aptroota , Reference Aptrootb ). The phylogenetic position and classification of the family has been revised recently (Del Prado et al. Reference Del Prado, Schmitt, Kautz, Palice, Lücking and Lumbsch2006; Nelsen et al. Reference Nelsen, Lücking, Grube, Mbatchou, Muggia, Rivas Plata and Lumbsch2009, Reference Nelsen, Lücking, Mbatchou, Andrew, Spielmann and Lumbsch2011, Reference Nelsen, Lücking, Aptroot, Andrew, Cáceres, Rivas Plata, Gueidan, da Silva Canêz, Knight and Ludwig2014; Hyde et al. Reference Hyde, Jones, Liu, Ariyawansha, Boehm, Boonmee, Braun, Chomnunti, Crous and Dai2013) and a new generic concept was introduced to delimit more natural groups (Aptroot et al. 2013 Reference Aptroot, Nelsen and Parnmenb ; Nelsen et al. Reference Nelsen, Lücking, Aptroot, Andrew, Cáceres, Rivas Plata, Gueidan, da Silva Canêz, Knight and Ludwig2014). With this concept as a framework, nearly 400 species are currently distinguished, including a large number of newly discovered taxa described in recent years and in this issue (Aptroot et al. 2013 Reference Aptroot, Menezes, de Lima, Xavier-Leite and Cáceresa ; Lima et al. Reference Lima, Maia, Aptroot and Cáceres2013; Córdova-Chávez et al. Reference Córdova-Chávez, Aptroot, Castillo-Camposa, Cáceres and Pérez-Pérez2014; Weerakoon & Aptroot Reference Weerakoon and Aptroot2014). However, most of the data available on the diversity of this family are from a small number of tropical regions, focusing on Costa Rica, the Guianas, the Brazilian Amazon and north-east region, the Indian subcontinent including Sri Lanka, and Australia (Makhija & Patwardhan Reference Makhija and Patwardhan1988, Reference Makhija and Patwardhan1993; Aptroot et al. Reference Aptroot, Lücking, Sipman, Umaña and Chaves2008, 2013 Reference Aptroot, Menezes, de Lima, Xavier-Leite and Cáceresa ; Aptroot 2009 Reference Aptroota , Reference Aptrootb ; Singh & Sinha Reference Singh and Sinha2010; Weerakoon & Aptroot Reference Weerakoon and Aptroot2014), whereas many other areas are still understudied or not explored at all.
In this paper, we use a quantitative approach that extrapolates from sampling effort to predict the global species richness of Trypetheliaceae. The method has previously been used for Graphidaceae, predicting 1800 undiscovered species worldwide (Lücking et al. 2014 Reference Lücking, Johnston, Aptroot, Kraichak, Lendemer, Boonpragob, Cáceres, Ertz, Ferraro and Jiaa ), and for the basidiolichen genera Cora and Corella in the Hygrophoraceae, predicting over 450 species in the Americas (Lücking et al. 2014 Reference Lücking, Dal-Forno, Sikaroodi, Gillevet, Bungartz, Moncada, Yánez-Ayabaca, Chaves, Coca and Lawreyb ). The underlying idea of this approach is to divide the target area into grids and establish a strong correlation between observed species richness and richness predictors, including environmental variables and sampling effort as parameters. The expected species richness per grid can then be predicted by setting sampling effort to the theoretical maximum value per grid and estimating the average grid distribution per species. This simple formula is based on the relation between alpha, beta and gamma diversity first established by Whittaker (Reference Whittaker1960).
Material and Methods
With few exceptions, Trypetheliaceae are restricted to (sub-)tropical forest and savannah ecosystems. For this reason, we used the same global grid system as previously implemented for Graphidaceae (Lücking et al. 2014 Reference Lücking, Johnston, Aptroot, Kraichak, Lendemer, Boonpragob, Cáceres, Ertz, Ferraro and Jiaa ), a grid map ranging from 30° northern to 30° southern latitude, with grids 15° longitude by 15° latitude, corresponding to c. 1600 km in each direction or c. 2·5 million km2 per grid, about 30% of the area of Brazil. This resulted in 46 grids covering land areas or archipelagos with known data on (sub-)tropical Trypetheliaceae (Fig. 1; Table 1).

Fig. 1 Global 15°×15° grid map used for a statistical approach to predicting global species richness for Trypetheliaceae, using as reference an ArcGIS vegetation map derived from Bailey & Hogg (Reference Bailey and Hogg1986) and Bailey (Reference Bailey1989) with ecosystem divisions. The key refers to the 30 divisions plus freshwater lakes. Grid numbers refer to those used in Table 1.
Table 1 Global 15°×15° grids (grid numbers correspond to those in Fig. 1) and grid-based scores (see Supplementary Materials A & B, available online). Total score is the product of sampling, vegetation, remote, and region scores; predicted richness is based on setting the sampling score to maximum (5)

Sampling score=sampling effort per grid, ranges from 0 (unsampled) to 5 (assumed maximum sampling effort); vegetation score=presence and extent of global vegetation types in each grid, combined with a value corresponding to the observed preferences of Trypetheliaceae relative to each vegetation type; remote score=1 or 0·7 which is presence on only small, remote islands; region score=2 (Neotropics) or 1 (Palaeotropics).
+++=differences between predicted and observed numbers of 100 or higher; ++=50–99; +=25–49. See also Fig. 4 (negative differences are the result of the smoothing effect of the regression).
Based on published and unpublished data and after careful taxonomic revision that considers revised genus and species concepts, we assembled a global working checklist of species in Trypetheliaceae relative to the grid map (see Supplementary Material A, available online). In addition to publications in the present issue, works reviewed for this purpose include, but are not restricted to: Trevisan (Reference Trevisan1861), Müller (Reference Müller1888), Malme (Reference Malme1924), Dodge (Reference Dodge1953), Letrouit-Galinou (Reference Letrouit-Galinou1957, Reference Letrouit-Galinou1958), Harris (Reference Harris1984, Reference Harris1991, Reference Harris1998), Makhija & Patwardhan (Reference Makhija and Patwardhan1988, Reference Makhija and Patwardhan1993), Aptroot (Reference Aptroot1991, 2009 Reference Aptroota , Reference Aptrootb ), McCarthy & Kantvilas (Reference McCarthy and Kantvilas1993), McCarthy (Reference McCarthy1995), Komposch & Hafellner (Reference Komposch and Hafellner1999, Reference Komposch and Hafellner2000, Reference Komposch and Hafellner2002, Reference Komposch and Hafellner2003), Aptroot & Ferraro (Reference Aptroot and Ferraro2000), Komposch et al. (Reference Komposch, Aptroot and Hafellner2002), Lücking et al. (Reference Lücking, Sipman, Umaña, Chaves and Lumbsch2007), Aptroot et al. (Reference Aptroot, Lücking, Sipman, Umaña and Chaves2008, 2013 Reference Aptroot, Menezes, de Lima, Xavier-Leite and Cáceresa ), Singh & Sinha (Reference Singh and Sinha2010), Rout et al. (Reference Rout, Bichitra Singha and Upreti2012), Lima et al. (Reference Lima, Maia, Aptroot and Cáceres2013), Córdova-Chávez et al. (Reference Córdova-Chávez, Aptroot, Castillo-Camposa, Cáceres and Pérez-Pérez2014), and Weerakoon & Aptroot (Reference Weerakoon and Aptroot2014).
Following Lücking et al. (2014 Reference Lücking, Johnston, Aptroot, Kraichak, Lendemer, Boonpragob, Cáceres, Ertz, Ferraro and Jiaa ), we assembled a richness prediction score by taking into account four variables developed as scores for each grid (Table 1): 1) sampling score (i.e. sampling effort per grid), ranging from 0 (unsampled) to 5 (assumed maximum sampling effort); 2) vegetation score (i.e. presence and extent of global vegetation types in each grid), combined with a value corresponding to the observed preferences of Trypetheliaceae relative to each vegetation type; 3) remote score, being either 1 or 0·7, relating to the presence of only small, remote islands (more than 1000 km from the next continent or large island); and 4) region score, either 2 (Neotropics) or 1 (Palaeotropics), which was based on observations made from the six well-sampled grids (sampling score 4, see below), two in the Neotropics and four in the Palaeotropics. The two neotropical grids yielded 75 species on average (73 and 77), whereas the four palaeotropical grids yielded 42 species on average (52, 31, 60, 26), that is about half as many, which coincides with additional experience by the authors in other grids, either through fieldwork or revising collections (Mexico, Costa Rica, Puerto Rico, Colombia, Venezuela, Guianas, Brazil, Cameroon, Tanzania, Madagascar, Thailand, Australia, New Caledonia). Hence this difference, rather than a sampling bias, suggests an underlying difference in the evolutionary history of Trypetheliaceae in these regions.
The remote score is based on the notion that remote islands have a reduced species richness due to dispersal limitations that may only partly be balanced by endemic radiations. Since currently there are not enough data to elaborate this score in a more detailed fashion, we used the same score of 0·7 for grids 45 and 46 (New Caledonia, Hawaii) as developed for Graphidaceae (Lücking et al. 2014 Reference Lücking, Johnston, Aptroot, Kraichak, Lendemer, Boonpragob, Cáceres, Ertz, Ferraro and Jiaa ), whereas all other grids received a score of 1. The exact determination has very little influence on the overall results, since varying the score for these two grids between 0·1 and 1 changes the overall prediction by less than 1%.
Sampling scores were derived from data obtained from published literature and revisions of herbarium collections, as well as recent fieldwork outlined in the aforementioned publications. To determine the score, we counted the number of publications available and their geographical spread within each grid following Lücking et al. (2014 Reference Lücking, Johnston, Aptroot, Kraichak, Lendemer, Boonpragob, Cáceres, Ertz, Ferraro and Jiaa : table 3), along with an evaluation of the underlying taxonomic concept in each case, plus the number and geographical spread of additional, unpublished collections available and revised by us. Since the authors of the present paper were involved in many of the previously published inventories, or else had access to the material, including representative specimens from India, we were able to standardize this information. Possible subjective bias was further limited by the low range of sampling scores allowed (0 to 5). As a result, no grid was considered well sampled (score 5) but six grids were scored as reasonably well sampled (score 4), viz. grids 3, 11, 36, 39, 41, and 45 (Table 1).
For the definition of vegetation types, we followed Lücking et al. (2014 Reference Lücking, Johnston, Aptroot, Kraichak, Lendemer, Boonpragob, Cáceres, Ertz, Ferraro and Jiaa ) in using the global vegetation map provided by Bailey & Hogg (Reference Bailey and Hogg1986) and Bailey (Reference Bailey1989), specifically their intermediate division classification level (see Supplementary Material B, available online), since Trypetheliaceae have a world distribution, concentrated in the tropics, similar to that of Graphidaceae. The land area of each division was calculated for each 15° latitude by 15° longitude grid cell (Fig. 1) in ArcGIS 10.1 (Spatial Analyst extension). We used a cylindrical equal area projection, which spaced longitudinal lines to form similarly sized rectangular grids, accounting for ocean surface present within grid cells (see Supplementary Material B). Since species richness is logarithmically correlated with area size, we transformed all area values using the exponent 0·25 (see Supplementary Material B), which had previously been identified as a well-fitting model for area-species relationships in Graphidaceae (Lücking et al. 2014 Reference Lücking, Johnston, Aptroot, Kraichak, Lendemer, Boonpragob, Cáceres, Ertz, Ferraro and Jiaa ). The Bailey map does not contain data for small islands, so we computed vegetation cover for grids 45 and 46 (New Caledonia, Hawaii) using separate vegetation maps, and also performed corrections for grid 4 (Hispaniola, Puerto Rico, Lesser Antilles) as outlined by Lücking et al. (2014 Reference Lücking, Johnston, Aptroot, Kraichak, Lendemer, Boonpragob, Cáceres, Ertz, Ferraro and Jiaa ).
We assigned each vegetation type (Bailey province) a score corresponding to the richness of Trypetheliaceae expected within that vegetation type (Table 2; see Supplementary Material B, available online), using data from quantitative studies that include Trypetheliaceae to rank vegetation types (provinces) according to expected diversity (Cornelissen & ter Steege Reference Cornelissen and ter Steege1989; Montfoort & Ek Reference Montfoort and Ek1990; Komposch & Hafellner Reference Komposch and Hafellner1999, Reference Komposch and Hafellner2000, Reference Komposch and Hafellner2002, Reference Komposch and Hafellner2003; Nöske & Sipman Reference Nöske and Sipman2004; Holz & Gradstein Reference Holz and Gradstein2005; Lakatos et al. Reference Lakatos, Rascher and Büdel2006; Cáceres et al. Reference Cáceres, Lücking and Rambold2007, Reference Cáceres, Lücking and Rambold2008; Aptroot et al. Reference Aptroot, Lücking, Sipman, Umaña and Chaves2008; Rivas Plata et al. Reference Rivas Plata, Lücking and Lumbsch2008). In Graphidaceae, vegetation types that contribute uniquely and substantially to overall species richness are the rainforest and rainforest mountain divisions and the savannah and savannah mountain divisions where they are found mainly in the rainforest canopy (Lücking et al. 2014 Reference Lücking, Johnston, Aptroot, Kraichak, Lendemer, Boonpragob, Cáceres, Ertz, Ferraro and Jiaa ). In Trypetheliaceae, the latter two divisions also provide unique taxa, such as in the genera Bogoriella and Polymeridium (Aptroot et al. 2013 Reference Aptroot, Menezes, de Lima, Xavier-Leite and Cáceresa ). Accordingly, we used a slightly different relative scaling of vegetation scores for Trypetheliaceae, with increased scores for the savannah division (Table 2; see Supplementary Material B, available online).
Table 2 Trypetheliaceae species richness scores for different vegetation types (Bailey divisions and provinces). For nomenclature and numbers see Supplementary Material B (available online)

For each grid, the vegetation score was then computed as the sum of the scores for each Bailey vegetation province present: [Vegetation Score]=SUMGrid [province extent]0·25×[Trypetheliaceae Richness Score]. Following Lücking et al. (2014 Reference Lücking, Johnston, Aptroot, Kraichak, Lendemer, Boonpragob, Cáceres, Ertz, Ferraro and Jiaa ), sampling, vegetation, remote and region scores were subsequently combined into a total prediction score for each grid by simple multiplication (Table 1).
Variation of observed species richness per grid was compared to variation in total prediction scores by means of linear regression as best fit, using the distribution fitting module in STATISTICA 6.0. Predicted species richness per grid was then computed from the linear model using the maximum sampling score for each grid (5). In addition, predicted global species richness was calculated by dividing the sum total of individual grid species richness by the average number of grids in which a species was estimated to be present. To that end, we applied “histogram maximization” as suggested in Lücking et al. (2014 Reference Lücking, Dal-Forno, Sikaroodi, Gillevet, Bungartz, Moncada, Yánez-Ayabaca, Chaves, Coca and Lawreyb ). This method assumes that with further species discoveries, the shape of the frequency histogram remains relatively constant, which allows extrapolation of the number of species added in each category, an approach analogous to the calculation of Chao values (Chao Reference Chao1984, Reference Chao1987), since most additional species will appear in the rare categories occurring in only one or two grids. First, we established the frequency histogram of observed species occurrences (i.e. number of species by number of grids in which species are present). Since the maximum number of grids in which the most frequent species was observed was 30, but the maximum number of possible grids was 46, we then artificially ‘expanded’ the x-axis by multiplying each grid number by the quotient of 46/30 and using the integer of the result. Thus, the maximum observed grid number 30 became the maximum possible grid number 46, grid number 15 became grid number 23, and grid number 1 became grid number 2, and so on. To each of these, the observed species number was added, which then allows us to estimate the expected numbers for the ‘empty’ grids via linear inter- and extrapolation. To that end, the frequency histogram was log-log transformed to apply linear regression and then back-transformed to compute the estimated number of species per grid category. This resulted in an estimate of the average grid number per species; it also provides an independent test of the global species richness prediction, since the sum over all grids of the regression estimates corresponds to the predicted total richness.
Results
We assembled a list of 421 taxa of Trypetheliaceae (see Supplementary Material A, available online), which included the 418 species formally accepted in the family (Aptroot & Lücking Reference Aptroot and Lücking2016) plus three undescribed taxa; 418 of these were present in at least one of the 46 grids, whereas three further species (Aptrootia robusta, Bogoriella collospora, B. striguloides) were exclusively extratropical. Observed species richness per grid ranged from zero in the sub-Saharan African grids 16–18 to a maximum of 106–127 in grids 6, 7, and 9, which correspond to the western Amazon and savannah regions of Colombia, Venezuela, the Guianas, and north-western Brazil (Table 1, Fig. 2). Notably, the highest observed species richness was observed in grids considered moderately well sampled (sampling score 3). In contrast, the best-sampled grids (sampling score 4), grids 3 (Caribbean), 11 (north-eastern Brazil), 36 (southern India, Sri Lanka), 39 (Philippines), 41 (Papua New Guinea), and 45 (chiefly New Caledonia) had low to moderate observed species richness, ranging between 26 and 77 taxa.
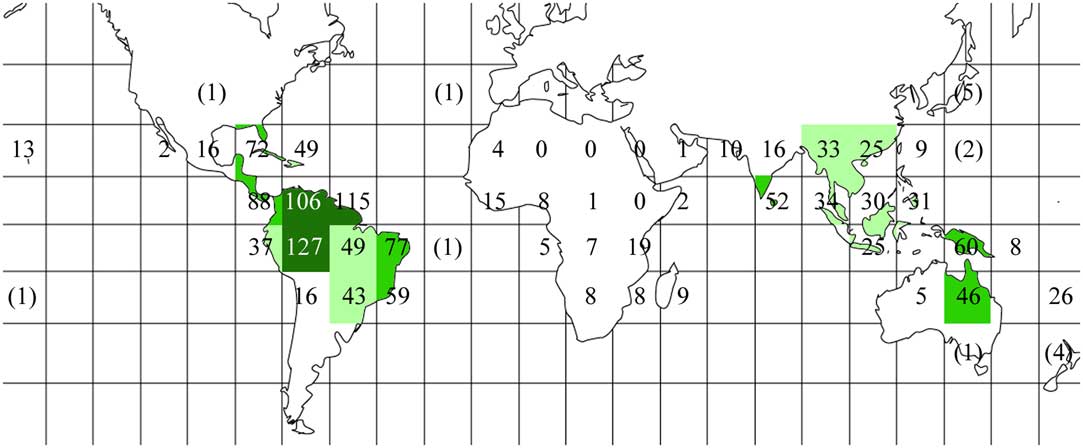
Fig. 2 Global observed species richness heat map for Trypetheliaceae based on data presented in Table 1, using the grid map given in Fig. 1. Different grey tones indicate different numbers of species per grid square: dark grey≥100; medium grey=50–99; light grey=25–49; white<25. Total species numbers are given, including extra-tropical areas and, in parentheses, additional tropical grids with oceanic islands not taken into account. In colour online.
Linear regression between observed species richness and total prediction score per grid revealed a strong and highly significant relationship (Fig. 3). Setting the sampling score per grid to maximum (5), the predicted species numbers per grid ranged between 28–30 (grids 16 and 17 in sub-Saharan Africa) and 224–234 (grids 9 and 10, corresponding chiefly to the western and eastern Amazon) (Fig. 5). The highest per-grid species numbers, with values of 150 taxa or above, were predicted for grids in Central America (grid 5), those around the Amazon region (grids 6, 7, 9, 10), and grid 13 representing central and southern Brazil and parts of northern Argentina, corresponding to the Cerrado, Pantanal, and Chaco biomes. Further, high values of above 100 species per grid were predicted for grids 2 (Mexico), 8 (Ecuador, Peru), 11 (north-eastern Brazil), 12 (Bolivia), 14 (south-eastern Brazil), and 22 and 26 (central western Africa). All other palaeotropical grids had predictions of < 100 species each, with the highest numbers for other West African grids, India, Thailand and adjacent areas, Papua New Guinea, and north-eastern Australia.
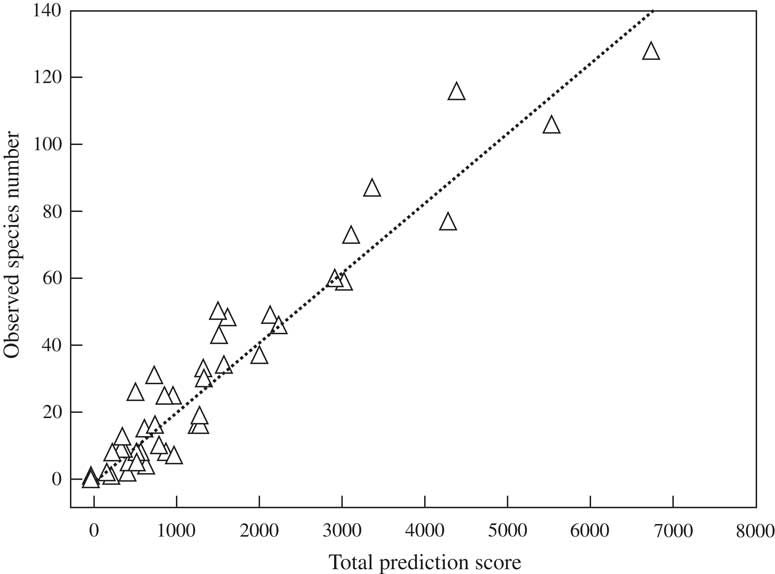
Fig. 3 Linear regression of observed species number per grid on total prediction score derived from sampling, vegetation, remote, and region scores (see Table 1). Observed richness=0·0208×total prediction score (r 2 = 0·92, P < 0·001).
The observed grid total was 1368 and the predicted grid total 3545. Observed average grid distribution per species was 3·26 grids. The maximum number of grids occupied by a single species was 30, observed in one species (Astrothelium porosum), followed by 28 (Pseudopyrenula subnudata, Trypethelium eluteriae), 27 (Astrothelium bicolor, Nigrovothelium tropicum) and 25 grids (Astrothelium megaspermum). In contrast, 202 species, nearly half of the known species, were reported from a single grid only (see Supplementary Material A, available online). Histogram maximization by means of regression between the adjusted, log-transformed, observed frequency values revealed a highly significant relationship (Fig. 4). Through back-transformation, we computed the extrapolated grid total at 3452 and the species total at 800, resulting in an estimated average grid distribution of 4·43 grids per species, c. 36% higher than the observed value and corresponding to an area of c. 11 million km2, larger than the size of countries such as Canada, China, the United States, or Brazil. Using the predicted grid total and the estimated average grid distribution per species, the global predicted species richness for Trypetheliaceae was 3545/4·43=800 species. Histogram maximization resulted in an extrapolation of exactly the same number of 800 species, a remarkable coincidence considering that the two methods are partially independent. This prediction almost doubles the number of 421 species currently accepted.
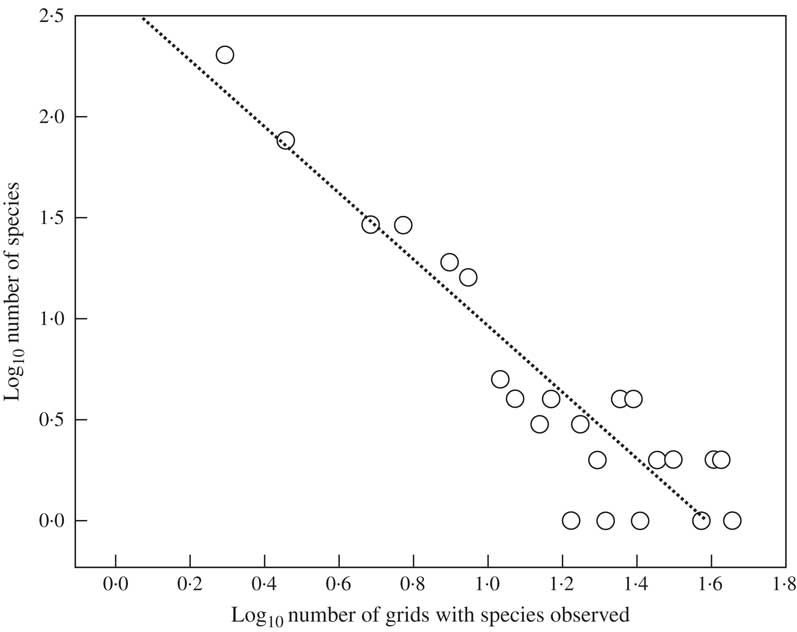
Fig. 4 Linear regression of log-transformed observed species number on log-transformed number of grids in which species were observed. Log10 (number of species)=2·5843–1·6206×log10 (number of grids) (r 2 = 0·85, P <0·001).
Based on these results, we highlighted regions in which the predicted diversity is likely to be discovered (Table 1, Fig. 5). These are concentrated in the Amazon region and southern Brazil, plus at a lower level the entire Neotropics, most of tropical Africa including Madagascar, north-eastern India and adjacent regions, and north-eastern Australia.
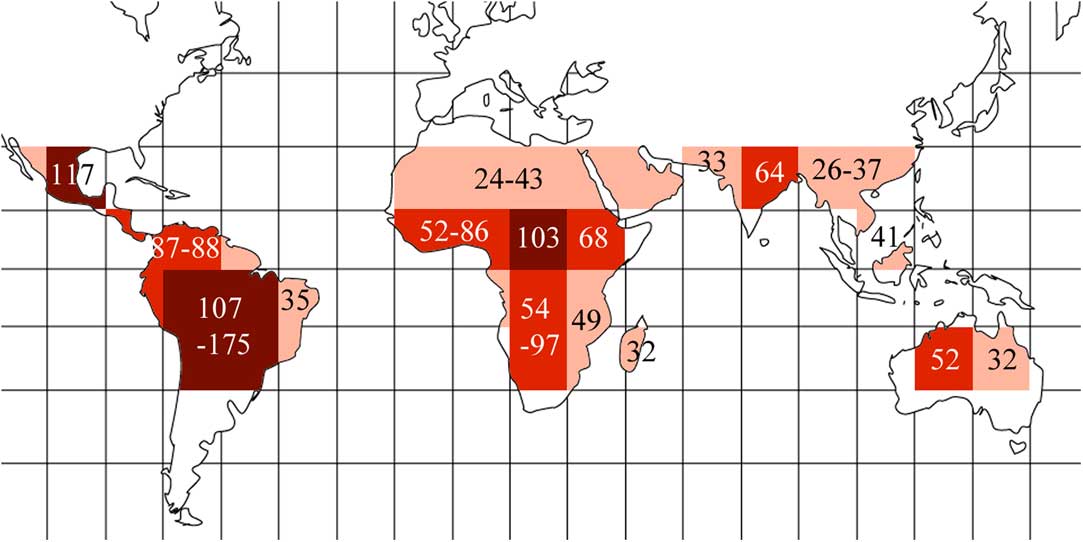
Fig. 5 Global undiscovered species richness heat map for Trypetheliaceae based on data presented in Table 1, using the grid map given in Fig. 1. Different grey tones indicate different numbers of additional species predicted per grid square: dark grey≥100; medium grey=50–99; light grey=25–49. Predicted numbers are given for most grids or groups of adjacent grids. In colour online.
Discussion
Compared to the currently accepted number of 421 species in Trypetheliaceae, our results, based on two partially independent methods, predict that the true number (800) is about twice as high. This prediction appears reasonable, considering that many tropical areas potentially rich in Trypetheliaceae have either not been well studied or not studied at all. The results are proportionally similar to those obtained for Graphidaceae (Lücking et al. 2014 Reference Lücking, Johnston, Aptroot, Kraichak, Lendemer, Boonpragob, Cáceres, Ertz, Ferraro and Jiaa ), in which the number of tropical species was also estimated to be about twice as high (nearly 4000) as the number currently accepted (c. 2100). Since Graphidaceae is considerably larger, however, the impact on the absolute number of expected taxonomic novelties is smaller in Trypetheliaceae. Similarly, maximum predicted grid values are much lower for Trypetheliaceae (little over 200 species) than for Graphidaceae (close to 600 species per grid; Lücking et al. 2014 Reference Lücking, Johnston, Aptroot, Kraichak, Lendemer, Boonpragob, Cáceres, Ertz, Ferraro and Jiaa ).
As in the prediction for Graphidaceae, the individual grid estimates are not to be considered accurate in this case, since the linear correlation applies a smoothing effect on the model (Lücking et al. 2014 Reference Lücking, Johnston, Aptroot, Kraichak, Lendemer, Boonpragob, Cáceres, Ertz, Ferraro and Jiaa ). However, since some grids will be overestimated, others will result in underestimations and consequently the global prediction will be unaffected as these errors cancel each other out. Nevertheless, separate consideration is required when looking at individual grids. Apart from the macroecological parameters employed in our model, other parameters can explain grid species richness, especially the evolutionary history of the area in question. This is especially the case for the Indian subcontinent, which acted as a ‘biotic ferry’ (McKenna Reference McKenna1973; Scotese Reference Scotese2001; Conti et al. Reference Conti, Eriksson, Schönenberger, Sytsma and Baum2002; Hedges Reference Hedges2003) for this region, as species richness appears to be underestimated when using environmental parameters alone, as is the case for Graphidaceae (Lücking et al. 2014 Reference Lücking, Johnston, Aptroot, Kraichak, Lendemer, Boonpragob, Cáceres, Ertz, Ferraro and Jiaa ). However, this also implies that our approach is conservative and that global species richness might be even higher than predicted here.
We observed two marked differences when applying this predictive approach to the families Graphidaceae and Trypetheliaceae. First, Trypetheliaceae have a higher proportional diversity of unique taxa than Graphidaceae in biomes outside the rainforest division. For example, species of Polymeridium are rare in rainforest areas but very diverse in seasonal dry forest such as the Caatinga (Aptroot et al. 2013 Reference Aptroot, Menezes, de Lima, Xavier-Leite and Cáceresa ). Other Trypetheliaceae are rich in savannah vegetation, where they often form unique communities (Komposch & Hafellner Reference Komposch and Hafellner2003). The understudied Brazilian Restinga biome also seems to be a potential source of unique species in this family. Trypetheliaceae also show a marked bias in area-based diversity towards the Neotropics, a pattern not observed in Graphidaceae, which are equally diverse in well-preserved rainforest biomes across the tropics, specifically in the Neotropics and tropical Asia (Lücking et al. 2014 Reference Lücking, Johnston, Aptroot, Kraichak, Lendemer, Boonpragob, Cáceres, Ertz, Ferraro and Jiaa ). The reason for this bias is unknown, but it could be related to the unique diversity of the family in biomes outside rainforests, since palaeoclimatic fluctuations have led to frequent changes in the mosaic-like distribution of rainforest and savannah-like vegetation, especially in South America (Van der Hammen Reference Van der Hammen1974; Meave & Kellmann Reference Meave and Kellman1994; Pennington et al. Reference Pennington, Prado and Pendry2000; Bonaccorso et al. Reference Bonaccorso, Koch and Peterson2006; Flenley Reference Flenley2013). Further study is required to validate our assumption of species richness being generally twice as high in the Neotropics compared to the Palaeotropics, as it is based on limited results from four presumably well-sampled grids. However, further data should not affect the prediction of global species richness but might give more reliable results for individual grids.
The predicted diversity hotspot analysis suggests that most of the undiscovered species richness is to be expected in the Neotropics, particularly the Amazon region and central and southern Brazil. Recent studies in western Amazonia (Rondônia) and Bolivia have indeed revealed an extraordinary diversity of species (Aptroot & Cáceres Reference Aptroot and Cáceres2016; Flakus et al. Reference Flakus, Kukwa and Aptroot2016; Lücking et al. 2016 Reference Lücking, Nelsen, Aptroot, Benatti, Binh, Gueidan, Gutiérrez, Jungbluth, Lumbsch and Marcellia ). Part of this also stems from a much more refined species concept, which suggests that morphological features of thalli and ascomata are usually species-specific and not just the result of assumed infraspecific variation (Nelsen et al. Reference Nelsen, Lücking, Aptroot, Andrew, Cáceres, Rivas Plata, Gueidan, da Silva Canêz, Knight and Ludwig2014; Lücking et al. 2016 Reference Lücking, Nelsen, Aptroot, Barillas de Klee, Bawingan, Benatti, Binh, Bungartz, Cáceres and Canêzb ). Since the lichen biodiversity of the lowland rainforests of tropical Africa has been poorly studied, there may be many species still to be discovered. In contrast, Indonesia is not expected to harbour larger numbers of unknown species as many of them have already been described from this area in historical treatments and have now been resurrected as part of a global revision of the family (Aptroot & Lücking Reference Aptroot and Lücking2016). Very few historical studies for the family exist from the Neotropics and particularly the Amazon region, which makes discoveries of new species more likely.
This study was partially funded by NSF-DEB 0715660, “Neotropical Epiphytic Microlichens—An Innovative Inventory of a Highly Diverse yet Little Known Group of Symbiotic Organisms” to The Field Museum (PI Robert Lücking). The CNPq (Conselho Nacional de Desenvolvimento Científico e Tecnológico) is thanked for a research grant and field trip funding (Processos 311706/2012-6 and CNPq-Sisbiota Processo 563342/2010-2) to MESC.
Supplementary Material
For supplementary material accompanying this paper visit http://dx.doi.org/10.1017/S0024282916000463

