Introduction
Ever since the results of Reference Neave and SavageNeave and Savage (1970), it has been known that the opening of crevasses in glaciers is accompanied by seismic signals known as icequakes. Neave and Savage recorded several thousand events on Athabasca Glacier, Canada, but found no evidence for icequakes originating from depths greater than a few tens of meters below the glacier surface. These results have been regarded as confirming the notion that brittle deformation of glacier ice occurs only at shallow depths.
Other observations were interpreted as evidence that some seismic signals could also originate at greater depths or at the glacier base. Reference Weaver and MaloneWeaver and Malone (1979) observed seismic events on three Cascade volcanoes, that were caused by glacier-related processes rather than by volcanic activity Compared to the icequakes on Athabasca Glacier, the signals recorded on the Cascade volcano glaciers had a much lower frequency content as well as longer durations, and were more energetic by several orders of magnitude. Based on the observed signal character, Reference Weaver and MaloneWeaver and Malone (1979) concluded that their events, rather than being due to crevassing, were associated with stick-slip sliding at the glacier bed. However, their location accuracy was not sufficient to confirm this interpretation conclusively. A study undertaken in 1976 on Unteraargletscher, in the Bernese Alps of central Switzerland, as well as measurements in 1979 on Gornergletscher, near Zermatt, Switzerland, suggested that a small percentage of the icequakes could have originated at intermediate levels or even at the base of the glacier (Reference Deichmann, Ansorge and RothlisbergerDeichmann and others, 1979; Reference AschwandenAschwanden, 1992). But in both of these cases, the location accuracy was again not judged sufficient for the results to be really conclusive. Reference Von der Osten-WoldenburgVon der Osten-Woldenburg (1987) obtained focal depths of 25–130 m from monitoring glacier seismicity on the Schlaten-kees, Austria. However, from his histogram alone and without any information regarding the uncertainties of his locations, it is impossible to assess the reliability of his results.
More recently, observations in Antarctica revealed the existence of seismic events associated with stick-slip deformation inside the basal-till layer below Ice Streams B and C (Reference Blankenship, Anandakrishnan, Kempf and BentleyBlankenship and others, 1987; Reference Anandakrishnan and BentleyAnandakrishnan and Bentley, 1993). Considering other direct observations of stick-slip sliding at the base of glaciers (e.g. beneath Glacier d’Argentière, France (Reference Goodman, King, Millar and RobinGoodman and others, 1979), and Trapridge Glacier, Canada (Reference Fischer and ClarkeFischer and Clarke, 1997)), it seems reasonable to expect seismic signals also from deformational processes occurring at or near the base of temperate mountain glaciers.
In April 1997 we had the opportunity of operating an array of seven portable seismographs on Unteraargletscher, with the aim of searching for possible deeper icequakes. This paper gives an overview of the data acquired during the 1997 experiment and presents first results of the data analysis. These results include new observations regarding the signal character of icequakes, measurements of seismic velocities and conclusive evidence that icequakes in temperate mountain glaciers are not only associated with the opening of near-surface crevasses but also occur near or at the base of the glacier and possibly also at intermediate depths.
Data Acquisition
The instrumentation consisted of seven portable digital MARS88 recorders. They were operated at a sampling rate of 500 Hz, and the signals were stored on floppy disks. Because of the limited capacity of the floppy disks, the instruments were run in trigger mode instead of recording continuously. This limitation compared to the large capacity of magneto-optical disks was offset by the possibility of immediately playing back the data onto a notebook computer and thus being able to check the results in the field. Power was provided by two sets of car batteries, which were recharged either by a generator or by two solar panels.
The seven instruments were deployed over a rectangular area of 250 × 400 m2 extending from the northern margin to the middle of Unteraargletscher, halfway between the snout of the glacier and the confluence of Finsteraar- and Lauteraagletscher. In this area the glacier is about 1km wide and reaches a maximum thickness of about 300 m (Reference Funk, Gudmundsson and HermannFunk and others, 1995). Initially, six of the recorders were equipped with 1 Hz three-component LED-1 seismometers (stations U1–U6, Fig. 1), while the seventh recorder was operated with two one-component sensors at stations U7 and U8 and an additional sensor at 120 m depth in a borehole drilled near station U8. Unfortunately the borehole seismometer (a 4.5 Hz geophone) did not function properly. Once it became certain that this seismometer was definitely out of order, the recording instrument was moved from U8 to U7 (Fig. 1) and the vertical seismometers were replaced by a single three-component sensor at U7. All sensors were set up in direct contact with the glacier ice, even in locations where the snow cover was still several meters deep.

Fig. 1. Map view of Unteraargletscher with (a) study area and (b) locations of seismograph stations, shot points and drilling operations. The borehole shots were below the shot point closest to station U 8. Axes are labeled in km of the Swiss national coordinate grid, with north at the top.
The internal clocks of the recorders were synchronized with a radio-transmitted time signal. In order to attain the required timing accuracy, however, the onset times picked from the seismograms had to be corrected for the delays between the individual time-signal receivers as well as for possible lags between the time signal and the internal clock of the instrument.
Signal Characteristics
As discussed in more detail in the next section, for test purposes, we set off several small explosive charges both at the glacier surface and at 49 m depth in a borehole. In Figure 2 we show the vertical-component seismograms of a surface and borehole shot recorded at three different stations. Whereas the signals of the surface shot are dominated by a strong secondary arrival, the only clearly identifiable arrival in the signals of the borehole shot is the direct P-wave.
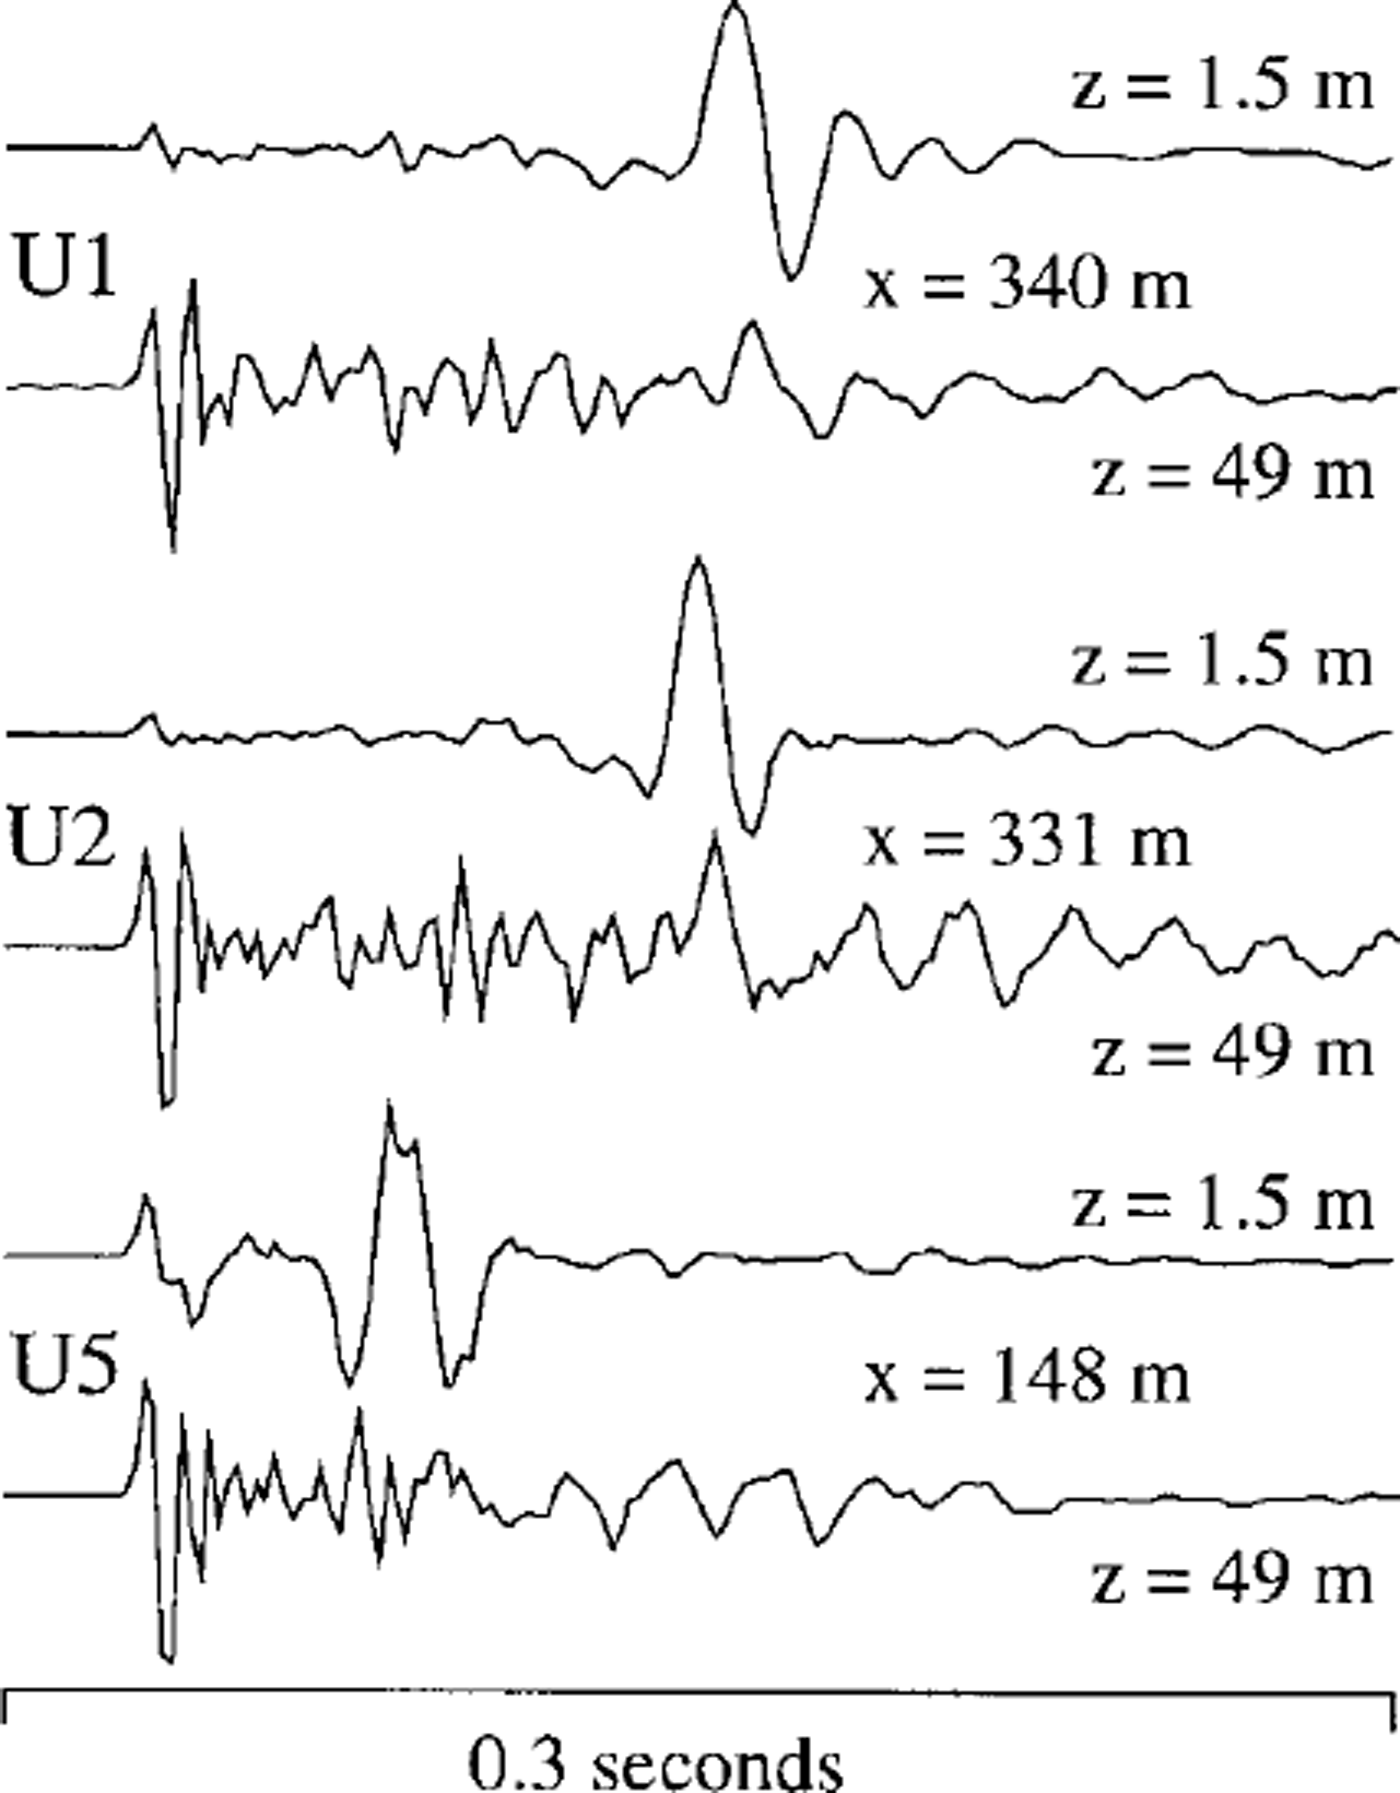
Fig. 2. Vertical-component seismograms of two explosions at 1.5 and 49 m depth recorded at stations VI, U2 and U5 (× is distance, z is source depth). The signals have been corrected for the acausal anti-aliasing filter of the recording system, but are otherwise all unfiltered.
The reason for the striking difference in the appearance of these signals can be understood from an analysis of the complete ground motion reconstructed from three-component records. As an example, in Figures 3 and 4 we plotted the particle motions for a shallow icequake and for an icequake located near or at the base of the glacier. Locations of these two events were determined as described in the next two sections and are among the best-constrained of the whole dataset. In Figure 3a, the S-wave is the small arrival which strikes out perpendicularly to the propagation direction (top panel), whereas the large-amplitude phase following the S-arrival exhibits retrograde elliptical motion in a vertical plane that identifies it as a Rayleigh wave (Fig. 3b). In the case of the deep event in Figure 4, on the other hand, we see that the large-amplitude arrival is polarized horizontally as expected for an SH-wave and that the Rayleigh wave is entirely absent.
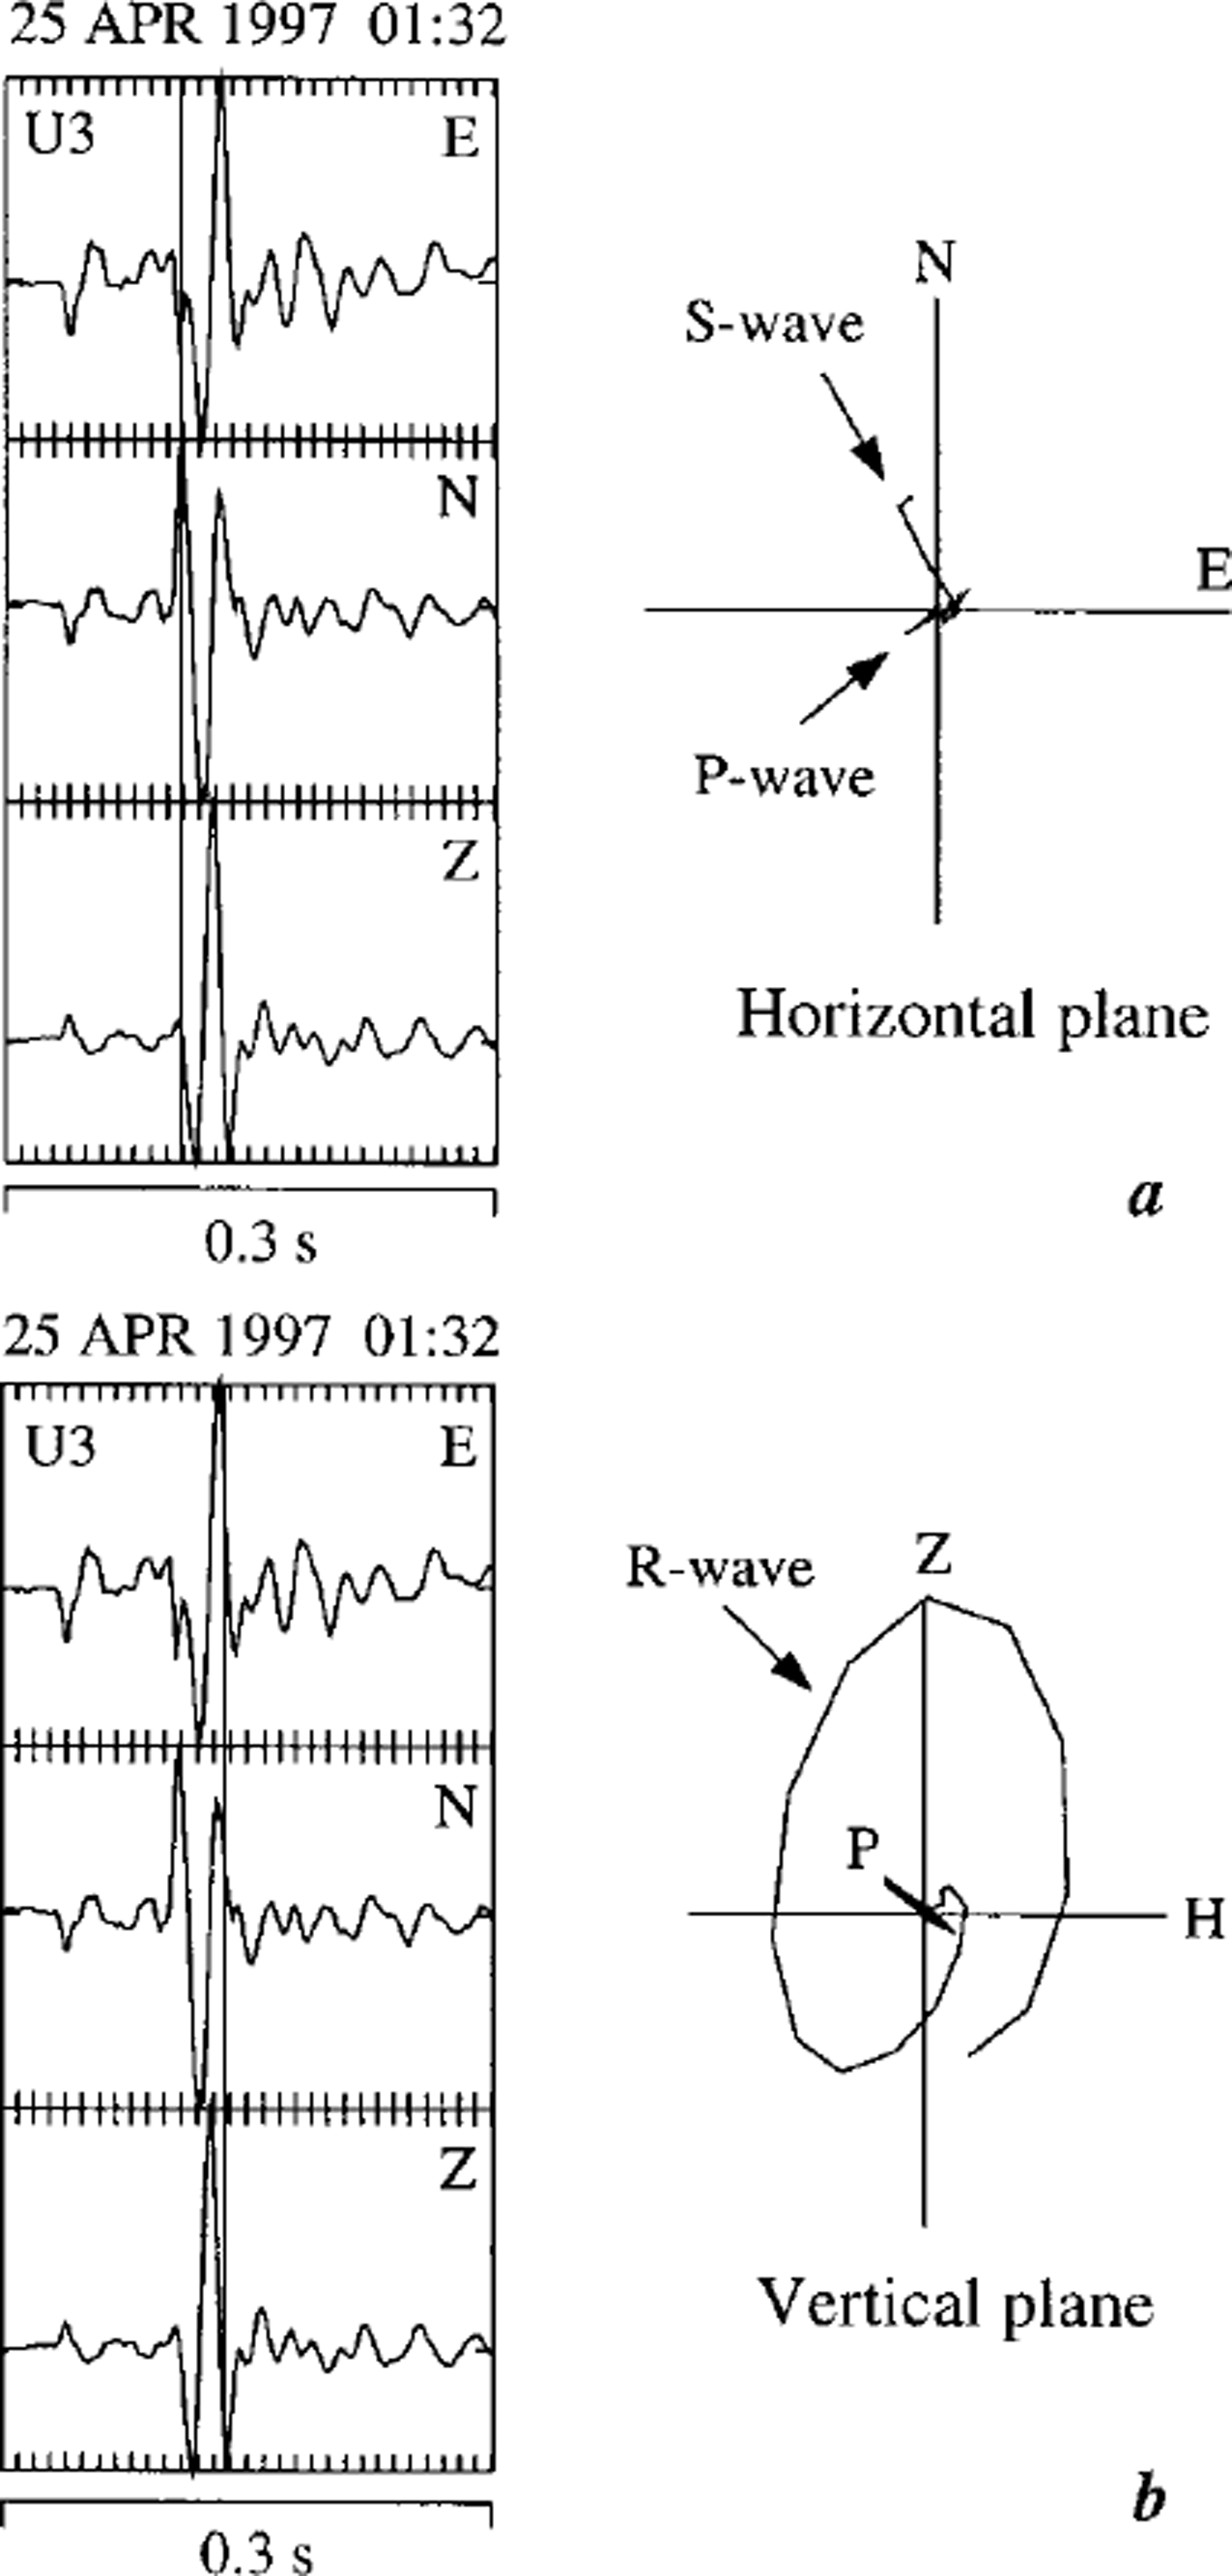
Fig. 3. Three-component seismograms and particle-motion diagrams of a shallow event, (a) Projection onto a horizontal plane. The epicenter is located to the northeast of the station ( U3). The particle motion stops immediately after the shear-wave arrival, S, shown by the position of the vertical cursor line crossing the three seismograms. (b) Projection onto a vertical plane containing the ray, viewed from the southeast. The particle motion continues past the arrival of the Rayleigh wave,R.

Fig. 4. Three-component seismograms and particle-motion diagrams of a shallow event (a) and a deep event (b). In both cases, particle motions are projected onto a vertical plane perpendicular to the direction of the incoming ray. The vertical cursor line crossing the seismograms marks the end-points of the particle motions. The particle-motion snake of the shallow event is the same as that in Figure 3b, but viewed from the southwest instead of the southeast. The polarization shows that, in the case of the deep event, the strong secondary phase is the shear wave, S, and not the Rayleigh wave, R, as in the signal of the shallow event.
The difference in signal character is due simply to the fact that the Rayleigh wave, being a wave that propagates along the surface, is not excited by a source located at depths exceeding about one wavelength. Thus, the comparison between the seismograms of the surface and borehole shots, as well as the analysis of the three-dimensional particle motions of the icequakes, shows that the striking differences in signal character can be used as a qualitative discriminant between shallow and deep events.
Seismic Velocities
To determine the P-wave velocity and check the location accuracy of the array, ten small explosive charges were set off at seven different locations on the surface of the glacier, and three at 49 m depth in an additional borehole near station U8 (Fig. 1). The onsets were picked with the help of an interactive computer program for seismological data analysis. An uncertainty of 3, 5 or 10 ms was assigned to each arrival according to whether its quality was judged to be impulsive, emergent or questionable. These values include both the error in phase picking and possible synchronization errors of the clocks of the individual instruments. To avoid timing errors due to acausal signal precursors generated by the digital anti-aliasing filters in the MARS88 recorders, all the shot seismograms were corrected by converting the zero-phase filter response to the corresponding minimum delay response (Reference ScherbaumScherbaum, 1996).
Applying a standard linear least-squares procedure simultaneously to all available shot-station combinations, we solved for a common P-wave velocity and an origin time for each shot (Fig. 5). Each onset time was weighted by the inverse of the estimated uncertainty. This procedure gave Vp = 3.77 ± 0.05 km s–1 with an rms travel-time residual of 2 ms. Implicit in this approach is the assumption that Vp does not vary with depth. This was tested by evaluating the surface and borehole shots separately. The variations that we found were less than the uncertainty of the results, so, at least for the upper 50 m of the glacier, the constant-velocity assumption does not contradict the available data.
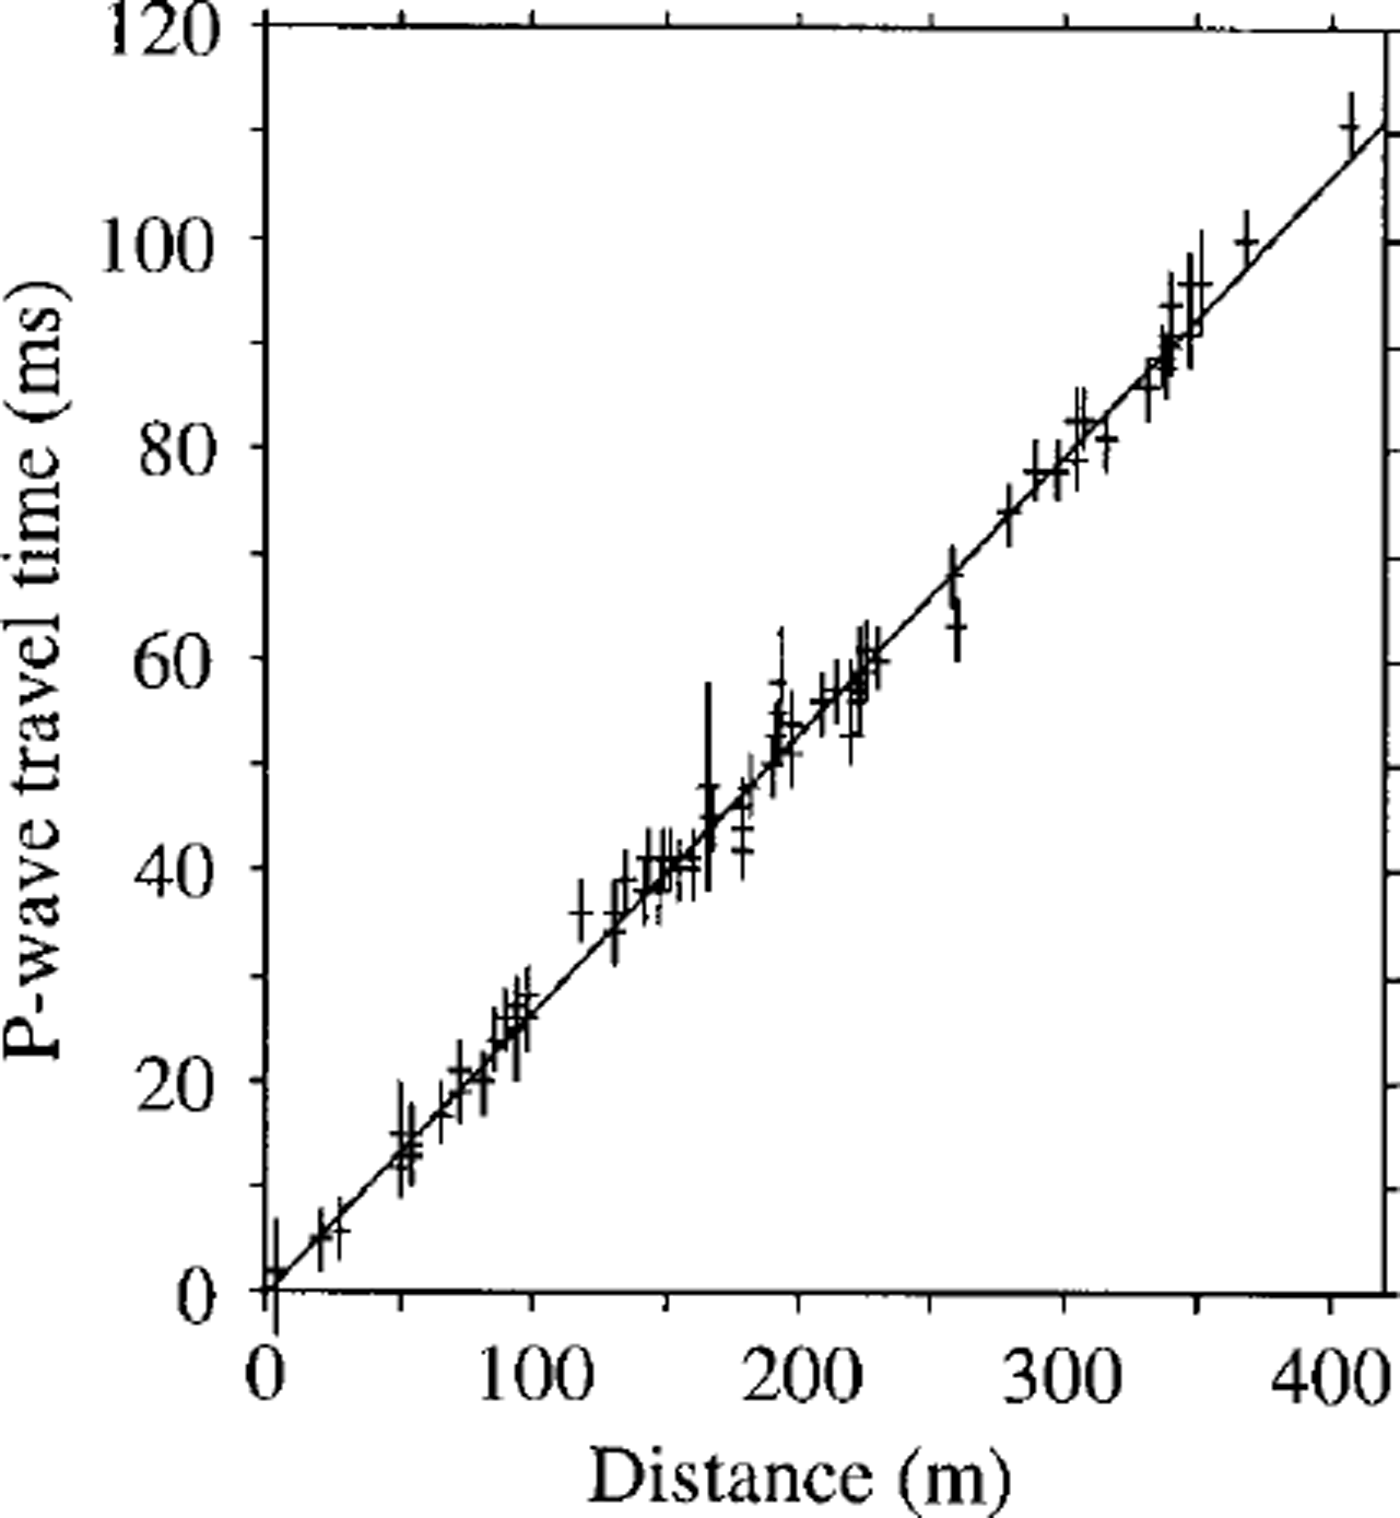
Fig. 5. P-wave travel time vs distance for all available shot-station combinations, after subtraction of the origin time of each shot resulting from the simultaneous regression.
Since explosions are a poor source for shear waves, we calculated Vs from the Vρ/Vs ratio determined from the icequakes themselves. Using the standard Wadati relation Ts–Tp = (Vρ/Vs–l)(Tρ–T0), where Tp and Ts are the P- and S-onset times and T0 is the origin time, we applied σ
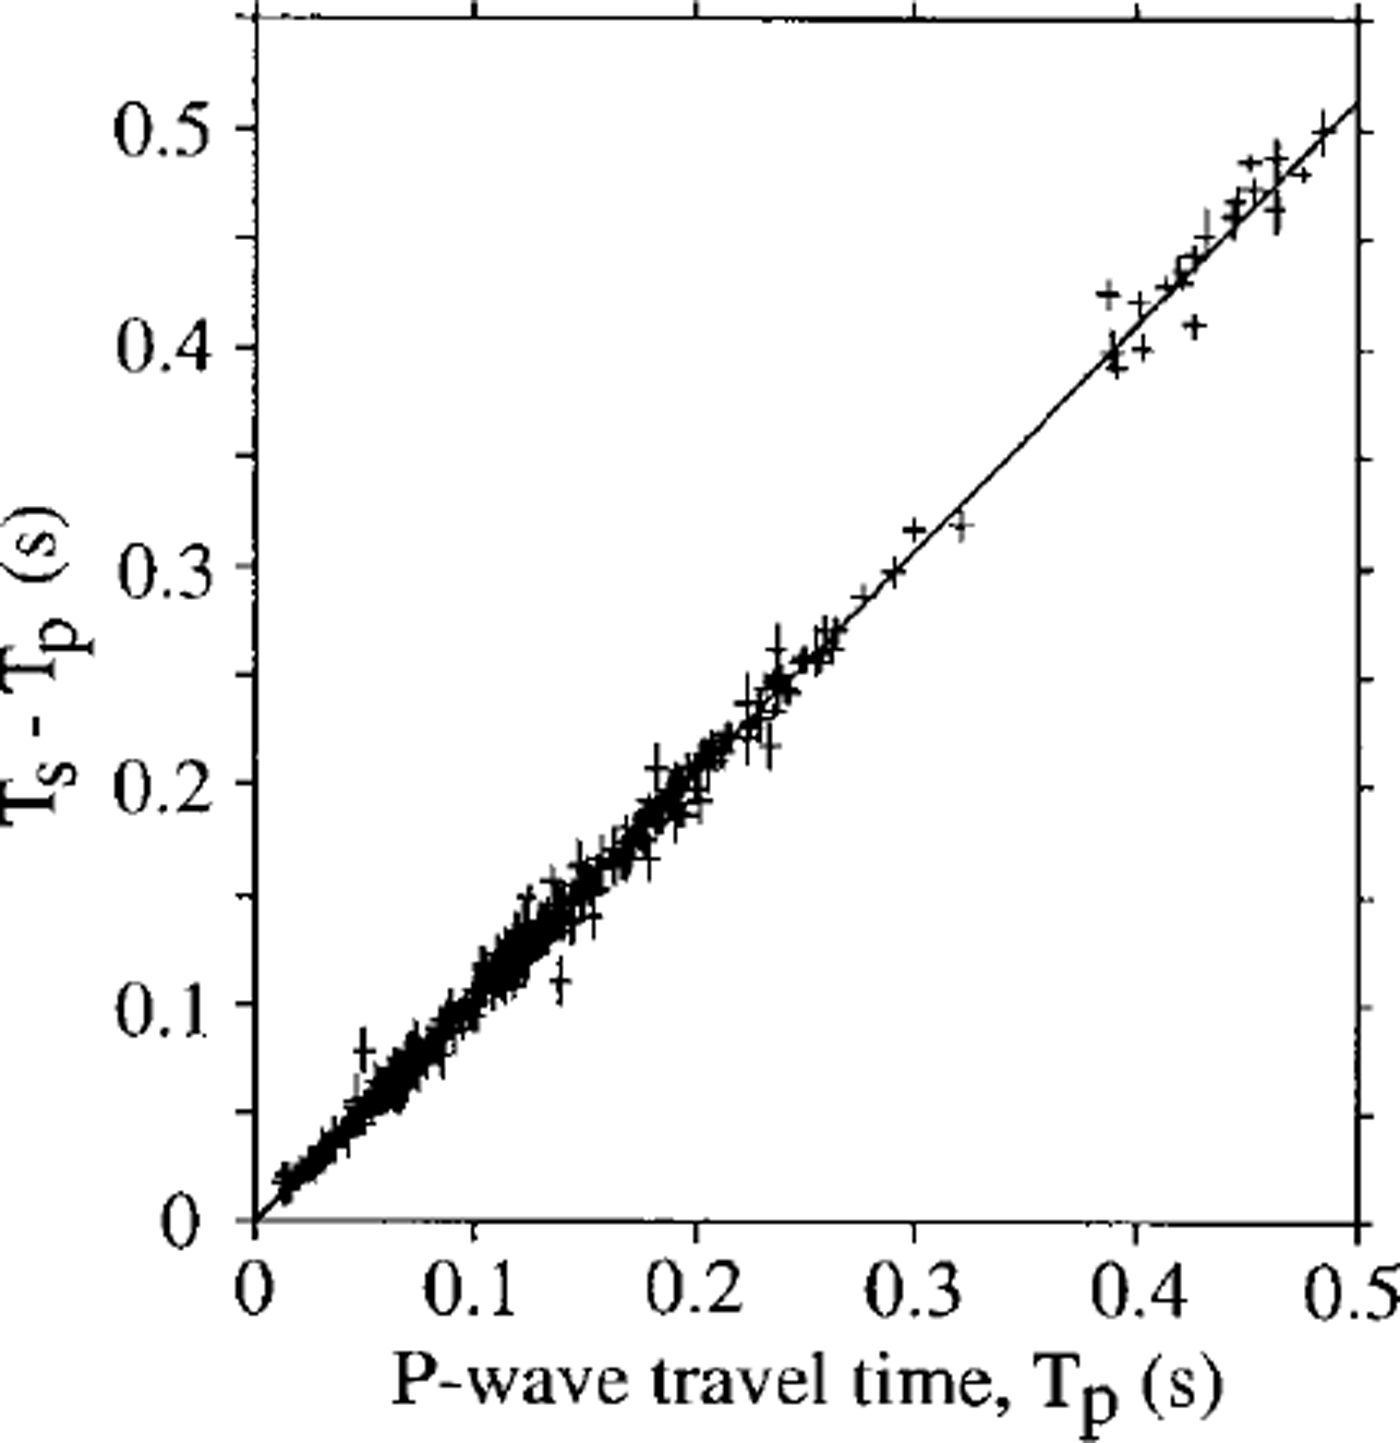
Fig. 6. Difference between P- and S-onset times vs P-wave travel time for 169 icequakes, after subtraction of the origin time of each event resulting from the simultaneous regression.
Both the P- and the S-velocities determined in this study are well within the range of seismic velocities for temperate glaciers quoted in the literature.
Event Locations
P- and S-onset times of the icequake seismograms were picked and weighted in the same way as described above for the shots. The acausality of the anti-aliasing filter was corrected whenever the arrivals were sufficiently impulsive to suggest the occurrence of precursory oscillations. Calculation of the hypocentral locations was performed with a standard linearized iterative least-squares inversion algorithm with singular value decomposition. We assumed a constant-velocity model with the seismic velocities as determined above. Given a nearly coplanar station distribution, focal depths of shallow events are subject to large uncertainties. In several cases, the result may even converge to a minimum corresponding to a location above the glacier surface or fail to converge altogether. In these cases, one can solve for the epicentral coordinates and origin time alone, while keeping the focal depth fixed. By repeating this for different depths, one can then search for that depth value which corresponds to the smallest rms of the travel-time residuals.
The epicenter map in Figure 7 shows the locations of 335 events for which the iteration converged to a stable solution. It includes all of the events recorded by at least six stations, a large fraction of those recorded by five stations and a few of those recorded by only four stations. The large concentration of epicenters at the northern margin of the glacier represents those events related to the opening of the prominent lateral crevasses. At least during our monitoring period, the activity in the central parts of the glacier was relatively small. It is, however, interesting to note that some of the mid-glacier events seem to occur in clusters.
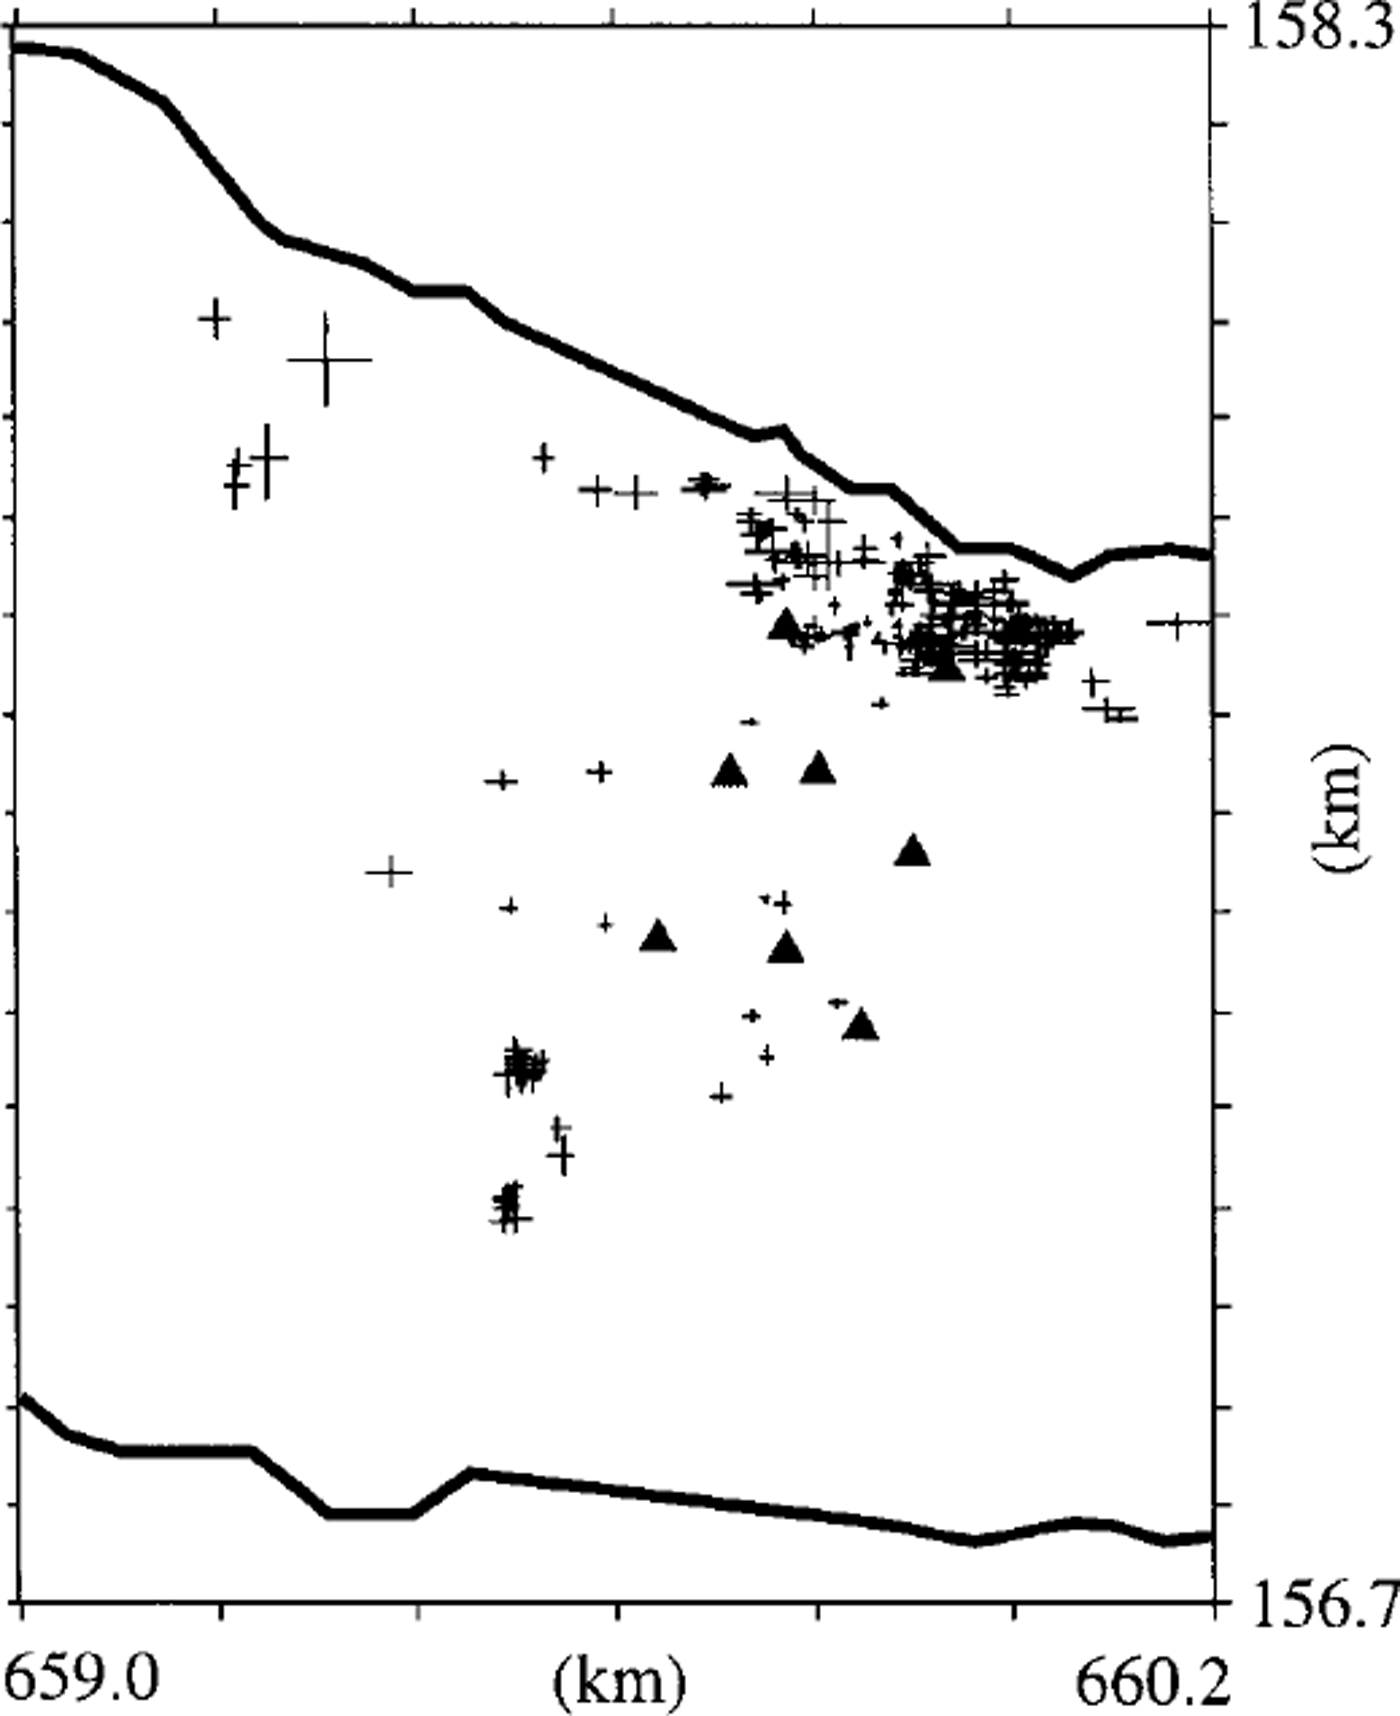
Fig. 7. Epicenters of the located icequakes. The size of the error bars is equal to la. Units of the axes are km of the Swiss national coordinate grid, with north at the top. non-linear regression algorithm simultaneously to 169 well-recorded icequakes, solving for a common velocity ratio and a separate origin time for each event (Fig. 6). The outcome of this procedure gave Vρ/Vs = 2.03 ± 0.02, corresponding to a Poisson ratio of 0.34. The rms residual between the observed and calculated values of Ts–Tp in this regression procedure amounts to 4 ms. Being a function of the errors of both Ts and Tρ, this value is higher than that resulting from the Vp regression. Nevertheless, it shows that our S-arrival times are consistent and that their accuracy is within the assumed uncertainty. With the value of Vp derived above, Vs=l.86±0.04–kms–1 .
In Figure 8 we have projected the hypocenters onto a cross-section perpendicular to the glacier along a line through stations Ul, U3 and U5 (see Fig. l). This figure includes all the events of Figure 7 except for a few poorly located events. We specifically omitted the westernmost of the three clusters in Figure 7; judging from the signal character, the depth of this cluster is shallow and it is located far from the station array, so the calculated depth errors are larger than the glacier thickness. For the same reasons, error bars of many of the events at the northern margin of the glacier are also very large. But again the signal character of these events indicates that they must be shallow and therefore that they are most likely related to the opening of the lateral crevasses.
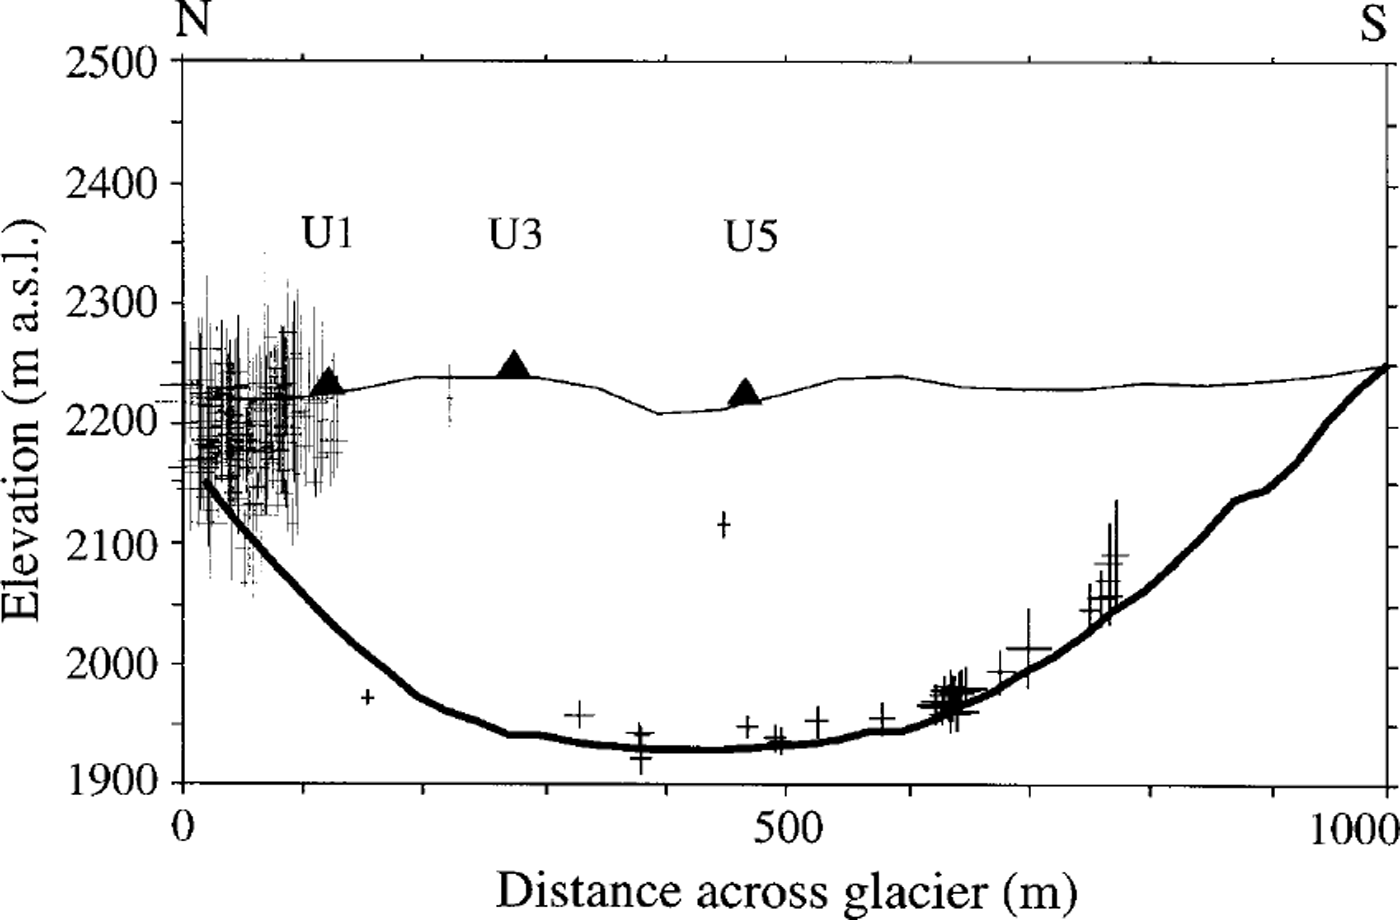
Fig. 8. Hypocenters of the well-located events projected onto a cross-section across the glacier through stations VI, U3 and U5, looking downstream (see Figs 1 and 7). The topography of the glacier surface (thin line) and of the glacier bed (thick line) corresponds to the maps of Reference Funk, Gudmundsson and HermannFunk and others (1995). The size of the error bars is equal to lσ
Thus our observations confirm the notion that the vast majority of icequakes are shallow. However, 37 hypocenters, including the events in two of the observed clusters, are aligned along the base of the glacier. Although this alignment strongly suggests that these deep events are related to the interaction between the glacier and its bed, the precision of our locations and of the topography of the glacier bed is not sufficient to determine whether they are still located entirely within the ice or at the ice-bedrock interface. This also implies that those events appearing below the glacier in Figure 8 are certainly too deep. The topography of the glacier bed derived from seismic and radar measurements might also be wrong, although it agrees to within 5 m with the depth of the bed observed in numerous boreholes (Reference Funk, Gudmundsson and HermannFunk and others, 1995). Nevertheless, based both on the location results and on the signal character of these events, we can exclude the possibility that they occurred near the glacier surface. The same applies also to the single event that is located about 120 m below the surface, that can be seen in the center of Figure 8. So far this is the only well-located event that we have found at intermediate depths within the glacier.
Signal Amplitudes
Since most of the observed icequakes are associated with the opening of tensional crevasses, their focal mechanism is certainly not equivalent to a double couple. It is thus not physically meaningful to calculate their scalar seismic moment. To obtain at least a qualitative estimate of the size of the icequakes observed on Unteraargletscher, we therefore compared the signals of some shallow and some deep icequakes to the signals of some of the explosions. The shots were set off with 50 g of gelatine explosive, which is about 90% as efficient as dynamite. A preliminary comparison shows that the P-wave amplitudes of the icequakes are 1–3 orders of magnitude smaller than the amplitudes of the explosions recorded at the same distance. Moreover, the typical deep event seems to be stronger than the typical shallow event by about one order of magnitude.
Discussion and Conclusions
The availability of three-component records represents a significant improvement over our own previous experiments on Unteraar- and Gornergletscher as well as over the observations of Reference Neave and SavageNeave and Savage (1970) and of Reference Von der Osten-WoldenburgVon der Osten-Woldenburg (1987), which relied solely on vertical-component sensors. From the three-dimensional particle-motion plots it is now clear that for shallow events the large-amplitude phase that dominates the vertical-component seismograms is not the S- but the Rayleigh wave. Moreover, for these events S-onsets can be picked reliably only on the horizontal components, and even the P-phases have larger amplitudes on the horizontal than on the vertical components. We have also shown that the absence of the Rayleigh wave from signals of deeper events can be used as an independent discriminant between shallow and deep icequakes.
Most importantly, our results demonstrate that icequakes are not restricted to shallow depths but occur also at or near the glacier bed. The single event that we found at an intermediate depth seems to imply that icequakes can occur, at least occasionally, anywhere within a glacier.
There is little doubt that most of the shallow events are associated with the opening of crevasses; most of them are located near the margin of the glacier in an area with abundant crevasses, and the observed signals are identical to those reported by Reference Neave and SavageNeave and Savage (1970). Moreover, the tensile nature of the near-surface sources agrees with the fact that the overwhelming majority of the clear P-wave arrivals is compressive. On the other hand, the mechanism of the deeper events and their relation to processes occurring at the glacier bed are unknown. Some deep events also produce clear dilatational P-wave arrivals, indicating that focal mechanisms of at least some of the events at the base of the glacier are not purely tensile. In the course of further data analysis, we intend to perform a moment tensor inversion on the full waveform of selected events, to clarify the nature of the deep icequakes. In addition, high-precision relative locations based on signal correlation of the events within each of the two deep clusters (Fig. 8) might resolve the orientation of the fault plane relative to the glacier bed.
A systematic statistical analysis of the temporal occurrence and of the relation to other variables such as air temperature, precipitation, flow velocity and intra-glacial water pressure is hampered by the fact that the instruments were operated in trigger mode and did not function without interruptions over the whole period of the experiment. Nevertheless, based both on the location of the deep events and on the fact that they occurred at all times of the day and night, we can exclude any direct link with the drilling operations underway during that time period.
Regardless of the mechanism of the deep icequakes, we conclude from our results that, contrary to generally accepted rheological models of temperate glaciers, brittle deformation is not restricted to the near-surface but occurs also at or near the glacier base and occasionally even at intermediate depths.
Acknowledgements
For the interactive seismogram analysis we used SNAP, a computer program written by M. Baer, Swiss Seismological Service. We are very grateful to our colleagues A. Bauder, U. Fischer, J. Lutiger and B. Nedela for their help with the fieldwork and to A. Bauder for providing the digital topographic data of the glacier surface and bed. We also thank S. Anandakrishnan and G. Rogers for their constructive reviews. This is contribution No. 1089 of the Institute of Geophysics, ETH-Zunch.


