Introduction
Food and feed production must continue to increase globally to meet the nutrition requirements and dietary choices of the human population. Soybean is a protein-rich food source and nutritionally beneficial for both human consumption and use in animal feed; thus, it is important to maintain or enhance soybean yield production. In addition, soybean-derived products are used in manufacturing of numerous industrial applications such as paints, plastics, and cleaning materials. However, herbicide-resistant or hard-to-control weeds increasingly threaten soybean production and conservation systems due to the subsequent increased use of tillage to control escaped weeds (Price et al. Reference Price, Monks, Culpepper, Duzy, Kelton, Marshall, Steckel, Sosnoskie and Nichols2016). Because of this, integrated weed management (IWM) practices are needed. Large crabgrass [Digitaria sanguinalis (L.) Scop.], morningglory (Ipomoea spp.), nutsedges (Cyperus spp.), sicklepod [Senna obtusifolia (L.)], and herbicide-resistant Palmer amaranth [Amaranthus palmeri (S.) Watson] were identified as the predominant troublesome weed species in soybean production areas in mid-south, southeastern, and mid-Atlantic states (Price et al. Reference Price, Wayne Reeves and Patterson2006; Van Wychen Reference Van Wychen2016).
Conservation systems were initially used to prevent soil erosion and rainfall run-off losses to maintain soil quality and moisture availability (Kaspar et al. Reference Kaspar, Radke and Laflen2001). With the development of herbicide-resistant crop cultivars, a combination of conservation tillage (CT) with a diversity of herbicide modes of action was used successfully (Vencill et al. Reference Vencill, Nichols, Webster, Soteres, Mallory-Smith, Burgos, Johnson and McClelland2012). But with time, herbicide-resistant weeds, small-seeded weeds, and perennial weeds have become the major challenge in retention and adoption of CT systems (Bajwa Reference Bajwa2014; Price et al. Reference Price, Balkcom, Culpepper, Kelton, Nichols and Schomberg2011; Shaw et al. Reference Shaw, Culpepper, Owen, Price and Wilson2012). Therefore, integrated strategies must be used to disrupt herbicide-resistant and troublesome weed establishment and growth while maintaining potential crop yield. IWM practices in CT systems include the use of cover crops, timely herbicide applications, crop rotation to disrupt the weed complex reproductive cycle, scouting to assess weed populations, and use of various chemical herbicide modes of action (Norsworthy et al. Reference Norsworthy, Ward, Shaw, Llewellyn, Nichols, Webster, Bradley, Frisvold, Powles, Burgos, Witt and Barrett2012; Price et al. Reference Price, Balkcom, Culpepper, Kelton, Nichols and Schomberg2011, Reference Price, Monks, Culpepper, Duzy, Kelton, Marshall, Steckel, Sosnoskie and Nichols2016). High residue cover crops combined with CT systems have been increasingly adopted by row crop producers to maintain crop yield potential due to weed suppressive and allelopathic qualities of cover crops (Creamer et al. Reference Creamer, Bennett and Stinner1997; Nagabhushana et al. Reference Nagabhushana, Worsham and Yenish2001; Norsworthy et al. Reference Norsworthy, McClelland, Griffith, Bangarwa and Still2011; Price et al. Reference Price, Wayne Reeves and Patterson2006; Teasdale and Mohler Reference Teasdale and Mohler2000; Vann et al. Reference Vann, Reberg-Horton, Castillo, McGee and Mirsky2019).
Cereal rye is the most used winter cover crop in soybean cultivation throughout the southeastern United States due to its capacity for rapid growth, potential high biomass residue, and subsequent weed suppression (Clark Reference Clark2007). Moreover, CT following a cereal rye cover crop (CC) could be more effective in decreasing weed germination and growth than conventional tillage (CVT) or CT winter-fallow (WF) systems (Aulakh et al. Reference Aulakh, Price and Balkcom2011; Korres and Norsworthy Reference Korres and Norsworthy2015; Mirsky et al. Reference Mirsky, Curran, Mortenseny, Ryany and Shumway2011; Price et al. Reference Price, Balkcom, Duzy and Kelton2012; Shilling et al. Reference Shilling, Brecke, Hiebsch and MacDonald1996; Smith et al. Reference Smith, Reberg-Horton, Place, Meijer, Arellano and Mueller2011). Price et al. (Reference Price, Wayne Reeves and Patterson2006) described that CT following the planting of a cereal rye cover crop provided >70% control of weed species including annual grasses, Palmer amaranth, and sicklepod in soybean. In CT systems, termination of a matured cereal cover crop has been accomplished through chemical treatment with glyphosate and sometimes the additional use of a mechanical roller/crimper (Kornecki Reference Kornecki2020). Combined, these practices result in a high residue biomass mat over the ground, through which seeds are planted (Norsworthy et al. Reference Norsworthy, McClelland, Griffith, Bangarwa and Still2011; Price et al. Reference Price, Balkcom and Arriaga2005; Reeves et al. Reference Reeves, Price and Patterson2005; Teasdale and Mohler Reference Teasdale and Mohler2000; Vann et al. Reference Vann, Reberg-Horton, Edmisten and York2018). After planting soybean, due to the cooler soil temperature typically found in CT systems, soybeans emerge and grow slower than they do in conventional systems (Philbrook et al. Reference Philbrook, Oplinger and Freed1991). However, both root and vegetative development are positively influenced by good soil environmental conditions such as reduced soil compaction, improved soil moisture retention after cover crop termination, and reduced weed competition during initial soybean vegetative growth stages (Krausz et al. Reference Krausz, Young, Kapusta and Matthews2001; Unger and Kaspar Reference Unger and Kaspar1994; Vollmann et al. Reference Vollmann, Wagentristl and Hartl2010).
The critical period for weed control (CPWC) is the time window of the crop growing cycle when weed interference must be restricted to prevent ≥5% relative yield losses, 5% being the academically acceptable standard (Knezevic et al. Reference Knezevic, Evans, Blankenship, Van Acker and Lindquist2002). The CPWC includes two different components of weed-crop competition: 1) the critical timing for weed removal (CTWR): the extent of time up to which a crop can compete and tolerate early-emerging weeds before causing yield loss; and 2) the critical weed-free period (CWFP): the minimum time that a crop requires weed-free conditions from planting forward to maintain yield (Knezevic et al. Reference Knezevic, Evans, Blankenship, Van Acker and Lindquist2002; Korres and Norsworthy Reference Korres and Norsworthy2015; Williams et al. Reference Williams, Ransom and Thompson2007). The CTWR defines the starting time from when a weed should be controlled, whereas the CWFP defines the end time of weed control. Moreover, the difference between CWFP and CTWR defines the CPWC. Weed interference before and after the CPWC does not result in substantial yield loss (Knezevic et al. Reference Knezevic, Evans, Blankenship, Van Acker and Lindquist2002). The use of cover crops to attain high biomass residue might decrease or delay weed emergence and thus decrease the CPWC (Korres and Norsworthy Reference Korres and Norsworthy2015). Little research determining the influences of a high residue winter cover crop on soybean production and CPWC has been published. The objective of this field study was to estimate the influence of CT following high-biomass cereal rye cover crop (CT + CC) on CPWC in soybean and its comparison to CT following winter-fallow (CT + WF) or conventional tillage (CVT).
Materials and Methods
A 3-yr field experiment was conducted from 2018 to 2020 at E.V. Smith Auburn University Research and Extension Center (Field Crops Unit; 32.4417°N, 85.8974°W) near Shorter, Alabama. The soil characteristics at the research site were sandy loam (coarse-loamy, siliceous, subactive, thermic Paleudults), pH 6.2, and 0.8% organic matter.
Cover Crop Management
The cereal rye cover crop was managed to maximize biomass production. Cereal rye (‘Elbon’) was planted with a no-till 3.7-m End Wheel Drill (Great Plains, Salina, KS) at a seeding rate of 101 kg ha−1 with a no-till grain drill in the CT + CC plots on November 16, 2017, October 31, 2018, and October 28, 2019, respectively. To enhance biomass production, 34 kg N ha−1 (as NH4NO3) was applied to cereal rye plots in February each spring. After sampling of cover crop, all plots were mechanically rolled by using a three-section straight bar roller-crimper (I & J Mfg., Gordonville, PA) to flatten the biomass residue on the soil surface of CT plots on April 18, 2018, May 20, 2019, and June 6, 2020, respectively (Kornecki Reference Kornecki2020). Immediately after rolling, termination of cover crop in CT + CC and weeds in CT + WF plots was attained with an application of glyphosate (Roundup Powermax®; Monsanto Company, St. Louis, MO) applied at 1.12 kg ae ha−1. The experimental site had the soil hardpan that restricts the penetration of crop root into soil; hence, all plots were in-row subsoiled with a narrow-shank parabolic subsoiler equipped with pneumatic tires (Kelly Manufacturing Co., Tifton, GA) before soybean planting. The narrow-shank parabolic subsoiler equipment minimally disturbed the residue and soil in a 5-cm-wide planting zone. Two passes with a field cultivator following disking were accomplished for CVT plots. Soybean ‘P55A49X’, ‘P52A43L’, and ‘P48A99L’ was planted on May 1, 2018, May 29, 2019, and May 21, 2020, respectively, using a precision planter Green Star GPS (John Deere, Moline, IL) with population set at 286,915 seeds per ha−1.
Experimental Design
The split-plot design was used within a randomized complete block design with four replications of treatment. Within the split-plot design, main plots were considered agronomic practice systems: (a) (CVT), (CT + WF), and (CT + CC), whereas subplots (b) were various durations of naturally occurring weed interference and weed-free periods. Weedy and weed-free periods comprised of weekly durations from 0 wk after planting (WAP) to 8 WAP of soybean. The weed interference and weed-free durations were initiated at 0 WAP. Weed control was needed after each weed interference duration and maintaining weed-free periods using labeled herbicides based on herbicide-resistant soybean technology. In 2018, glyphosate (Roundup Powermax®) at 1.12 kg ae ha−1 tank-mixed with dicamba (Engenia; BASF Crop Protection, Durham, NC) at 560 g ae ha−1 was used for weed control. In 2019 and 2020, the weed control program consisted of glufosinate (Liberty 280SL; Bayer, St. Louis, MO) applied at 882 g ai ha−1. In all years, applications of clethodim (Select 2EC; Sumitomo Chemical Co., Tokyo, Japan) at 0.28 g ai/ha plus 1% crop oil concentrate applied over the top were used to manage grass species as needed following interference duration or weed-free period timings. All herbicides were applied using a CO2-pressurized backpack sprayer equipped with 11102 XR nozzles (TeeJet, Glendale Heights, IL) calibrated to deliver 187 L ha−1. Any weed escapes were then hand-pulled biweekly following herbicide treatment. Soybeans was harvested from the center two rows for yield with a small-plot combine.
Data Collection
Immediately prior to termination of the cover crop, biomass samples were taken by clipping all aboveground plant parts near the soil surface from each cover crop plot using a randomly selected 0.25-m2 quadrat per plot. The cover crop samples were placed into a drier at 65 C for 72 h, and then dry weight was recorded. Weed biomass was collected based on randomly selected 0.25-m2 quadrats from each subplot in the weedy plots immediately before applying glyphosate or glufosinate. For example, W2 timing (i.e., 2 wk weedy); plots were kept weedy for 2 wk, then weed biomass samples were taken immediately before applying an herbicide. Moreover, weed biomass was collected once at the 8 WAP in the weed-free plots. In total, there were five different timings, including 0 WAP, 2 WAP, 4 WAP, 6 WAP, and 8 WAP.
Evaluation of Critical Period for Weed Control
CPWC is the time interval that is derived from two independent components of crop-weed interaction, the CTWR, and CWFP (Knezevic et al. Reference Knezevic, Evans, Blankenship, Van Acker and Lindquist2002). The CTWR is the maximum length of time during which a crop can tolerate the early-season weed competition without resulting in significant crop yield loss. The CWFP is the minimum length of time during which a crop must be weed-free to prevent unacceptable yield loss after which weed competition has little effect on yield (Knezevic et al. Reference Knezevic, Evans and Mainz2003; Weaver and Tan Reference Weaver and Tan1983; Williams et al. Reference Williams, Ransom and Thompson2007). Weed interference before and after the CPWC does not cause significant yield reduction (Knezevic et al. Reference Knezevic, Evans and Mainz2003; Mahammadi and Amiri Reference Mahammadi and Amiri2011). As previously stated, the CTWR component defines the beginning and CWFP defines the end of the CPWC, whereas the combination of both components determines the length of the CPWC. In general, the weed interference period in weedy plots represented the CTWR, and the weed-free period in weed-free plots represented the CWFP.
Thus, the duration between beginning and end determines the CPWC by using a functional approach dependent on a 5% acceptable yield loss (AYL) and a relative yield of 95% (Blankenship et al. Reference Blankenship, Stroup, Evans and Knezevic2003; Knezevic et al. Reference Knezevic, Evans, Blankenship, Van Acker and Lindquist2002). Yield loss of 5% (traditionally acceptable yield loss level relative to the weed-free yield) was chosen to calculate the beginning and end of the critical period. In addition, AYL is not fixed; it can be adjusted based on the prices of inputs such as fertilizer, herbicides, cover crop seed, and expected net monetary gain.
The CPWC was evaluated after fitting the best nonlinear regression models as proposed by Korres and Norsworthy (Reference Korres and Norsworthy2015) and Williams et al. (Reference Williams, Ransom and Thompson2007). A better fit to the model was determined through the calculation of the coefficient of determination (R 2) for each regression (Schabenberger et al. Reference Schabenberger, Tharp, Kells and Penner1999). The logistic model with three parameters was fit to relative soybean yield (expressed as a percentage of season-long weed-free treatment) for the estimation of the CTWR (i.e., weedy) under each agronomic tillage system:
Furthermore, the Gompertz equation was used to estimate the CWFP (i.e., weed-free) and the effect of increasing the duration of a weed-free period on soybean yield under each agronomic tillage system:
where y is the relative soybean yield, x 0 is depicted as the point of inflection, b is the slope of the curve, α is the asymptote, and x represents the duration (weeks after planting). The duration of CPWC was estimated using the above-mentioned two components depending on a 5% acceptable yield loss and inverse prediction of 95% relative yield for each treatment. Additionally, weed biomass was also examined as a function of the CTWR and CWFP using Equations 1 and 2; y in this instance represents weed biomass. Both CPWC component models (Logistic and Gompertz) are used to fit weed biomass obtained across growing period, to determine whether the treatments influenced either relative seed cotton yield or weed biomass production to the same extent.
Data Analysis
Soybean yield data were analyzed using the MIXED procedure with SAS software (SAS Institute, Cary, NC). ANOVA was applied to check the significance level of treatment, year, and interaction. Means were separated using Fisher’s LSD at α = 0.05 to check the treatment effects on soybean yield for both actual and relative (percentage of the season-long weed-free period). There was a significant year*treatment interaction; hence CPWC was estimated differently for all treatments by year.
Figures, curve fitting regressions, significance model parameters, and inverse predictions were estimated using Sigma Plot software (version 13.0; Systat Software, San Jose, CA) and JMP Pro software (version 13; SAS Institute). Coefficient of determination R 2 was used to observe the fitness for each model, while comparisons between model parameters were performed such as standard errors and t-values were used to check the effect of experimental field treatments on weed biomass production. The three-parameter Gompertz model was used to describe the effect of increasing duration of weed-free period on seed cotton yield. This model provides the best fit to crop yield because it is influenced by increasing length of the weed-free period. A logistic model was used for the CTWR for both cover treatments to describe the effect of weed interference period increases on the relative seed cotton yield (Korres and Norsworthy, Reference Korres and Norsworthy2015).
Results and Discussion
Rye Biomass
Cereal rye biomass was collected in CT + CC plots just before termination, and dry weight was recorded. The collected averaged cover crop biomass was 4,315 kg ha−1, 6,708 kg ha−1, and 3,782 kg ha−1 in 2018, 2019, and 2020, respectively. In the weedy plots, the collected rye biomass was approximately 3,924 kg ha−1 in 2018. Although the averaged rye biomass was 4,707 kg ha−1 in weed-free plots. In 2019, the recorded averaged dry weight of rye was 6,319 kg ha−1 from weedy plots. Additionally, the collected averaged cover crop biomass was 7,099 kg ha−1 from weed-free plots. In 2020, the recorded averaged rye biomass was 4,627 kg ha−1 from weedy plots. The collected averaged rye biomass was 2,936 kg ha−1 from weed-free plots. Some plot variations along with cover crop biomass were observed in weed-free plots in 2020. Also, weather conditions and the effects of annual climate on cover crop biomass production should be considered. According to a report by Palhano et al. (Reference Palhano, Norsworthy and Barber2019), the cereal rye was planted at the seeding rate of 56, 112, and 168 kg ha−1 at the Arkansas Research and Extension Center in Fayetteville, AR. The observed cover crop biomass at 56 kg ha−1 of seed rate was 3,060 and 2,460 kg ha−1 in 2014 and 2015, respectively. At 112 kg ha−1 of cereale rye seed rate, 4,000 and 3,310 kg ha−1 biomass production in 2014 and 2015, respectively. At 168 kg ha−1 of cereale rye seed rate, 4,460 and 3,620 kg ha−1 biomass production in 2014 and 2015, respectively. According to Price et al. (Reference Price, Balkcom, Duzy and Kelton2012), the cereal rye ‘Elbon’ was planted at a seeding rate of 100 kg ha−1 at the T.N. Valley Research Station, in Belle Mina, AL. The collected biomass of cover crop cereal rye was 7,397 to 8,807 kg ha−1. At the E.V. Smith Research Station, in Shorter, AL, the recorded biomass of cereal rye was 6,059 to 9,160 kg ha−1 with the same seeding rate.
Soybean Yield
In 2018, the average yield of CVT, CT + CC, and CT + WF treatments were 2,089 kg ha−1, 2,971 kg ha−1, and 2,805 kg ha−1, respectively. Greater yield was recorded following CT + CC than CVT treatment, likely due to cover crop residue providing moisture conservation after termination. In addition, the greatest difference between cover crops and winter fallow treatments in terms of soil moisture contents can be expected in shorter dry periods approximately 7 to 14 d (Smith et al. Reference Smith, Frye and Varco1987). However, in 2019, the soybean yield following the CVT system was greater (1,188 kg ha−1) than that of CT + CC and CT + WF (946 kg ha−1 and 945 kg ha−1). Similarly in 2020, soybean yield under the CT + CC system was less (1,230 kg ha−1) than that of the CVT and CT + WF treatments (1,872 kg ha−1 and 1,477 kg ha−1, respectively), likely due to the cover crop depleting soil moisture before termination. Aulakh et al. (Reference Aulakh, Price and Balkcom2011) and Price et al. (Reference Price, Wayne Reeves and Patterson2006) also described variability at this site in crop yield following different cover crops and tillage practices.
Critical Period for Weed Control
When considering 95% relative soybean yield in comparison to season-long weed-free control, soybean yield loss did not reach a 5% threshold limit until 2.4 and 1.0 WAP under CT + CC and CT + WF systems, respectively, in 2018. However, yield loss increased when weed removal was delayed after these time durations (Figure 1A; Table 1). At the same time, the model did not predict the CTWR value of CVT treatment due to a greater than 95% relative yield of weedy plots during most of the growing season. In 2018, CTWR following CT + CC was delayed by approximately 1.4 wk compared to CT + WF. The CWFP for the same experimental year ended at 2.4 WAP and 2.8 WAP under CT + CC and CVT systems (Figure 1A; Table 2). For the CT + WF treatment, the relative yield did not reach the 95% level during 8 wk, hence, there was no prediction of CWFP. Moreover, the early beginning of CTWR in CT + WF plots compared to other systems because of a higher infestation of early-season weed species in 2018. Additionally, the estimated value of CWFP (i.e., weed-free plots) and CTWR (i.e., weedy plots) in the CT + CC system was the same (i.e., 2.4 WAP in 2018). Hence, the estimated CPWC was 0 wk, with the beginning at 2.4 WAP and ended at 2.4 WAP in the CT + CC system.
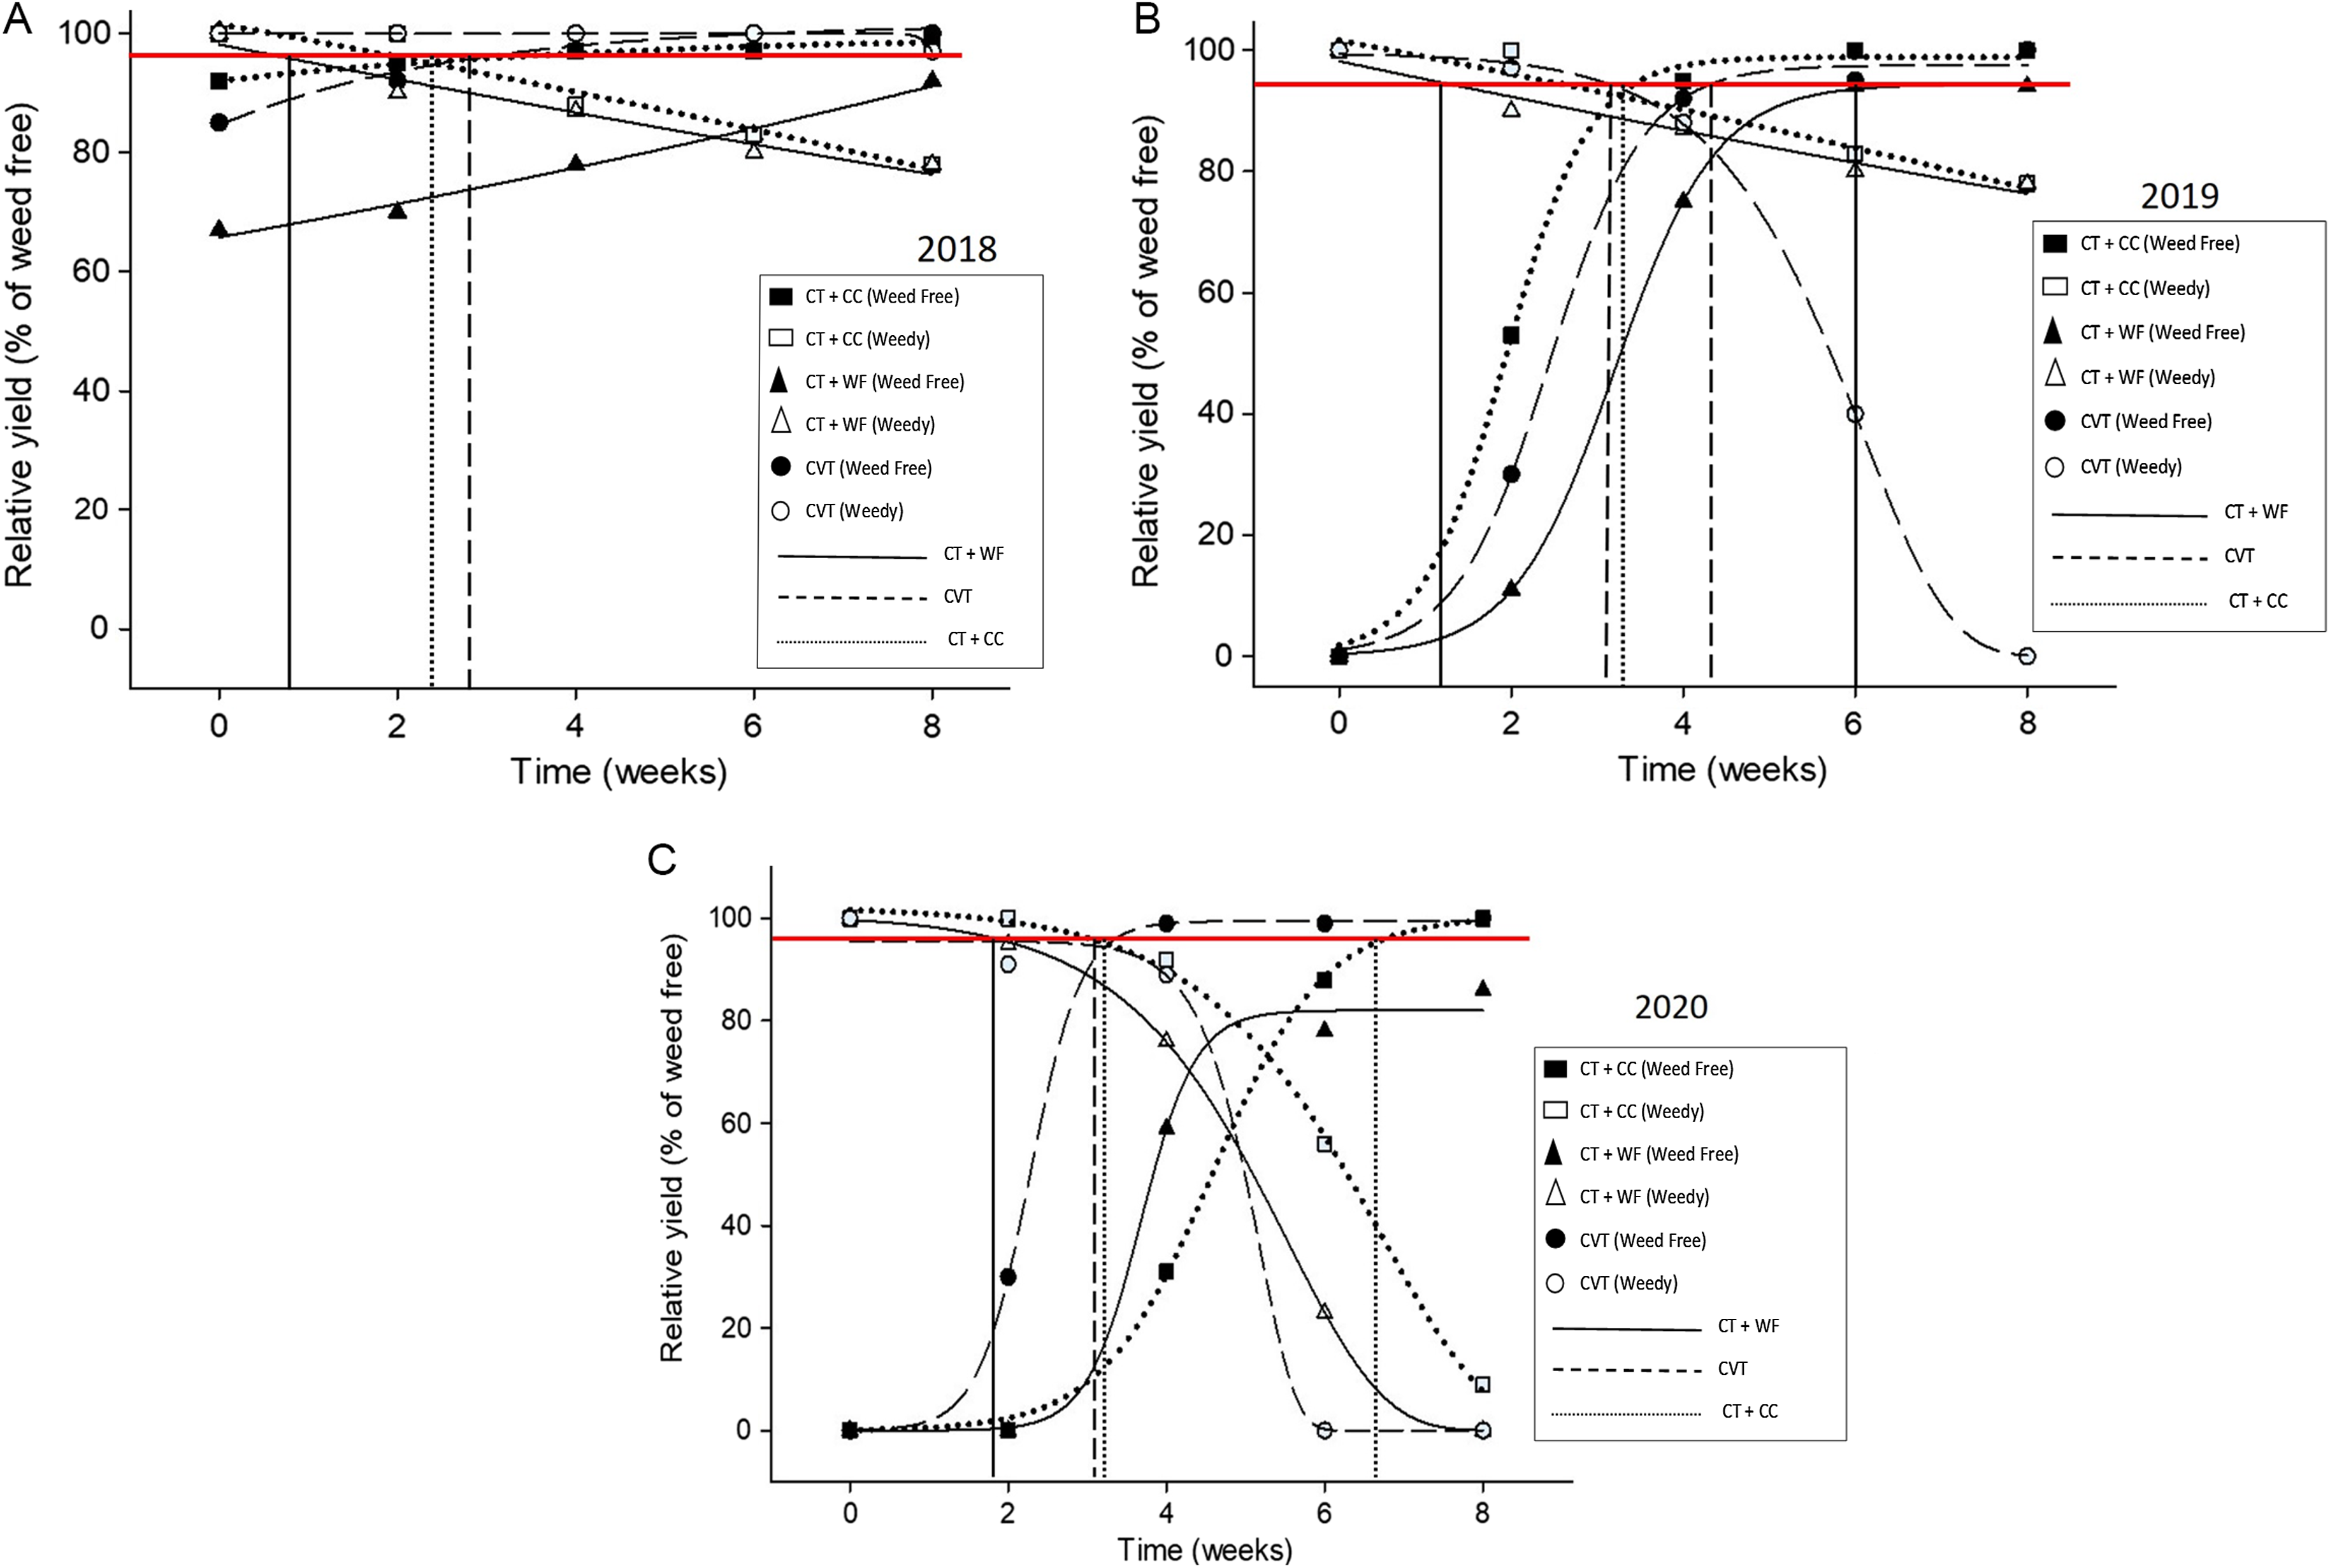
Figure 1. Critical period for weed control and its components (critical timing for weed control [CTWR, i.e., weedy] and critical weed-free period [CWFP, i.e., weed free]) for each of the conservation tillage following a cereal rye cover crop (CT + CC), conservation tillage following winter fallow (CT + WF), and conventional tillage without a cover crop (CVT) treatment in 2018 (A), 2019 (B), and 2020 (C). Point estimates for CTWR and CWFP for CT + CC, CT + WF, and CVT treatments are presented in Tables 1 and 2.
Table 1. Statistics of the three-parameter logistic regression model fitted to relative soybean yield to estimate the critical timing for weed removal for each of conservation tillage following a cereal rye cover crop, conservation tillage following winter fallow, and conventional tillage without a cover crop treatment for estimation of the critical period for weed control. a
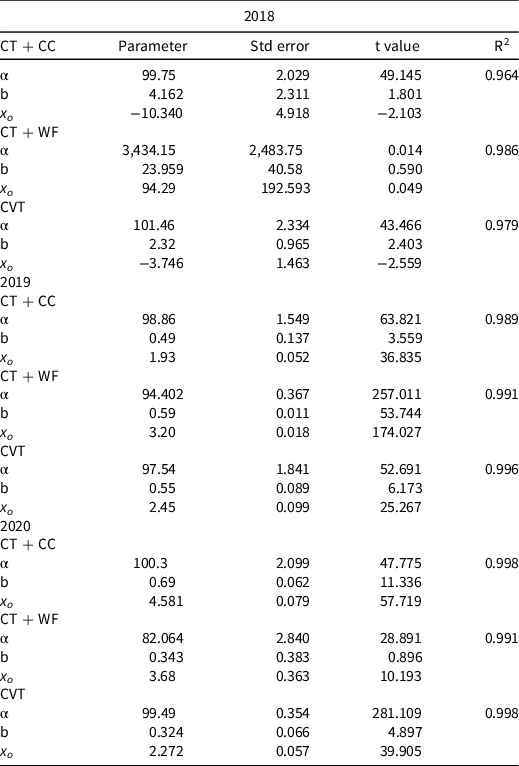
a Abbreviations: α, asymptote of the model; b, slope of the curve; x o , point of inflection; CT + CC, conservation tillage following a cereal rye cover crop; CPWC, critical period for weed control; CTWF, conservation tillage following winter fallow; CTWR, critical timing for weed removal; CVT, conventional tillage without a cover crop.
Table 2. Statistics of the three-parameter Gompertz regression model fitted to relative soybean yield to estimate the critical weed-free period for each of the conservation tillage practices following a cereal rye cover crop, conservation tillage practices following winter fallow, and conventional tillage without a cover crop treatment to evaluate the CPWC. a
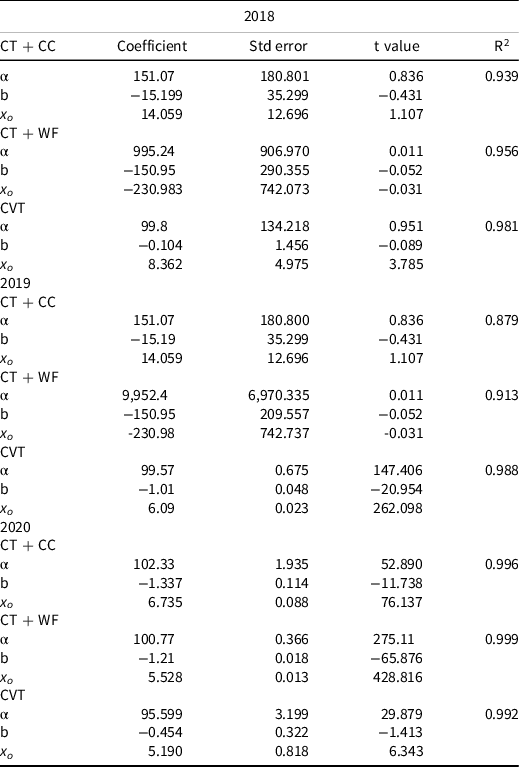
a Abbreviations: α, asymptote of the model; b, slope of the curve; x o , point of inflection; CT + CC, conservation tillage following a cereal rye cover crop; CPWC, critical period for weed control; CT + WF, conservation tillage following winter fallow; CTWR, critical timing for weed removal; CVT, conventional tillage without a cover crop.
In 2019, the predicted value of CTWR was 3.4, 1.0, and 3.2 WAP, and the CWFP ended at 3.4, 6.0, 4.5 WAP following CT + CC, CT + WF, and CVT systems, respectively (Figure 1B; Tables 1 and 2). In the same year, CTWR following CT + CC and CVT systems was delayed approximately 2.4 wk and 2.2 wk respectively, compared to the CT + WF treatment. While CWFP was early following CT + CC and CVT treatment by approximately by 2.6 wk and 1.5 wk compared with the CT + WF system (Figure 1B; Tables 1 and 2). Thus, the estimated CPWC was 5 wk and 1.3 wk under the CT + WF and CVT treatments, respectively (Table 3). The estimated value of CWFP and CTWR in the CT + CC system was the same (i.e., 3.4 WAP in 2019). Hence, the estimated CPWC was 0 wk with the beginning at 3.4 WAP, and ended at 3.4 WAP in the CT + CC system.
Table 3. Estimated value of the CTWR, CWFP, weed-free plots, and duration of CPWC for each of conservation tillage practices following a cereal rye cover crop, conservation tillage following winter fallow, and conventional tillage without a cover crop treatment. a
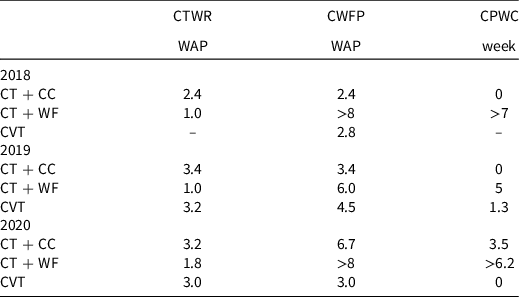
a Abbreviations: α, asymptote of the model; b, slope of the curve; x o , point of inflection; CT+ CC, conservation tillage following a cereal rye cover crop; CTWR, critical time for weed removal; CT + WF, conservation tillage following winter fallow; CWFP, critical weed-free period; CPWC, critical period for weed control; CVT, conventional tillage without a cover crop; WAP, week after planting.
In 2020, soybean yield loss began to increase greater than the threshold (5%) when weed removal was delayed beyond the CTWR of 3.2, 1.8, and 3.0 WAP following CT + CC, CT + WF, and CVT systems, respectively (Figure 1C; Table 1). In 2020, CTWR following CT + CC and CVT was delayed approximately 1.4 wk and 1.2 wk, respectively, compared to the CT + WF treatment. Moreover, the predicted CWFP was 6.7 WAP for the CT + CC treatment (Figure 1C; Table 2). Again, the model did not predict the CWFP for the CT + WF treatment because the relative yield of soybean did not reach 95% during the 8 wk of duration due to competitive early-season weed species in CT + WF plots and reflects higher weed biomass collected from winter fallow plots. In the same experimental year, there was one estimated value (3.0 WAP) of CWFP and CTWR in the CVT system (Figure 1C; Tables 1 and 2). Hence, the estimated CPWC was 3.5 wk following the CT + CC system and 6.2 wk following the CT + WF system (Table 5). Remarkably, the estimated value of CWFP and CTWR in the CVT system was the same (i.e., 3.0 WAP). The longer duration of CPWC in cereal rye plots than the CVT system in 2020 is likely due to poor cover crop growth and low cover crop biomass in weed-free plots at the time of termination due to dryer soil conditions; hence, there was a lower yield than that from other treatments as described above in the soybean yield discussion. Although some of the treatments had only one CPWC because the model did not predict the value of either CTWR and CWFP due to greater than or less than 95% of relative yield within 8 wk of time.
In all 3 yr, the CTWR was delayed in cereal rye cover crop treatment. Halford et al. (Reference Halford, Hamill, Zhang and Doucet2001) described that the beginning of the critical period for weed control in soybean was comparatively more stable than the end period. Our results showed that CTWR and CWFP following CT + CC and CVT treatments was around 3 WAP to 4 WAP in soybean, respectively. While CT + WF treatment resulted in an early start of the CTWR, 1 WAP, again due to higher early-season weed competition in winter fallow plots.
In conclusion, the presence of a cereal rye cover crop delayed the CTWR and caused the early beginning of CWFP, and hence, a shortened CPWC in the 2018 and 2019 by delaying weed emergence and growth of weeds (Table 3). Previous research also concluded that cereal rye delayed CTWR and shortened CPWC in cotton (Korres and Norworthy Reference Korres and Norsworthy2015; Price et al. Reference Price, Korres, Norsworthy and Li2018). Thus, a cereal cover crop probably could provide a significant competitive benefit to soybean against problematic weed species. Comparing CT + CC with CT + WF, the presence of rye shortened the competition duration on soybean in two out of three years. Low residue biomass of cover crop rye was likely the reason for the extended CWFP and relatively longer CPWC duration under the CT + CC treatment in 2020. Hence, a significant amount of cover crop biomass is required to delay the CTWR and shortened the CPWC duration. Along with the benefits of the cover crop, including soil erosion control, minimizing the nutrient losses, etc., cereal rye also offers advantages to soybean by stabilizing potential crop yield.
In addition, the estimated duration of the CPWC in soybean was more extended in the CT + WF treatment compared with the CVT treatment, and similar results were also illustrated by Halford et al. (Reference Halford, Hamill, Zhang and Doucet2001). Our results supported these conclusions that in all 3 yr, the CVT treatment had a shorter CPWC than the CT + WF treatments.
Effects of Treatments on Weed Biomass Production
In 2018, weed biomass 4 wk after planting was lower in the CT + CC (30 to 35 kg ha−1) system than the CT + WF system (350 kg ha−1; Figure 2A; Table 4). In 2019, based on the predicted value of CTWR, when weed removal started, approximately at 3.5 WAP for both CT + CC and CVT systems and 1.0 WAP for CT + WF, the recorded dry weight of weed flora was between 350 and 400 kg ha−1 for all treatments (Figure 2B; Table 4). In 2020, to maintain the relative yield of 95%, when CTWR was initiated, at approximately 3 WAP for CT + CC and CVT systems and 2 WAP for the CT + WF system, weed biomass was 30 to 40, 750, and 200 kg ha−1, respectively (Figure 2C; Table 4). We found variation in weed biomass in weedy plots (i.e., estimation of CTWR) in each year, although the trend was the same among the 3 yr. Additionally, the weed biomass in weedy plots of the CVT treatment was lower than the CT + WF treatment up to 4 WAP, drastically increasing afterward in 2018 and 2019. Moreover, the recorded weed biomass at 2.4 and 2.8 WAP was approximately 300 and 1,700 kg ha−1 for CT + CC and CVT treatments, respectively, in 2018 (Figure 3A; Table 4). In 2019, the collected dry weight of weed biomass was approximately 1,500, 460, and 250 kg ha−1 at the ending time of critical period for CT+ CC and CT + WF, CVT systems, respectively (Figure 3B; Table 5). In 2020, the recorded weed biomass at the ending time of the critical period was 10 to 15 kg ha−1 for CT + CC and 1,250 kg ha−1 for CVT systems, respectively (Figure 3C; Table 5).
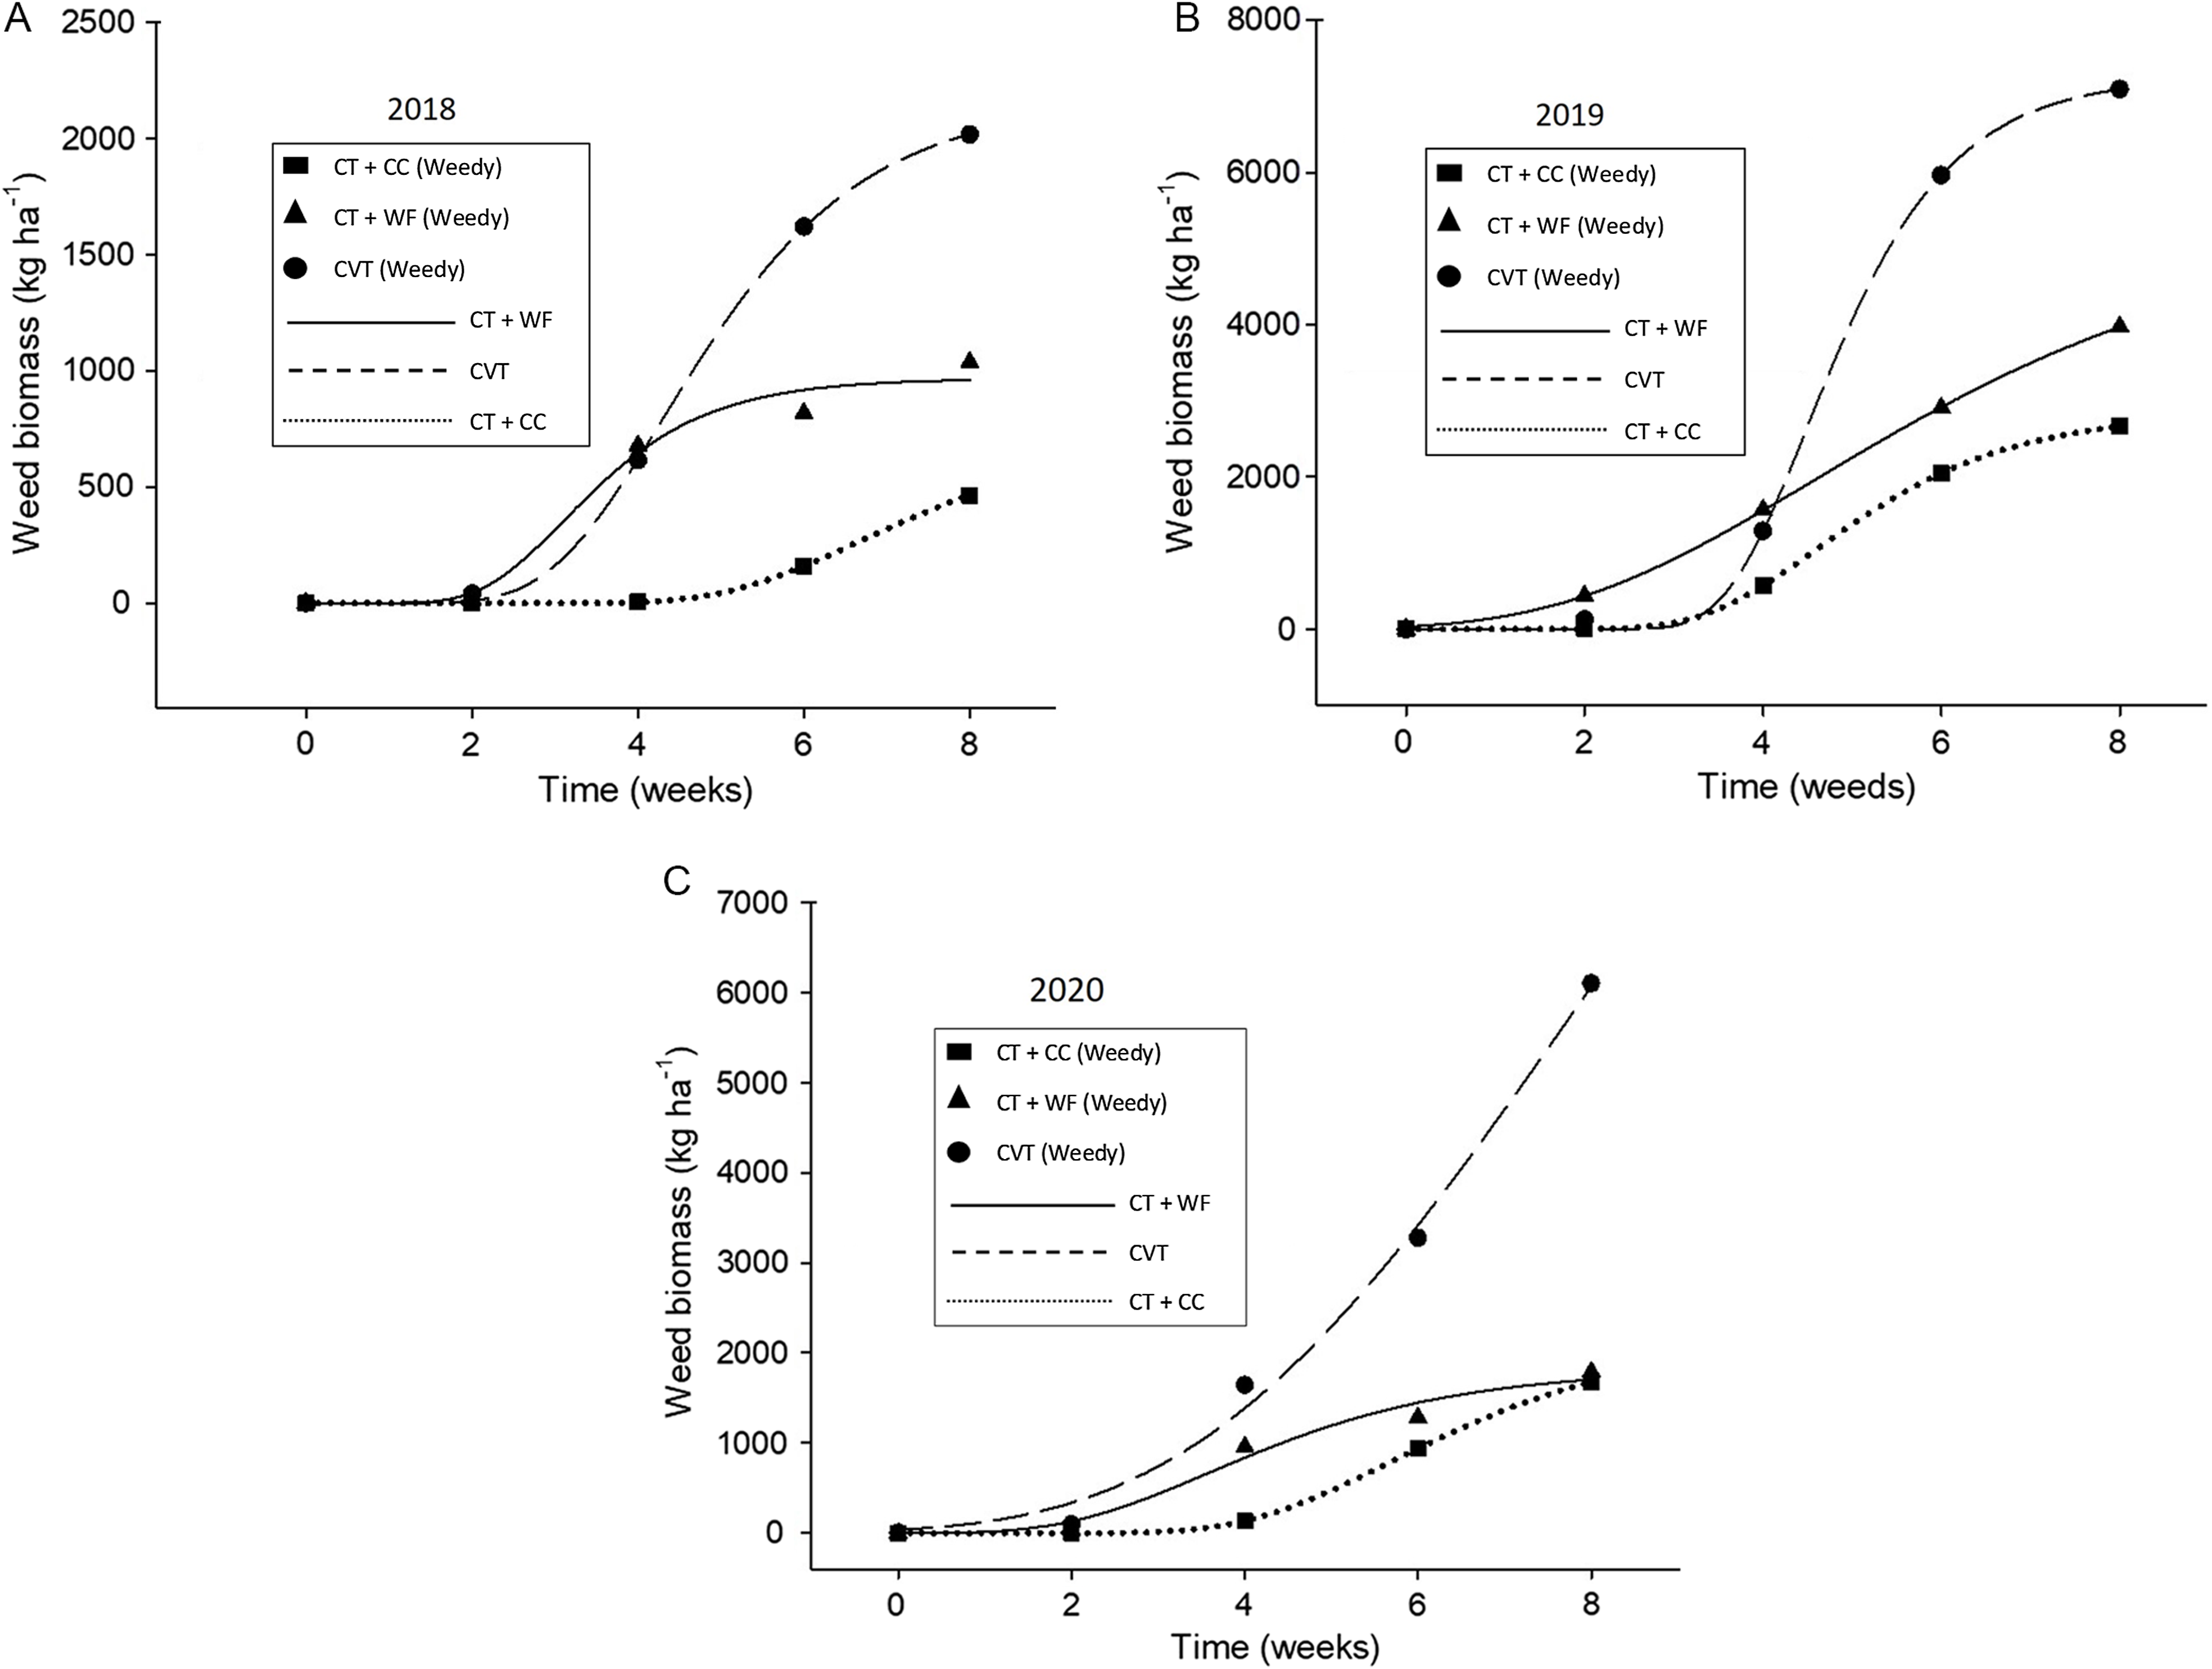
Figure 2. Weed biomass as a function of critical timing for weed removal (CTWR; duration of weed interference with soybean crop) for each of the conservation tillage following a cereal rye cover crop (CT + CC), conservation tillage following winter fallow (CT + WF), and conventional tillage without a cover crop (CVT) treatment in 2018 (A), 2019 (B), and 2020 (C). Parameters of the models are presented in Table 4.
Table 4. Statistics for the three parameters Gompertz model used for fitting weed biomass production under various weedy periods for each of the conservation tillage practices following a cereal rye cover crop, conservation tillage following winter fallow, and conventional tillage without a cover crop treatment. a
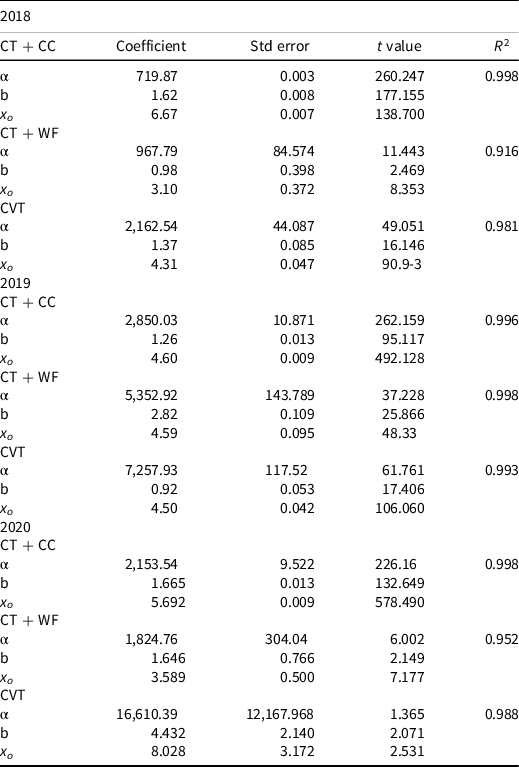
a Abbreviations: α, asymptote of the model; b, slope of the curve; x o , point of inflection; CT+ CC, conservation tillage following a cereal rye cover crop; CTWR, critical time for weed removal; CW + FP, critical weed-free period; CPWC, critical period for weed control; CVT, conventional tillage without a cover crop; WAP, week after planting.
Table 5. Statistics for the three parameters sigmoidal model used for fitting weed biomass production under various weed-free periods for each of the conservation tillage practices following a cereal rye cover crop, conservation tillage following winter fallow, and conventional tillage without a cover crop treatment. a
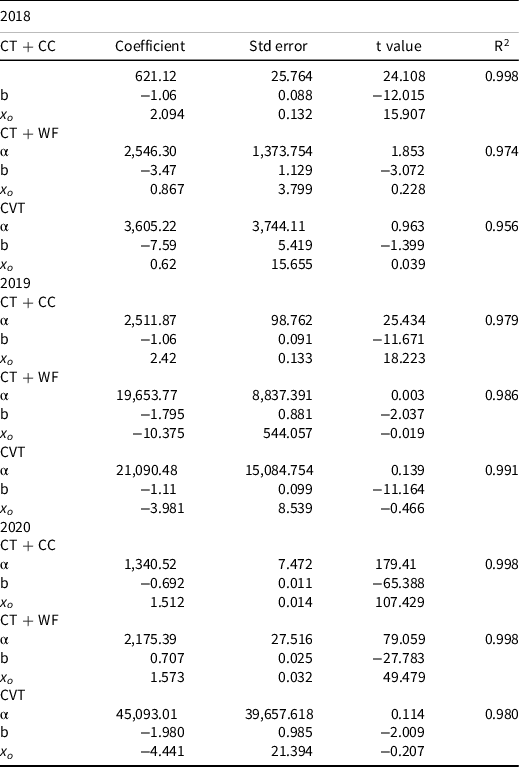
a Abbreviations: α, asymptote of the model; b, slope of the curve; x o , point of inflection; CT + CC, conservation tillage following a cereal rye cover crop; CW + FP, critical weed-free period; CVT, conventional tillage without a cover crop.
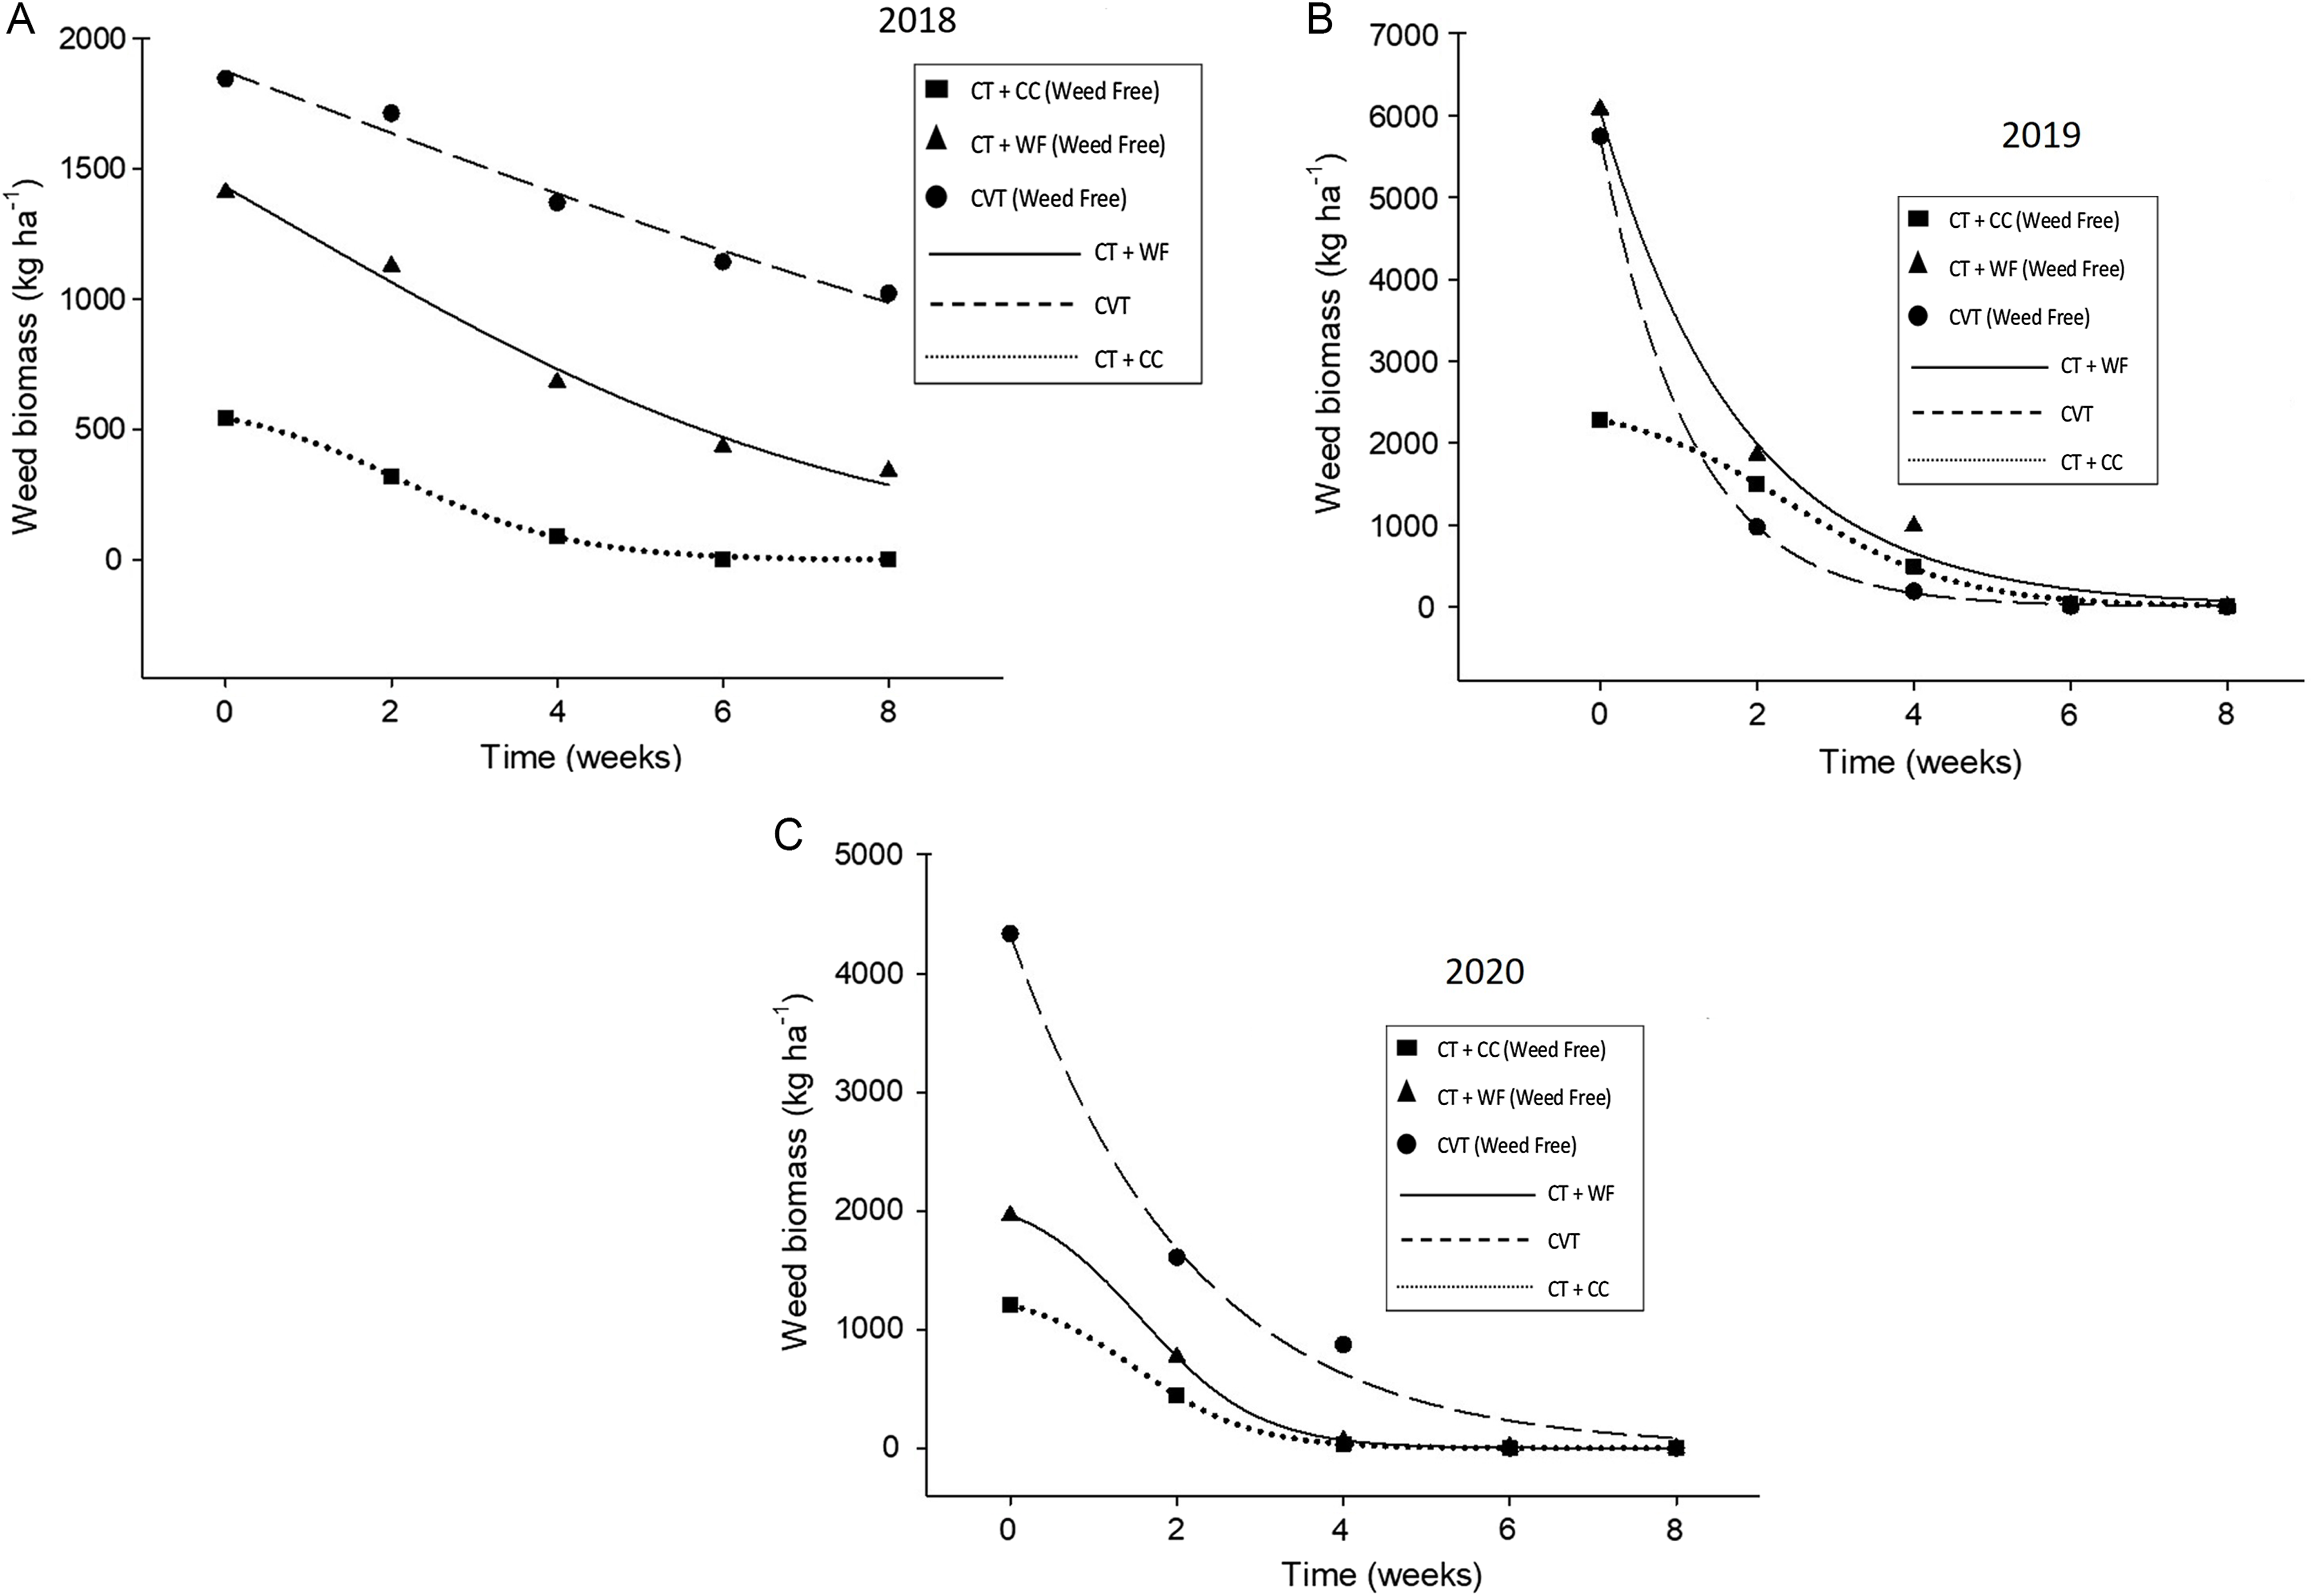
Figure 3. Weed biomass as a function of critical weed free period (CWFP) for each of the conservation tillage following a cereal rye cover crop (CT + CC), conservation tillage following winter fallow (CT + WF), and conventional tillage without a cover crop (CVT) treatment in 2018 (A), 2019 (B), and 2020 (C). Parameters of the model are presented in Table 5.
We collected lower weed biomass from CT + CC than CT + WF and CVT systems in both weedy and weed-free plots (Figures 2 and 3; Tables 4 and 5). Moreover, the presence the cereal rye cover crop rye suppressed weed competition during the growing season of soybean in all 3 yr. Palmer amaranth, sicklepod, morningglory, goosegrass, and nutsedge were the key weed species observed every year.
Practical Implications
The core idea behind the estimation of CPWC is to identify the most effective application timing for nonchemical weed control options and to control troublesome weed species. Our research findings were similar to those of Price et al. (Reference Price, Korres, Norsworthy and Li2018), and demonstrated that a conservation system following winter fallow (CT + WF) caused more reduction in yield potential compared to a cover crop system (CT + CC) if herbicides alone were not effective in weed control. A reduction in weed biomass was observed when cover crop cereal rye was planted with conservation tillage compared with winter fallow in other studies (Aulakh et al. Reference Aulakh, Price, Enloe, Enloe, Wehtje and Patterson2012, Reference Aulakh, Price, Enloe, Wehtje and Patterson2013; Korres and Norsworthy Reference Korres and Norsworthy2015; Price et al. Reference Price, Balkcom and Arriaga2005, Reference Price, Balkcom, Duzy and Kelton2012).
Our results demonstrated that IWM strategies using high-residue cover crop biomass affect the CPWC, thus impacting problematic weed species and increasing conservation system adoption. When the CPWC is short (i.e., CT + CC treatment), then the use of efficacious postemergence herbicides could be more targeted (Van Acker et al. Reference Van Acker, Swanton and Weise1993). However, weed seed bank additions after CPWC should also be considered for the management of resistant weed species (Norsworthy et al. Reference Norsworthy, Ward, Shaw, Llewellyn, Nichols, Webster, Bradley, Frisvold, Powles, Burgos, Witt and Barrett2012, Reference Norsworthy, Griffith, Griffin, Bagavathiannan and Gbur2014).
Acknowledgments
We thank the staff at E.V. Smith Research and Extension center for their help in conducting this experiment. No conflicts of interest have been declared.


