INTRODUCTION
Understanding the aetiology and epidemiology of emerging pathogens is a major factor determining how health professionals manage and control disease. Whilst management at the clinical level can be progressed incrementally with each patient treated, management in the public health sphere is limited by the small number of cases available from which to characterize epidemiology and aetiology. Mycobacteria are slow-growing actinomycetes of which Mycobacterium tuberculosis and M. leprae are perhaps the most well-known human pathogens. Whilst the epidemiology of these two diseases is well understood, there are a range of other mycobacterial species that pose risks to human health. There are many other species of mycobacteria that are facultative saprophytes but are also pathogenic in human hosts [Reference Goodfellow, Magee, Gangadharam and Jenkins1, Reference Falkinham2]. Atypical mycobacterial infections have increased in prevalence in the United Kingdom over the last 20 years [Reference Lamden3]. The increase reflects in part the emergence of HIV infection, where mycobacterial infection is an opportunistic response to immunosupression, but there have also been increases in incidence in the non-HIV community. The majority of the increase in cases over this period has been due to infection by M. avium [Reference Colville4] but infections by a strain identified as M. malmoense (a species first discovered in 1977) have also increased [Reference Schroder and Julin5]. The biogeographies of M. avium and M. malmoense in the United Kingdom are different with the latter having a more northerly distribution [Reference Doig6], whilst M. avium is found more in the south. In patients with HIV, infection by both species is often disseminated. In immunocompetent hosts, however, infection is localized and usually results in either pulmonary disease or cervical lymphadenitis. Cervical lymphadenitis is usually found amongst children [Reference Henriques7] and most records of this disease in the United Kingdom occur as a result of infection by M. avium [Reference Colville4]. Pulmonary disease on the other hand is usually found in adults and is often associated with other predisposing pulmonary disease [Reference Contreras8]. Whilst the pulmonary disease is curable, infection has been shown to increase morbidity. In the case of M. malmoense death due to infection may be as high as 15% of cases infected [Reference Banks, Jenkins and Smith9]. Infection with this disease may also shorten longevity, since death rates up to four times higher than that expected amongst the general population have been recorded even though infection itself may not be identified as the proximal cause of death [Reference Campbell10].
There is considerable public health interest in understanding the epidemiology of these pathogens. In this paper we investigate the epidemiology of M. avium and M. malmoense infections in cases recorded in northern England over the period from 2000 to 2005 using space–time clustering and Generalized Linear Modelling (GLM) approaches. We assess the extent to which incidence of the disease is clustered, consider possible causes of clustering where it exists and investigate the role of social and environmental predictors in determining the incidence of infection by both species.
MATERIALS AND METHODS
Data
The data were derived from anonymized records of the incidence of M. avium and M. malmoense held by the North of England Reference Centre for Mycobacteriology based in the Health Protection Agency Regional Laboratory, Newcastle, UK. These comprised the residential post-code of patients and the date of record for all primary positive records of samples submitted to the Reference Centre between 2001 and 2005. The post-codes were converted to spatial locations on the United Kingdom National Grid using a post code–grid reference cross-referencing file available from the Office of National Statistics. The geographical coordinates of the case residence and the date of record were used as inputs to the space–time clustering analyses.
Potential environmental and social predictors of disease incidence could not be collected at the temporal and spatial resolution of the individual case. Instead we adopted the administrative districts in which each case was found as the unit for modelling. Super Output Areas (SOAs) are a geographic hierarchy designed to improve the reporting of small area statistics in England and Wales within the United Kingdom. SOAs were generated by a computer program which merged units of landscape together taking into account measures of population size, mutual proximity and social homogeneity [11]. At the lowest level, landscape units are grouped in units with a mean population of 1500 individuals. We overlaid the records of disease incidence for the period 2000–2005 on a map of the distribution of Lower SOAs for the north of England, in order to assess how many records occurred in each SOA and evaluate the extent to which the SOA could be used as the spatial unit of the response (incidence of disease) in the GLM.
Five predictors of social deprivation derived from the Office of National Statistics were collated for each SOA in which each case was found [11]. These were indices of health, income, education, environment, housing and an index of multiple deprivation (IMD) which was a government statistic derived from a combination of all of the other indices. Each index was derived from counts of measures of deprivation in each category. The index of income deprivation was derived from taxation and social credit-based statistics for each household, specifically: indicators comprising the number of adults and children in Income Supportable households; adults and children in Income Based Job Seekers Allowance households; adults and children in households claiming Disabled Persons Tax Credit and the number of Asylum seekers. The health deprivation index was determined from morbidity data; health statistics related to hospital admission and measures of adults suffering from mood or anxiety disorders. The morbidity data were used to calculate an estimate of years of potential life lost, as an age- and sex-standardized measure of premature death in the SOA. Since we could not collect social and environmental data at the same temporal scale as the cases themselves, we assumed that the data collected for the 2001 national census (Office of National Statistics), at the beginning of our sample period, were representative of the space and time period over which cases of M. avium and M. malmoense were recorded.
Environmental predictors were also not available at the resolution of either the individual case disease or the SOA. We collected variables that we hypothesized might impact on the incidence of atypical tuberculosis, these were rainfall and extent of urban environment. Rainfall was selected because mycobacteria are found extensively in natural water systems and one suggested route of infection is through aerolization in water droplets [Reference Falkinham2], thus wetter environments might be expected to have higher incidences of infection. The extent of the urban environment along with SOA size were used as surrogates for population density, since the SOA is defined in terms of its population size. Mean annual rainfall at 5 km−2 resolution (UK, Meteorological Office) was used to create a fine scale map at 50 m for the United Kingdom. A map of the SOAs at the same spatial scale was then overlaid over the rainfall data and a mean annual rainfall for the SOA derived by averaging across the rainfall values for all pixels in the SOA map. The proportion of each SOA that was urban and built environment was collated in a similar way but based on the coverage of urban/building in each 1 km of the National Grid. These data were derived from the CEH Land Cover map, a classification of satellite images derived from imagery collected in 1989 and 1990 [Reference Fuller, Groom and Jones12] and available from the Countryside Information System [13]. Overlaying maps of different spatial scales obviously leads to only very crude estimates of the extent of both potential predictors in each SOA, but no other data were available at the appropriate scale. All spatial data were collated and overlaid in the public domain geographical information software GRASS [Reference Westervelt14].
Analysis of space–time clustering
We used K-functions to estimate the extent to which cases of M. avium and M. malmoense were clustered in time and space. The K-function is a second-order moment measure that measures spatial dependence over a range of spatial scales [Reference Diggle, Chetwynd and Haggkvist15]. K-function analysis has advantages over other techniques for investigating clustering because it specifically focuses on investigating the scale of space–time interactions rather than simply testing the null hypothesis that there is no space–time interaction [Reference Rowlingson and Diggle16]. The K-function at distance s is defined as the expected number of events within distance s of an arbitrary event. Over a surface of events it is calculated from:
where R is the area of the study area; n is the number of points; s is the distance; I is an indicator variable taking the value 1 if the event is within the distance s; d is the distance between points i and j and w is an edge-correction factor that allows for the fact that the boundary of the study area may lie within the search radius s, beyond which there are obviously no events to count. If K(s) is calculated for randomly distributed points in the same plane, for multiple realizations of randomly distributed points, then it is possible to assess the extent to which the observed pattern K deviates from random. To consider clustering in both time and space the K-function is extended to K(s, t) which is defined as the expected number of events within distance s and time t of an arbitrary event. Here u is the temporal separation between points i and j and v is an analogous edge-correction factor for time:
If the processes are independent in time and space then K(s, t) should equate to the product of two K-functions, that relate to space K s(s) and to time K T(t).
The function:
[Reference Diggle, Chetwynd and Haggkvist15] is then a measure of the extent of spatio-temporal dependency in the point data. The extent to which there is spatial and temporal dependency in the point data can be assessed by Monte Carlo approaches in a manner similar to that for the simple K-function, by allocating time coordinates to the points at random and comparing the random D(s, t) with those of the observed.
We used the SPLANCS package [17] within the public domain statistical package R [Reference French18] to analyse space–time clustering in the point data for M. avium and M. malmoense. In order to allow for an edge-correction factor, we defined the study area as a convex polygon enclosing all data points. In reality this polygon approximated to the coastline on the east and west coasts of the Unitrd Kingdom but was cut off in the north by the boundary of Scotland and southern England (for which we had no data). The age distribution of cases was highly bimodal for both species of Mycobacteria, so we undertook separate analyses for two age groups, juveniles and young adults aged ⩽20 years and adults aged >20 years. It is possible to calculate K-functions over any range of time (t) and space (s) units between the upper and lower limits of the geography and time domains in a dataset. For datasets where information on time and position are recorded at fine scales, as here, the computational time required to undertake the analysis at increments of unit time and space over the whole geographical and time ranges of the data would be large. We undertook initial analyses over the range 0–30% of the total ranges in time and space with time and space steps of 500 m and 30 days. The upper limit of 30% of the ranges in s and t were selected to ensure that the edge-correction factors (w and v) did not become unbounded as happens when either value approaches the magnitude of the geographical and temporal ranges of the dataset [Reference Bailey and Gatrell19]. Where significant space–time clustering was detected, the range of time and space was then narrowed to encompass the highest peaks on the surface plot of D(s, t) and the analyses repeated in order to identify the spatial and temporal range over which clustering was most apparent. The final analyses were undertaken with a spatial range of 1000–5000 m in 100-m steps and with a time range of 20–400 days in 30-day steps. We used 999 randomizations to assess the significance of clustering in each test, allowing us to test the extent of significance to three significant figures.
Generalized Linear Modelling
Whilst we had spatial coordinates and measures of predictor variables for SOAs where both diseases were found over the period 2000–2005, we did not have equivalent data where the disease was known not to occur. We used SOAs where the disease had not been recorded as controls in a case-control analysis of the relationship between disease incidence in SOAs and the potential predictors. To do this we selected an equivalent number of controls to the number of cases. We then fitted unconditional logistic regression models with presence/absence recorded for case and control SOAs as the dependent variable and the social deprivation and environmental data for each SOA as explanatory variables. The predictor variables were: the Index of Multiple Deprivation (IMD score); indices of health, income, environmental deprivation, mean annual rainfall for the SOA, the proportion of the SOA urban/built environment and the size of the SOA. Since the number of cases of infection by both diseases was low relative to the total number of SOAs available with no records of infection analyses were repeated 1000 times for 1000 selections of controls, to assess the extent to which models were robust. In effect this represents a compromise between maximizing the efficiency of the logistic regression analyses (where a balance of 50:50 presences and absences minimizes the sensitivity of the analysis to the level of prevalence within the data) and covering the range of variation in explanatory variables in the population of SOAs where disease was not recorded. We assessed model significance on the basis of how many times out of the 1000 runs the regression coefficient for each predictor in each model were significant. Thus, if the regression coefficient for a particular variable was significantly different from zero 998 times out of the total 1000 analyses, we concluded that this represented a P value of 99·8% of that variable being a significant predictor. We collated the empirical P values for the regression coefficients and derived mean estimates of P and associated confidence intervals for each predictor variable in each model. We assessed the variance explained by each model in terms of the decline in deviance in each replicate and provided estimates of the mean deviance explained for each model. We fitted a full model with all predictor variables included and then stepwise removal of non-significant predictor variables was used to find the most parsimonious model. We assessed the extent to which the binomial error model was suitable for the model by assessing overdispersion in the residuals. Models were undertaken for all records of M. avium and M. malmoense and for the two age groups (>20 years and ⩽20 years) separately.
RESULTS
There was a total of 554 cases of M. avium and 268 cases of M. malmoense in the north of England region over the period 2000–2005. The region comprised 11 385 Lower SOAs indicating that both diseases were comparatively rare in the population as a whole (around 1/20 500 and 1/42 500 in the population, respectively). The distribution of cases closely follows that of population density with concentrations in the metropolitan areas of Leeds, Manchester, Tyneside and Teeside (Fig. 1). The geographical distribution of cases of M. avium appeared to be wider than that of M. malmoense but this probably reflects the greater number of cases of infection by the former. The age distribution of cases was bimodal for both diseases with the majority of cases being recorded in older age groups (Figs 2 and 3). There were 63 cases of infection with M. avium that were aged ⩽20 years. The mean age of these cases was 5·46 years (s.d.=4·84, median 4 years) with the data highly skewed to the left, with most cases <3 years of age. There were 27 cases of infection with M. malmoense in juveniles aged ⩽20 years. The mean age of these cases was 4·529 years (s.d.=4·11, median 3 years). Both diseases in the younger age group were clearly associated with very young children. The ethnicity of cases was not recorded with sufficient frequency to allow this variable to be used in analyses.
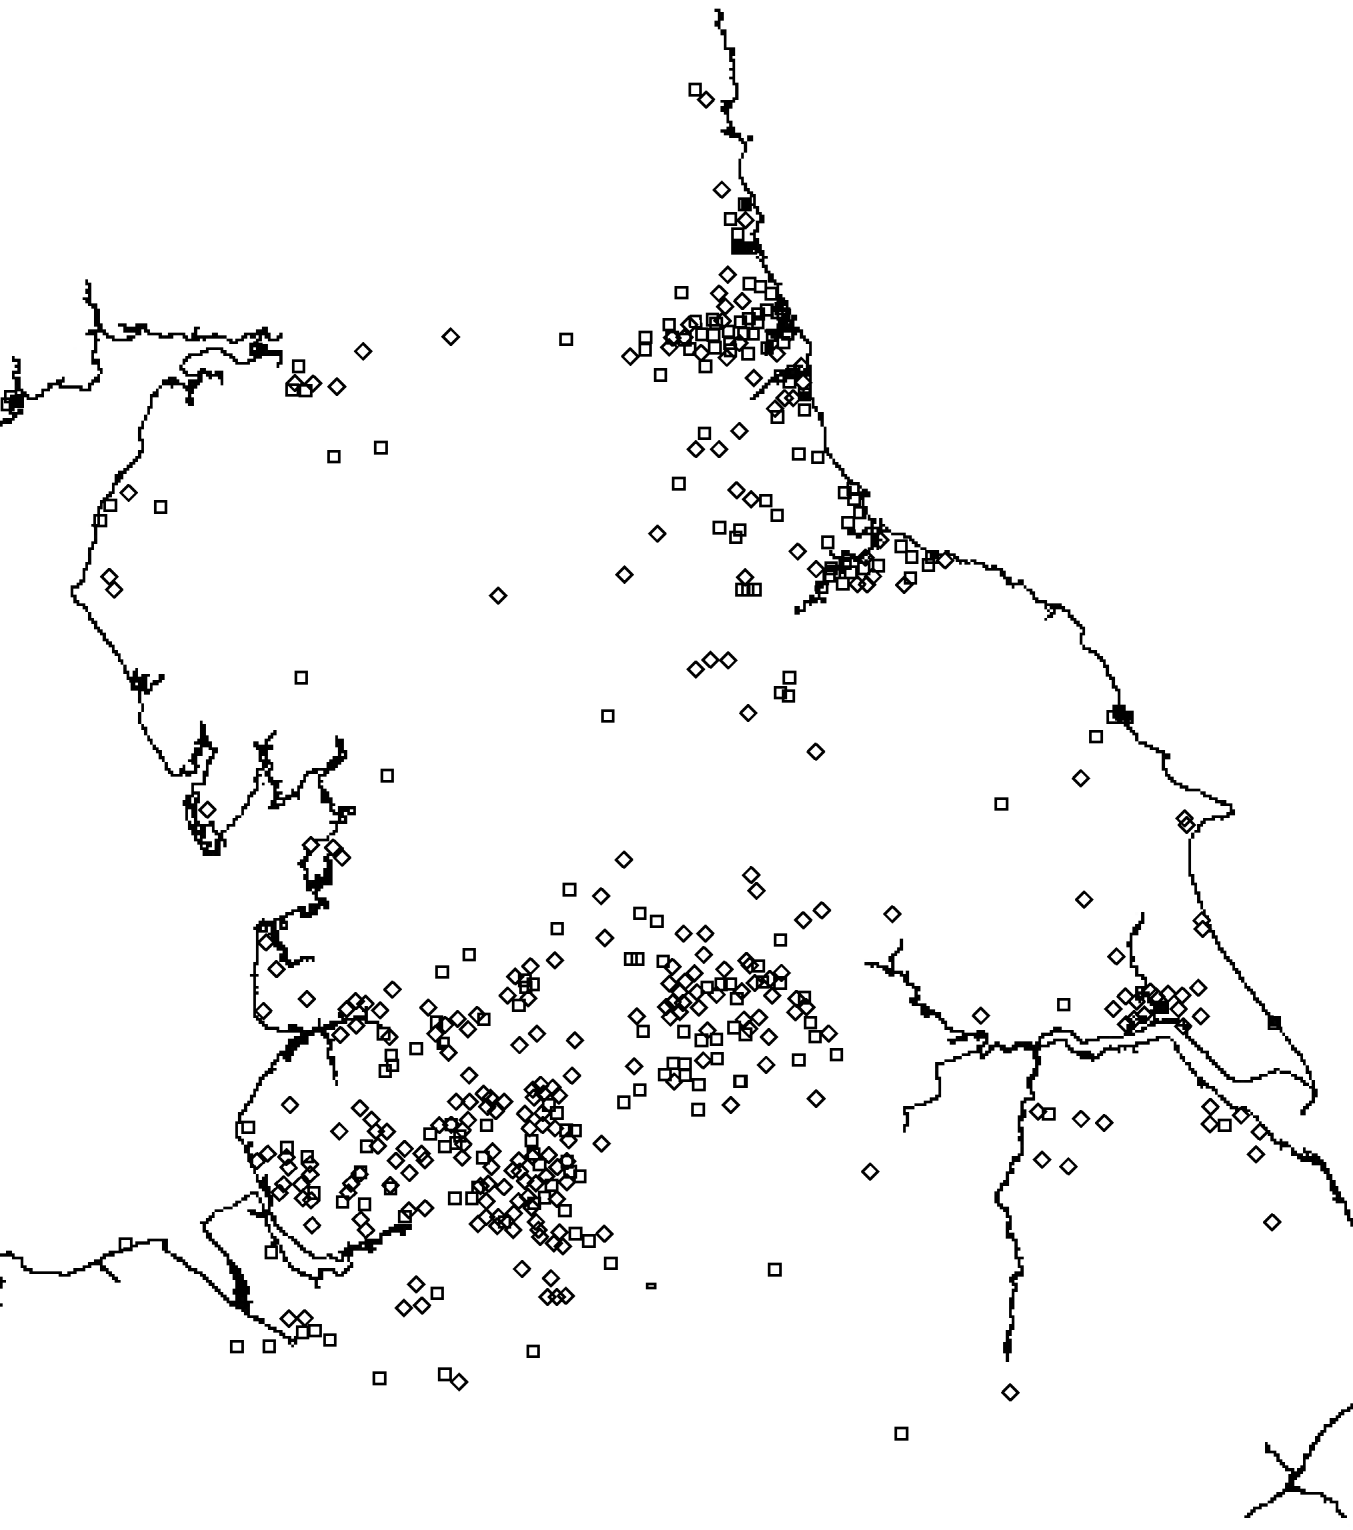
Fig. 1. Distribution of cases of M. avium (⋄) and M. malmoense (□) in northern England 2000–2005.
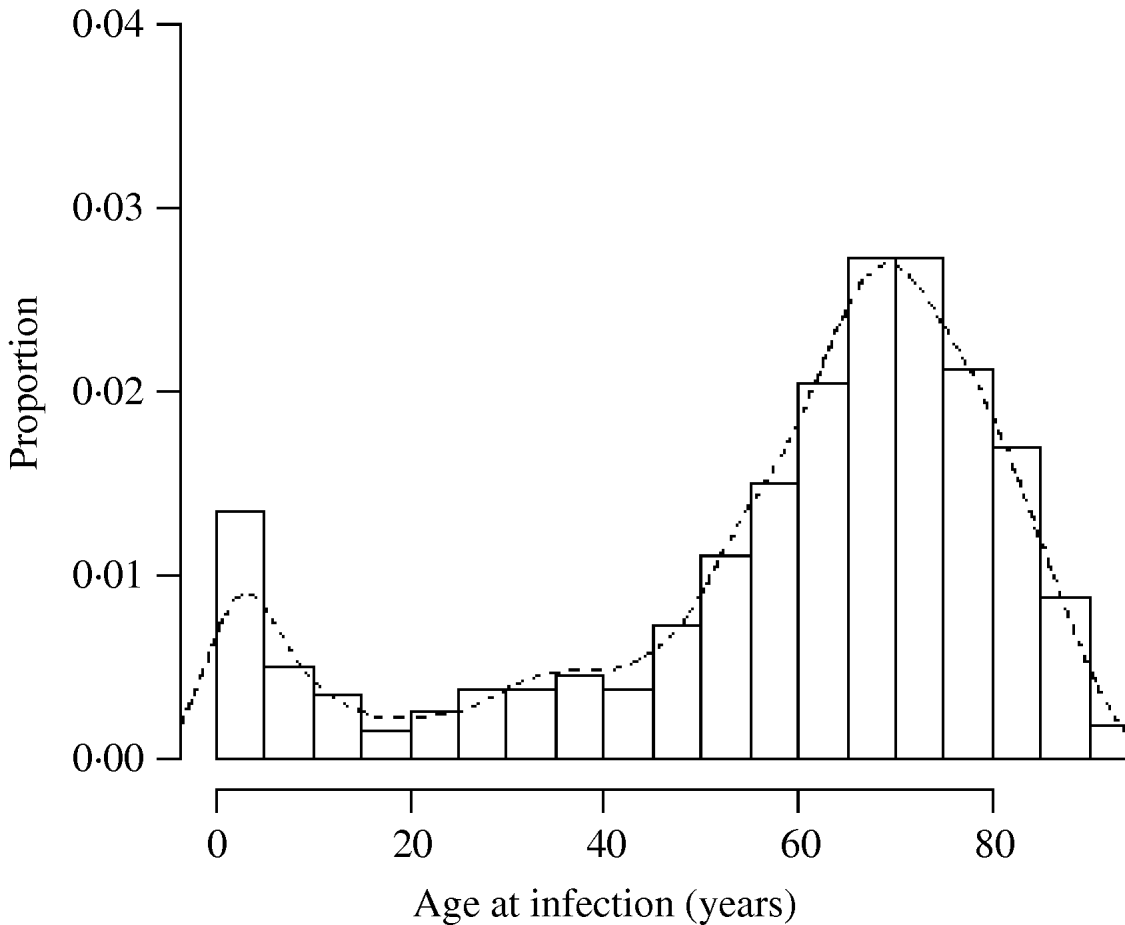
Fig. 2. Histogram of the age of cases of M. avium in northern England 2000–2005. Curve fitted by kernel smoothing.
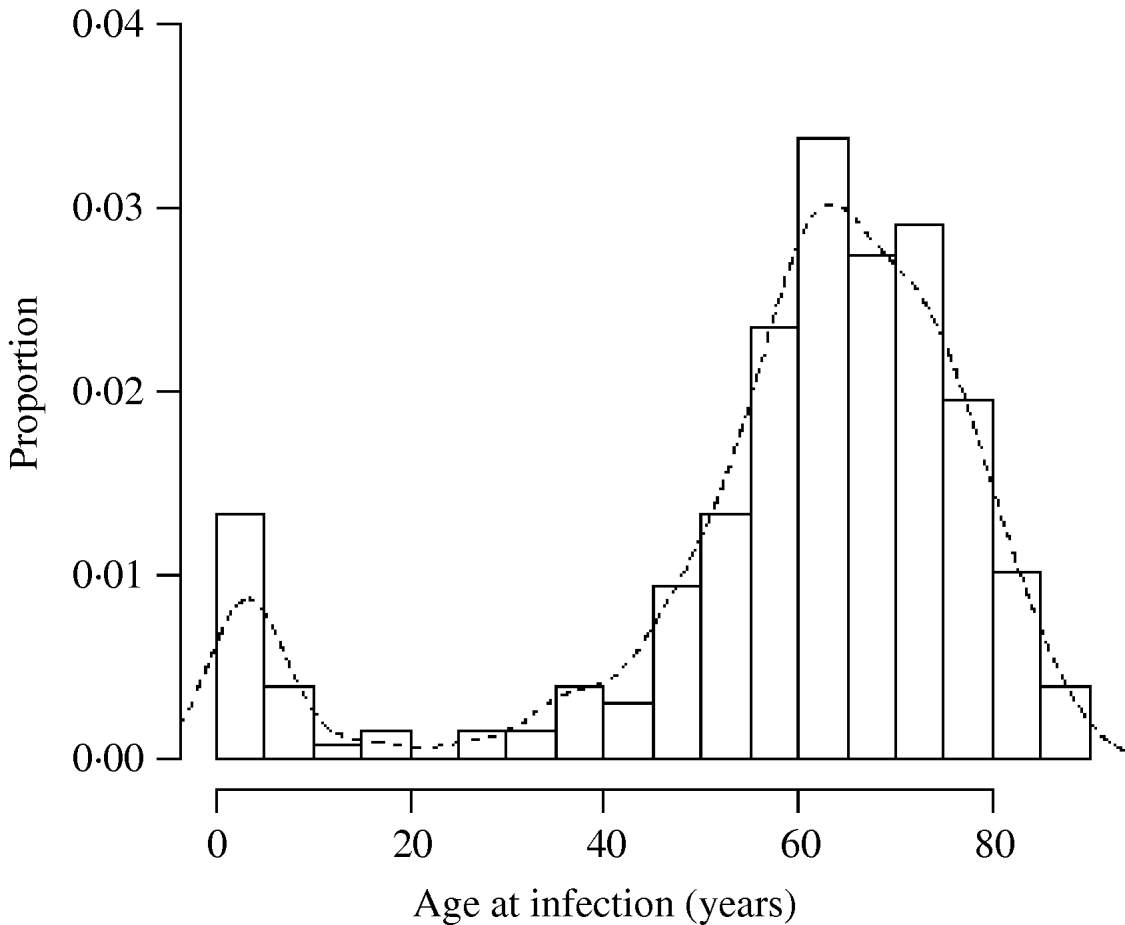
Fig. 3. Histogram of the age of cases of M. malmoense in northern England 2000–2005. Curve fitted by kernel smoothing.
There was no significant space–time clustering for cases of infection by either Mycobacterium species when all ages were considered together. When the cases were split into two age groups, there was no evidence of significant space–time clustering in cases of M. malmoense for either age group, whilst cases of M. avium infection amongst the ⩽20 years age group showed clustering with 966 out of 999 simulations of randomly allocated time coordinates having a smaller D(s, t) value than that observed in the case data (Fig. 4). There was no evidence of clustering in M. avium cases for adults aged >20 years. The contour surface of D(s, t) values for the ⩽20 years age group of M. avium cases (Fig. 5) showed a peak at 200 days peaking at a range of ∼2000 m but was generally higher over all spatial ranges. The results suggest that the incidence of cases of M. avium in individuals aged ⩽20 years was not random.
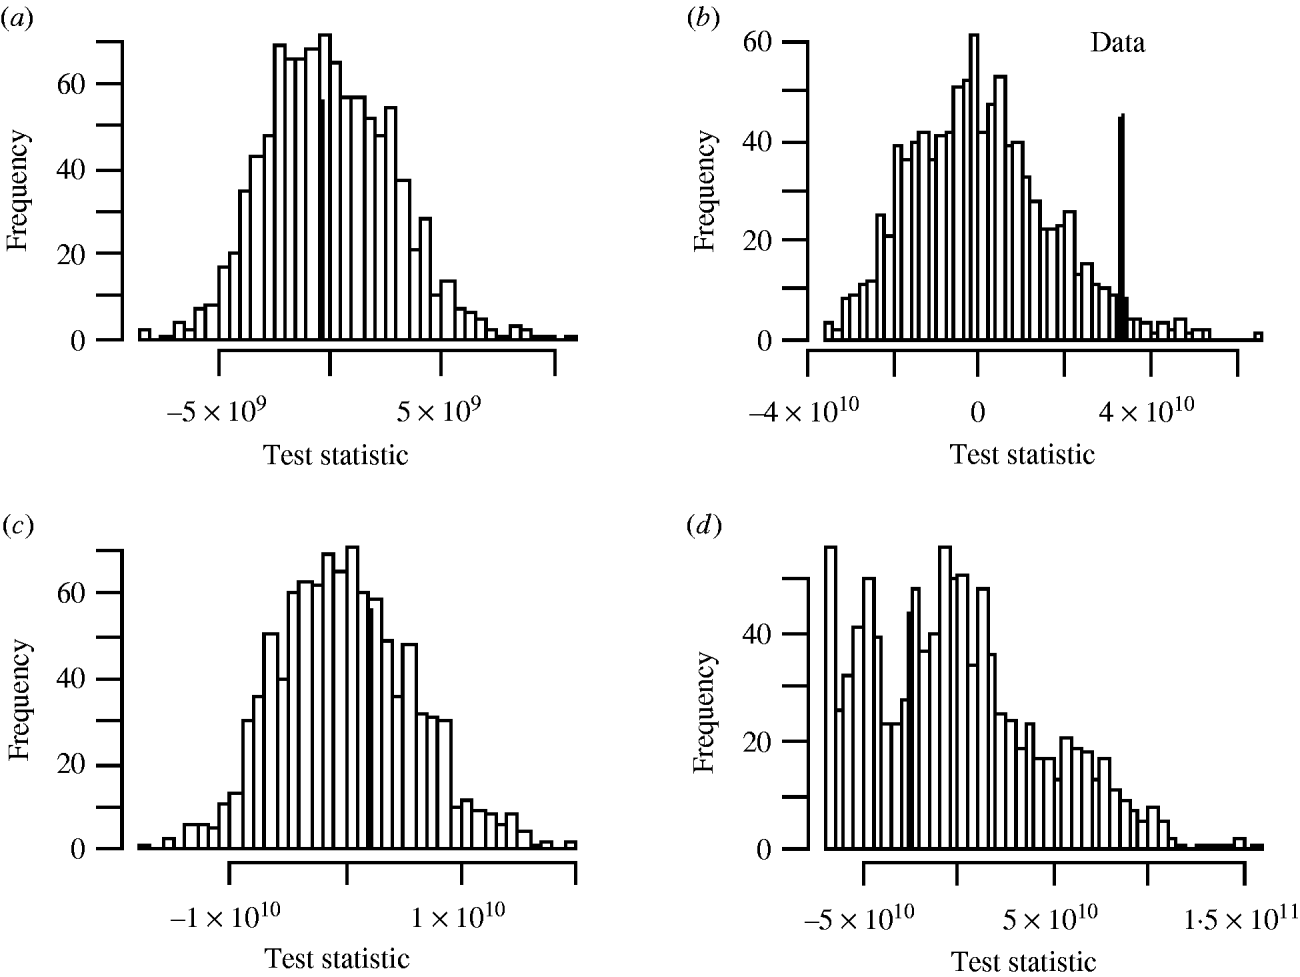
Fig. 4. Monte Carlo test of significance of space–time clustering for cases of (a) M. malmoense ⩽20 years age group; (b) M. avium ⩽20 years age group; (c) M. malmoense >20 years age group and (d) M. avium >20 years age group. A total of 999 simulations undertaken in each case. Filled bar represents position of observed data in the set.
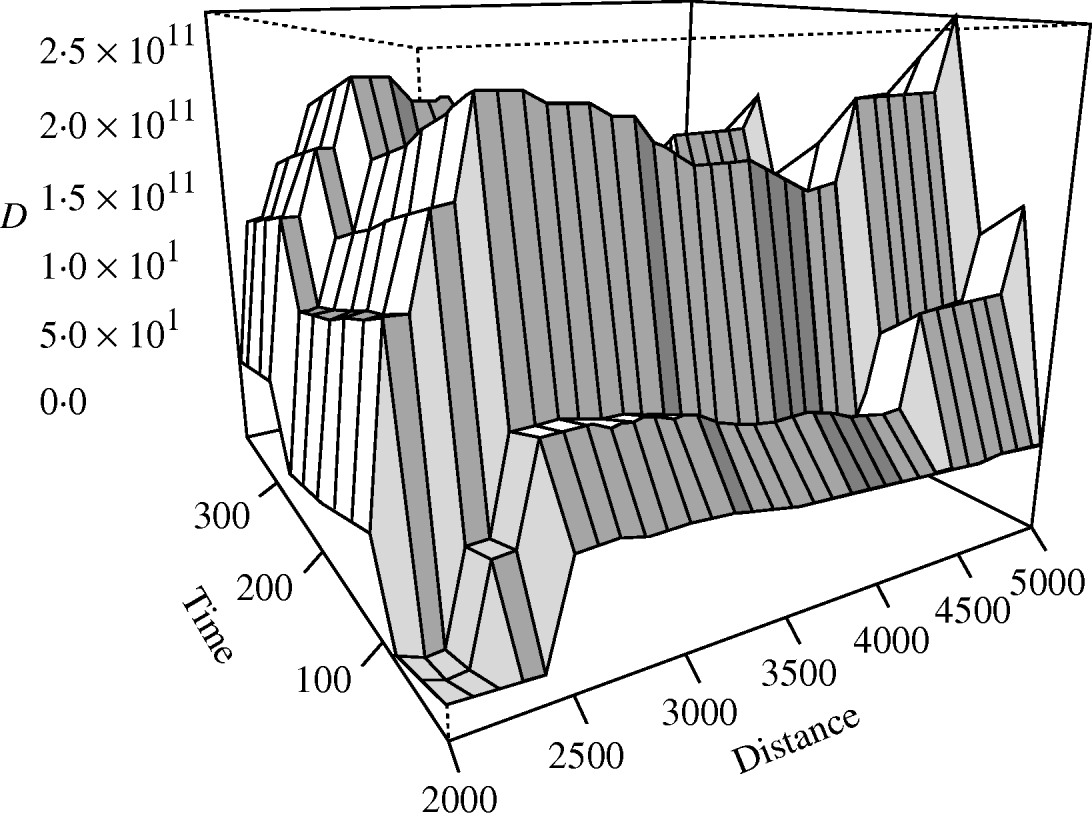
Fig. 5. Contour plot of the D(s, t) values of the space–time clustering analysis of M. avium cases aged ⩽20 years in northern England.
The distribution of cases of infection amongst SOAs was uniformly low with only one record of two cases per SOA amongst the ⩽20 years age group for M. avium; 14 cases of two records per SOA in the >20 years age group. There were only five cases of duplicate records per SOA amongst all of the M. malmoense cases. There were no cases where an individual SOA had more than two cases of infection with either disease. The frequency (n=1000) with which each predictor variable had a significant regression coefficient in a full model with all predictors included is shown in Table 1 for analyses of the combined age groups and individual age groups of each Mycobacterium species. In the full model there were no predictor variables that were significantly different from zero for 95% of the sample runs. Stepwise reduction of individual predictors from the full model was used to identify models with increased significance. With the exception of a two-variable model including IMD score and the extent of urban/built environment in the SOA, none of the predictor variables produced had significant regression coefficients in more than 50% of the sample runs for any age grouping of the M. malmoense data. For M. avium health deprivation score in combination with rainfall had significant regression coefficients more frequently (Table 2) for the >20 years age group and also for the combined age groups. The model for the combined age groups had significant regression coefficients for the health and rainfall covariates 945 and 781 times respectively out of the 1000 runs. In the >20 years age group the models performed slightly better with 980 and 856 runs out of 1000 producing significant regression coefficients for the health and rainfall covariates. Ninety-five per cent confidence intervals on the P values for the 1000 model runs did not include the 0·05 indicating that for the majority of model runs the covariates of health deprivation score and rainfall were significant predictors of incidence of M. avium in SOAs. The amount of variation in the incidence of cases explained (the deviance decline) in all models was <2%, suggesting that none of the predictors were good explanatory variables for the incidence of disease. The indices of overdispersion in the adult and combined age group models were low at 1·365 and 1·368 respectively, indicating that the binomial error model was appropriate for analysing the data. The amount of variation explained by the model for the >20 years age group was greater than that for the models with the combined age groups, suggesting that the factors explaining the incidence of disease in adults were different from those for juveniles aged ⩽20 years. A post-hoc analysis of the power of the parsimonious logistic regression equations for all cases of M. avium infection and the >20 years age group showed that the sample size needed to achieve a power of >80% for an odds ratio of 1·01 was in excess of 10 000 cases. Taken together these results suggest that predicting the incidence of human infection by either Mycobacterium species is likely to be difficult.
Table 1. Regression diagnostics relating disease incidence to different social and environmental predictors, where controls were selected at random from the Lower Super Output Areas in northern England (n=1000 selections of random controls paired with the observed cases)
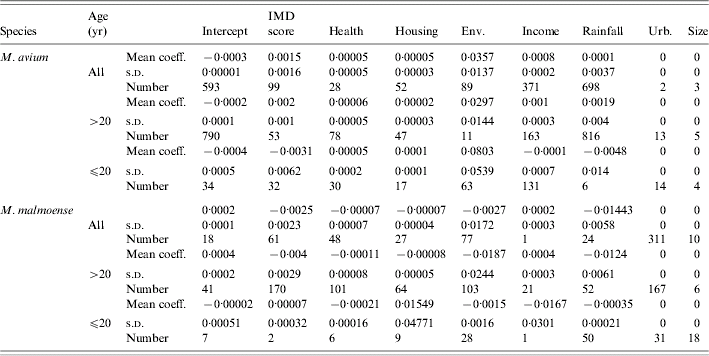
Mean regression coefficients, standard deviations and the number of replicate models for which the relevant regression coefficient for a variable was significant at P<0·05.
IMD, Index of multiple deprivation; Env, environmental deprivation score; Urb, extent of urban.
Table 2. Number of times each predictor variable had a regression coefficient significantly different from zero in parsimonious logistic regression analyses relating M. avium disease incidence to social and environmental predictors, where controls were selected at random from the Lower Super Output Areas in northern England

Mean deviance decline and standard deviation given for all models.
Mean and 95% confidence intervals (CI) for the empirical P values for the 1000 regressions.
DISCUSSION
The absence of clustering in space and time for cases of M. malmoense and adult cases of M. avium suggests that the incidence of these diseases is effectively random in time and space. There are two possible explanations for this. First, the data may have been inadequate in that they might not have represented the true picture of the incidence of disease in the region studied. Detection of cases of both diseases is difficult and so there may have been under-recording for both mycobacteria as noted elsewhere [Reference Lamden3, Reference Henry20]. Furthermore, if there was a temporal or spatial trend in under-recording then this would also have impacted on the detection of clustering [Reference Rowlingson and Diggle16]. Second, the absence of clustering in adult cases for both mycobacteria may simply indicate that infection is random [Reference Falkinham, Pedley, Bartram, Rees, Dufour and Cotruvo21].
The results suggest that clustering occurred in juvenile cases of M. avium over a range of scales but peaked at a time interval of 100–200 days and 2500 m between cases. There are three possible explanations for this pattern. First, is that the clustering may simply represent underlying clustering in the population at risk. If this were the case then one would expect a significant negative relationship between the size of the SOA in which cases were found and disease incidence (since the size of SOA is defined on the basis of population density and small SOAs are inevitably clustered in urban areas). No such relationship was found for either adults or juvenile cases of either disease. The second explanation is that there is a factor which predisposes for disease which has a spatial and temporal pattern. M. avium, in particular, is widely distributed in the environment and in wildlife [Reference Biet22]. Ingestion of contaminated water sources and contaminated swimming pools are believed to be routes by which children become infected [Reference Falkinham2] and a cluster in immunocompromised patients was traced to a hospital water supply [Reference von Reyn23]. Clustering in M. ulcerans infections in Ghana also arises because of spatial pattern in the distribution of arsenic in the soil [Reference Duker, Carranza and Hale24], which predisposes for infection. One possible environmental factor that could show spatial structure or pattern is the water source used for domestic consumption. M. avium incidence in the United States is related to the pH of potable water resources, being higher in areas of low pH soils [Reference Brooks25]. Analysis of soil pH was not possible in the present study because many of the SOAs were in urban environments where soil is disturbed, mixed and highly heterogeneous. Furthermore, the water supplies of much of the study area are not as localized as those in the United States with water for the conurbations coming from considerable distances away. The second explanation is that the disease is contagious in the juvenile age group. In this context a peak of clustering at 200 days and 2000 m is then suggestive of the period and spatial domain of contact, infection and subsequent detection of symptoms in the host. A spatial domain of 2000 m could reflect contact patterns amongst children attending nursery or educational establishments. One possible unmeasured factor that may influence the incidence of disease is the ethnicity of the cases, but previous studies have demonstrated that there is no link between incidence of non-tuberculous infections and ethnicity [Reference Bailey and Gatrell19, Reference Goldman26]. We conclude that the clustering amongst juvenile cases represents a contagious disease or some unmeasured environmental risk factor with spatial pattern.
The relationship between incidence of M. avium in adults and measures of social deprivation has been recorded before [Reference Bailey and Gatrell19] although a similar association was not found in mycobacterial pulmonary disease cases in Scotland [Reference Bollert27]. Whilst the link appears clear, the amount of variation explained by the models was low, suggesting that the deprivation and rainfall predictors were not good variables for explaining the incidence of disease. It is likely that both variables were rather crude predictors; their spatial resolution was certainly crude relative to the level of the individual case of disease. Cases were not only rare amongst SOAs as a whole but where they did occur they constituted one case in a population of ∼1500. It is also probable that there are other unmeasured factors such as the incidence of other diseases like HIV infection that should have been included as explanatory variables (although HIV is unlikely to be a major factor in this study since the modal age of the adult cases was 65 years). It is obvious that health and social deprivation were surrogates for the real mechanisms causing disease, with deprivation reflecting factors that lead to an increased environmental load of M. avium and hence increased risk of exposure and infection. M. avium has been associated with damp and mouldy buildings [Reference Falkinham, Pedley, Bartram, Rees, Dufour and Cotruvo21]. The weak association with high rainfall, might be explained in terms of increased aerolization of mycobacteria and enhanced exposure to infection in wetter areas. It is also possible that deprivation and its close association with lower social status reflects an industrial cause, since exposure to particles and smoking lead to other conditions that predispose for disease [Reference Falkinham2]. Finally, it is also possible that adult cases of disease were simply a resurgence of the disease in adults that had become infected in their youth. Resurgence could be associated with a decline in health in old age that is also likely to be faster amongst lower social groups that typically live in areas of greater deprivation. This last effect may also explain why the amount of variation explained by the GLMs was low, since disease would only then be recorded in a comparatively small number of individuals amongst the population as a whole that had become infected whilst young, who also went on to suffer deprivation and then recrudescence in later life. This is effectively a progressively smaller cohort, through time, of the overall population initially exposed to the disease. On this basis it seems likely that further advances in understanding the link between environment and disease incidence will only be made when individual life-history data can be collected rather than snapshot measures of environmental predictors taken at the time of case recognition. A prospective study involving collation of socioeconomic and life-long potential exposure to environmental risk factors is one way in which this last hypothesis could be tested.
The results presented here suggest that incidence of atypical mycobacterial disease is not easily explained in terms of environmental and social predictors, giving further support to the theory that infection is to some extent opportunistic. More interestingly, the results suggest that the epidemiology of disease in adults and juveniles, corresponding to pulmonary and cervical lymphadenitis, is different. If the hypothesis that cumulative exposure to predisposing factors is valid then this also suggests that public health management of both diseases should be different and targeted at monitoring groups at risk.
DECLARATION OF INTEREST
None.


