INTRODUCTION
Alzheimer disease (AD) has an insidious onset that goes unrecognized in the earliest stages. Mild cognitive impairment (MCI) often represents an early transition stage between normal functioning and dementia and refers to cognitive impairment greater than expected for age but without meeting criteria for a dementia diagnosis (Winblad et al., 2004). MCI would be expected to have an insidious onset as well. The purpose of this project was to understand how the trajectories of performance on cognitive tests in those who develop MCI differ from those who maintain cognitive function.
Longitudinal studies of preclinical dementia and MCI have reported changes in cognitive domains before the onset of AD and the usefulness of these changes in predicting dementia (Twamley et al., 2006). Study procedures have varied, including the length of follow-up before dementia diagnosis and statistical analyses. In general, these studies have not been able to systematically address when the changes occur in the development of MCI and have not addressed when a subject destined to develop MCI starts to diverge from the normal aging trajectory.
One of the earliest areas of cognitive decline in MCI commonly thought to precede dementia is impairment in learning and retaining new information (Albert et al., 2007; Bondi et al., 1999; Petersen et al., 1999). This state is termed amnestic MCI (Winblad et al., 2004) when other nonmemory cognitive functions are essentially preserved, although mild decline may be observed in these other areas (Devanand et al., 1997; Grundman et al., 2004; Twamley et al., 2006). In their study, Devanand and colleagues found that low scores on delayed recall, category naming for animals, and the Wechsler Adult Intelligence Scale-Revised (WAIS-R; Wechsler, 1981) Digit Symbol, Picture Arrangement, and Block Design subtests were predictive of diagnosis of dementia 2 to 3 years later.
This study provides a comprehensive look at how several cognitive domains change in normal elderly before developing MCI and how the change differs from normal aging. Based on our previous work showing that performance on a story recall task was a predictor of later development of persistent cognitive decline (Marquis et al., 2002), we hypothesized that MCI could be detected by neuropsychological examination before everyday cognitive problems were apparent. We also hypothesized that the trajectory of cognitive decline from normal aging to onset of MCI would not be linear because the insidious onset of MCI would cause accelerated decline before diagnosis. Longitudinal statistical methodology was used to model the aging process in those with and without an MCI diagnosis during follow-up to model the rate of change relative to the age of MCI onset.
METHOD
Participants
Subjects were participants in the Oregon Brain Aging Study (OBAS), which is a longitudinal study of healthy elderly ages 65 to 110 begun in 1989, and procedures have been described elsewhere (Howieson et al., 1993; Kaye et al., 1994). In brief, at entry, all subjects were community dwelling, functionally independent adults, free of comorbid conditions commonly associated with cognitive decline (e.g., stroke, heart disease, hypertension, cancer, diabetes, and neurological disorders). Participants were well-educated elders with a mean age of 83 years and were Caucasian except for one each Native American, Latino, and Asian. All subjects were cognitively intact at baseline and had a Clinical Dementia Ratings (CDRs) of 0. Recruitment and procedures were in compliance with the Helsinki Declaration for human research. Attrition, other than through death, was 7%.
Procedures
All subjects had neuropsychological and neurological evaluations and a brain magnetic resonance imaging (MRI) scan at entry, and these examinations were repeated annually. Continuous recruitment resulted in differing lengths of follow-up across subjects. The youngest age of onset of cognitive decline in our participants was approximately 75 years, so data were analyzed from participants 75 years and older who had at least three follow-up observations for the five cognitive outcomes. This process resulted in 156 subjects of the original 216 in the cohort. At 6-month intervals, cognitive screening and CDR (Morris, 1993) scores were obtained. CDRs are based on interviews and examinations of participants and interviews of collateral sources about participants' memory and ability to carry out daily activities. Rating scores range from 0 (intact), 0.5 (questionable dementia), 1 (mild dementia), and above. In our study, participants' interviews and examinations were conducted by neurologists, neurology fellows, and a geriatric nurse practitioner. Participants were queried about their memory and ability to carry out daily activities and were cognitively screened with the Cognistat (Kiernan et al., 1995) and the Mini-Mental State Examination (Folstein et al., 1975), for which a score of less than 24 was considered impaired. Research assistants performed interviews of collateral sources, most of whom were family members and a few were friends, neighbors, or care staff. Data from neuropsychological examinations were not used for CDR classification to avoid circularity in diagnosis and predictions.
In our subjects, a CDR > 0 represented a mild cognitive decline in subjects since their entry into the project. MCI was defined by at least two consecutive CDRs ≥ 0.5 to minimize the likelihood of measuring a transient or reversible decline. No subjects had significant functional decline (CDR functional boxes = 0). The age of onset of cognitive impairment was established as the age of the subject at the first of the two consecutive observations with a CDR ≥ 0.5. Some participants classified as Intact had one or more nonconsecutive (i.e., transient) CDRs = 0.5.
The cognitive measures of interest were as follows: (1) the Wechsler Memory Scale (WMS; Wechsler, 1987, 1997) Logical Memory I and II Story A; (2) category fluency for animals (Rosen, 1980); and (3) the Wechsler Adult Intelligence Scale-Revised (Wechsler, 1981) Block Design. Logical Memory Story B was administered with Story A, but Story B data could not be analyzed because the story changed when we switched from the WMS-R to the WMS-III during the longitudinal study. These tests were chosen because they were the most consistently administered during the longitudinal project and represented diverse domains.
Analyses
For each of the four measures, a separate longitudinal mixed effects model with a change point (Hall et al., 2000) was used to simultaneously estimate the annual rates of change of raw test scores for those remaining cognitively intact during follow-up and those diagnosed with MCI during follow-up. A “change point” is the time when the baseline rate of cognitive performance changes, in this case when cognitive decline begins to accelerate in those destined to develop MCI compared to their normal annual rate of change.
After various exploratory models were fitted, a linear model was determined to best fit the data. This linear model produced estimates of three annual rates of change: (1) a rate for those remaining cognitively intact during follow-up, representing an age-related change, (2) an age-related rate of change for those diagnosed with MCI during follow-up, and (3) an additional rate of change in temporal relation to clinical diagnosis with MCI (rather than just age). Rates 1 and 2 are what one would obtain when fitting a longitudinal regression model of the age progression of an outcome for two groups of subjects with differing annual rates of change. Rate 3 is a rate of change that is specific to time of diagnosis, instead of the age of the subject. In this analysis, we were interested in determining whether the annual rates of change did indeed change relative to diagnosis and we were interested in determining at what point in time this change occurred. More specifically, we were interested in estimating whether rate 3 is significantly different from zero and we were interested in defining the location of the change point relative to MCI diagnosis. All slope estimates are population based estimates and can be interpreted as the average annual rate of change.
To test our hypotheses, the linear mixed effects model included an interaction term to test whether the annual rate of change in a cognitive measure differed between those diagnosed and not diagnosed with MCI during follow-up. For those diagnosed with MCI during follow-up, a second component in the mixed effects model estimated the annual rate of change on the disease time scale instead of the age time scale. In other words, the time scale of the part of the statistical model was measured in years before and after diagnosis from MCI instead of age.
The time that the rate of cognitive decline changed relative to clinical diagnosis, that is, the location of the change point, was estimated by fitting different mixed effects models where the change point was fixed at 0.1 time intervals from −6 years to +3 years from diagnosis. The model with the highest partial likelihood (i.e., the model that best represented the data) defined the location of the change point. For example, if the model with a change point at 2 years before diagnosis resulted in the highest partial likelihood, the estimate of the change point was 2 years and statistical testing was performed on the estimates from this model. A 95% confidence interval around the location of the change point was calculated by a likelihood ratio approach. The significance (i.e., the presence) of a change point was determined by testing whether the third rate (defined above) differed from zero using a Wald test statistic (Casella and Berger, 2001). This statistic was also used to test of significance of the other parameters in the model. The standard errors for the parameter estimates were calculated using the conditional variance as proposed by Hall et al. (2000). The final models were adjusted for gender and socioeconomic status. Significance was taken as p < .05. A more detailed description of the change point model is presented in the Appendix.
RESULTS
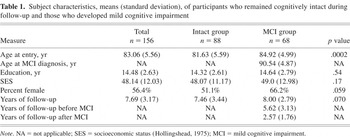
Sample characteristics and years of observations are presented in Table 1. At baseline, subjects who were diagnosed MCI during follow-up were 3 years older than those who remained cognitively stable. Socioeconomic status and education were similar for the two groups and slightly more women were in the MCI group. The follow-up averaged 7.69 years and was not statistically different between groups.
Subject characteristics, means (standard deviation), of participants who remained cognitively intact during follow-up and those who developed mild cognitive impairment

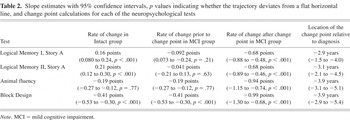
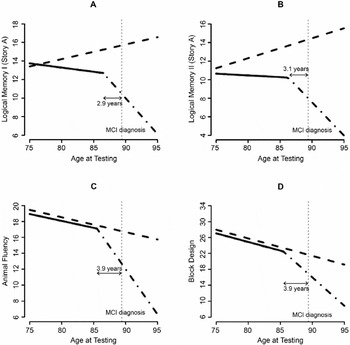
Table 2 summarizes the estimated annual rates of change for each measure for those with and without MCI diagnosed during follow up. Table 2 also presents the estimated location of the change point for each measure and the estimated acceleration in the annual rates of change after the change point. The slight variations in change points across tests were not significantly different. Figure 1 illustrates the average trajectories of each of the four outcomes for subjects diagnosed with MCI at age 89.6, which was close to the mean conversion time for the group.
Slope estimates with 95% confidence intervals, p values indicating whether the trajectory deviates from a flat horizontal line, and change point calculations for each of the neuropsychological tests


Estimated differing trajectories of cognitive performance between the Intact group (dashed line) and the group that develops mild cognitive impairment (MCI; solid/broken lines). Logical Memory I (A), Logical Memory II (B), Animal Fluency (C), and Block Design (D) raw scores.
Logical Memory I, Figure 1A
There is a difference in annual age-related change between clinically intact subjects and subjects who developed MCI before a change point (p = .003). Clinically intact subjects are increasing an average of 0.16 points per year (p < .001), while the subjects destined to be diagnosed are not showing this practice effect before the change point (p = .21). The group that developed MCI exhibits a significant accelerated decline in recall 2.9 years (p < .001) before diagnosis. When a subject gets within 2.9 years of diagnosis with MCI, there is an additional annual decrease of 0.68 points per year (p < .001); thus, the subjects who develop MCI are significantly declining after the change point.
Logical Memory II, Figure 1B
As with Logical Memory I, those diagnosed with MCI during follow-up have a different annual change in Logical Memory II performance before a change point compared to intact subjects (p = .008). Intact subjects' recall increases an average of 0.21 points per year (p < .001) compared to those destined to be diagnosed with MCI, who have an insignificant annual decline of 0.041 points per year (p = .63). At approximately 3.1 years before diagnosis with MCI, there is a significant change when the rate of decline increases by 0.68 points per year (p < .001).
Animal Fluency, Figure 1C
The animal fluency score decreases approximately 0.19 units per year (p < .001). This rate of change is similar between those who developed MCI and those who remained intact (p = .77) until approximately 3.9 years before clinical diagnosis. At approximately 3.9 years before diagnosis of MCI, the annual decrease in the score accelerates by 0.94 points (p < .001).
Block Design, Figure 1D
The Block Design score decreases approximately 0.41 points (p < .001) per year. This annual rate of change is similar between those who develop MCI and clinically normal subjects (p = .93) until approximately 3.9 years before the clinical diagnosis of MCI. At this time the annual rate of decline in Block Design scores accelerates by 0.99 points (p < .001).
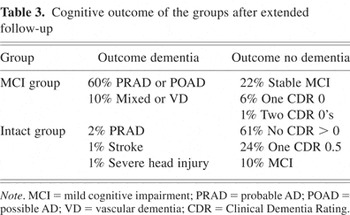
The CDR used to diagnose MCI had good predictive value. Using this approach, 95% of the Intact group remained nondemented for an extended follow-up beyond the original data set (see Table 3). In the MCI group, 70% developed a diagnosis of dementia during 5.1 years of follow-up after MCI diagnosis. Of the remaining MCI subjects, 22% had stable MCI at 3.3 years after diagnosis, and five back-converted by having one or two CDRs of 0 during 4.0 years after MCI diagnosis.
Cognitive outcome of the groups after extended follow-up

During extended follow-up, a clinical diagnosis of probable or possible AD occurred in 85% of those who developed dementia and in 59% of the entire MCI group. To assess the effect of having a heterogeneous population, the above analysis was performed excluding subjects with other than an AD diagnosis. When the change point analysis is repeated deleting participants with other dementia or nondementia diagnoses, the results remain essentially the same with small indications that the change point is slightly earlier in time in those that develop AD. For example, the change point for Logical Memory II is approximately 4.0 years (95% confidence interval: 3, 5.4 years) before onset (p < .001). The change points are estimated at 3.2 years for Logical Memory I, 5.0 years for animal fluency, and 4.0 years for Block Design. The accelerations in the annual rates of change were similar for both analyses. These data suggest that the MCI subjects who developed AD during follow-up were the ones showing the greatest cognitive decline.
DISCUSSION
The change point analysis showed that MCI has a preclinical stage of accelerated cognitive loss, which can be observed 3 to 4 years before the diagnosis of MCI on tests of verbal memory, animal fluency, and visuospatial constructions. Therefore, the development of MCI is not necessarily a slow steady decline. Our results extend the findings of Hall et al. (2000), who showed that rate of memory decline accelerates years before a diagnosis of AD, to show accelerated memory decline before MCI. The findings are also consistent with those of Amieva et al. (2005), who found an accelerated rate of memory decline, in this case on a visuospatial memory recognition test, in highly educated subjects approximately 3 years before a diagnosis AD.
Although some studies find that MCI patients at most risk for dementia have only memory impairment, amnestic MCI, we also found accelerated cognitive decline in two nonmemory measures. Category fluency showed a significant decline before diagnosis of MCI. This result augments the findings of some cross-sectional studies that have shown a decline in category fluency in patients diagnosed with MCI (Grundman et al., 2004; Hodges et al., 2006). Block Design performance also showed accelerated decline before diagnosis of MCI, a finding consistent with the longitudinal study of Storandt et al. (2006) in which pre-MCI elders had a rate of decline on visuospatial tasks greater than intact individuals. In their study, only 30% of MCI patients had memory impairment alone. We believe that the examination of learning and retention of new information is critical for early detection of the commonest form of MCI and that examination of category fluency and visuospatial constructions may also be useful.
One might note that, because the change point is a number of years before diagnosis and some of our Intact participants had transient CDRs = 0.5, some of our subjects may be misclassified as clinically normal. Because these subjects should be behaving like the MCI subjects, the difference between the groups should be attenuated and our results conservative.
The lack of a practice effect on the memory test for subjects who eventually developed MCI differentiated the groups before the change point and was the earliest sign of cognitive impairment. This separation between groups suggests that individuals destined to develop MCI likely diverge from cognitively intact elders before the change point found in this analysis. The lack of improvement upon retesting has been noted by others as a diagnostically useful finding (Cooper et al., 2004).
Some people develop a period of stability after the development of MCI (Howieson et al., 2003; Smith et al., 2007; Twamley et al., 2006). A subgroup of 15 (22%) of our participants remained stable for an average of 4.0 years after the diagnosis of MCI. A study of stable MCI individuals may provide important clues about factors that avert progression of dementia (Simonsen et al., 2007; Smith et al., 2007).
The cognitive findings in this study complement the trajectory of accelerated brain atrophy seen years before the diagnosis of MCI shown in recent analysis of neuroimaging data in this cohort (Carlson et al., 2007). Although the subjects with MRI data were a subset of those in this analysis, the findings from the MRI and Logical Memory data were consistent. That is, analysis of the MRI volumes showed an annual rate of ventricular volume that accumulated faster in subjects destined to develop cognitive impairment compared to cognitively intact subjects, and the rate of increase of ventricular volume accelerated even faster at least 2 years before clinical diagnosis of MCI.
We agree with Storandt et al. (2006) that it is possible to identify AD at an even earlier stage than MCI by focusing on change within the individual rather than comparison with group norms. The underlying neuropathological processes that precede or accompany the accelerated cognitive decline in MCI are unknown, although several processes have been suggested (Carlson et al., 2007). Our data suggest that the change point in the MCI participants represents a stage of very early cognitive decline associated with AD. The finding has both research and clinical applications. It is of research interest to identify individuals in the earliest clinical phase of AD to learn when this occurs and to test potential disease modifying drugs. To be truly effective, it is likely that these drugs will need to be administered before irreparable neuronal damage has occurred. The approach of measuring rates of change in cognition with neuropsychological evaluations also can be useful for monitoring at-risk individuals, such as those with a genetic predisposition (Saunders, 2000). It is impractical to provide frequent neuropsychological evaluations of a large proportion of asymptomatic elders. In the future, frequent in-home monitoring, which could be available to a broad segment of the population, may provide sensitive methods for detecting markers for cognitive decline (Hayes et al., 2004).
The change point analysis has limitations. It takes large samples and long-term follow-up of participants to collect sufficient observations to model nonlinear changes. Large within subject variations limit the ability to accurately iden?.tify change points for each individual. Longer follow-up might allow for better characterization of the clinical course of MCI and the possibility of more than one change point. It is also likely that the change in rates is not as abrupt as is visually presented in this analysis. Using annual data does allow us to determine the annual rate of change as one approaches clinical diagnosis with MCI, but we are not able to model a more complex trajectory of change at the weekly or even monthly time scale using annual data. Data collected at frequent intervals may help identify more exactly the transition between the two rates observed in this analysis. A small number of neuropsychological tests were available for analysis. It is possible that cognitive functions not examined in this study, such as visual memory and executive functions, might also have shown accelerated decline. Another limitation of our study is that most of the participants did not have a neuropathological diagnosis, although the clinical–pathological agreement in our center is high.
ACKNOWLEDGMENTS
Supported by grants from: National Institutes of Health (MO1 RR00334); National Institute of Aging (P30 AG008017); Office of Research & Development, Clinical Sciences Research & Development Service, Department of Veteran Affairs. Preliminary reports were presented at the 35th Annual Meeting of the International Neuropsychological Society in Portland, OR on February 9, 2007 and the 59th Annual Meeting of the American Academy of Neurology in Boston, MA on May 2, 2007. The authors thank the Oregon Brain Aging Study volunteers, Robin Guariglia for database management, and the Layton Aging & Alzheimer Research staff.
APPENDIX: THE CHANGE POINT MODEL
Mixed effects models are a combination of population- and subject-specific (random effects) components. We defined the following population model in this analysis:

Yij is the neuropsychological test score for subject i at time j. MCIi is 1 if subject i is diagnosed with MCI during follow-up and 0 otherwise. Ageij is the age in years of subject i at time j. Age of onseti is the ith subject's age of diagnosis with MCI in years. The location of the change point is τ. The model error term is eij. The parameters of interest in this analysis can be interpreted as follows: β2 = the average annual rate of change in test score for those who do not develop MCI during follow-up, β2 + β3 = the average annual rate of change for those who develop MCI during follow-up and are more than τ years before diagnosis with MCI, β2 + β3 + β4 = the average τ years before diagnosis with MCI. From these definitions of the model, one can see how the annual rate of change for those diagnosed with MCI changes at τ years before diagnosis with MCI.
Estimation: In the simplest change point setting, the data on a subject are essentially divided into two segments: (1) data collected before the hypothesized change point and (2) data after the hypothesized change point. Two different regression lines are fitted on all the subjects' data before and after the change point and then statistically tested as to whether the slopes of the regression lines differ. In the simplest of settings the presence and location of a change point is known and the time scale is similar for all subjects. In the setting presented in this paper, we needed to incorporate the effect of age and time to diagnosis in the analysis. In addition, the presence and location of a change point was unknown. Therefore, the estimation differs from the more simple procedure described above to account for the added complexities of this analysis.
Finally, we note that additional random effects were included for the intercept to account for the correlation that exists between observations on the same subject, and for the annual age-related change, to account for the variation in age-related annual changes that is observed across subjects.


