1. Introduction
Numerous studies have shown that glacier mass balance is very sensitive to air temperature and is a suitable parameter for climate-change detection (e.g. Reference KuhnKuhn, 1981; Reference Greuell and OerlemansGreuell and Oerlemans, 1986; Reference Oerlemans and FortuinOerlemans and Fortuin, 1992; Reference Ohmura, Kasser and FunkOhmura and others, 1992). However, series of mass-balance observations are not very long: all systematic mass-balance programs started after 1945 (Reference Haeberli, Bosch, Scherler, Østrem and WallénHaeberli and others, 1989). Concerning glacier length there is much more information. Glacier length is an interesting proxy for climate change on the decadal-to-century time-scale. Short-term fluctuations are damped and the long-term signal becomes clearly visible, albeit delayed by the response time of the glacier (e.g. Reference NyeNye, 1960,Reference Nye1965; Reference Budd and JenssenBudd and Jenssen, 1975; Reference KrussKruss, 1983; Reference Stroeven, van deWal, Oerlemans and OerlemansStroeven and others, 1989; Reference Van de Wal and OerlemansVan de Wal and Oerlemans, 1995). However, like all proxy climate records, the signal contains noise. It is known from observations that the interannual variability of the mass balance is large. The year-to-year changes are caused by more-or-less random fluctuations in the weather that have little to do with climate change. The annual balance can be regarded as white-noise forcing that may lead to significant variations in glacier length on longer timescales. Suppose that the mean climatic state has not changed during the last 10 000 years and that, for a particular glacier, the interannual variability of glacier mass balance has been constant and equal to the present-day variance. How large then is the probability that the observed retreat over the last 100 or 200 years isjust by chance?
If glaciers were linearly damped systems, the power spectrum of the response would be red (Reference HasselmannHasselmann, 1976). But glaciers are not linear, and it seems appropriate to study the issue with flowline models that take into account the geometric peculiarities of individual glaciers. In this paper I present the results of some long integrations for Nigardsbreen, Norway; Rhonegletscher, Switzerland; and Franz Josef Glacier, New Zealand. These glaciers are interesting because they are not too small, have long length records (Fig. 1) and are in different parts of the world. The models available for these glaciers are reasonably well calibrated, although the mass-balance profile used for Franz Josef Glacier had to be taken from energy-balance modelling without backing from actual mass-balance observations (Reference OerlemansOerlemans, 1997a).
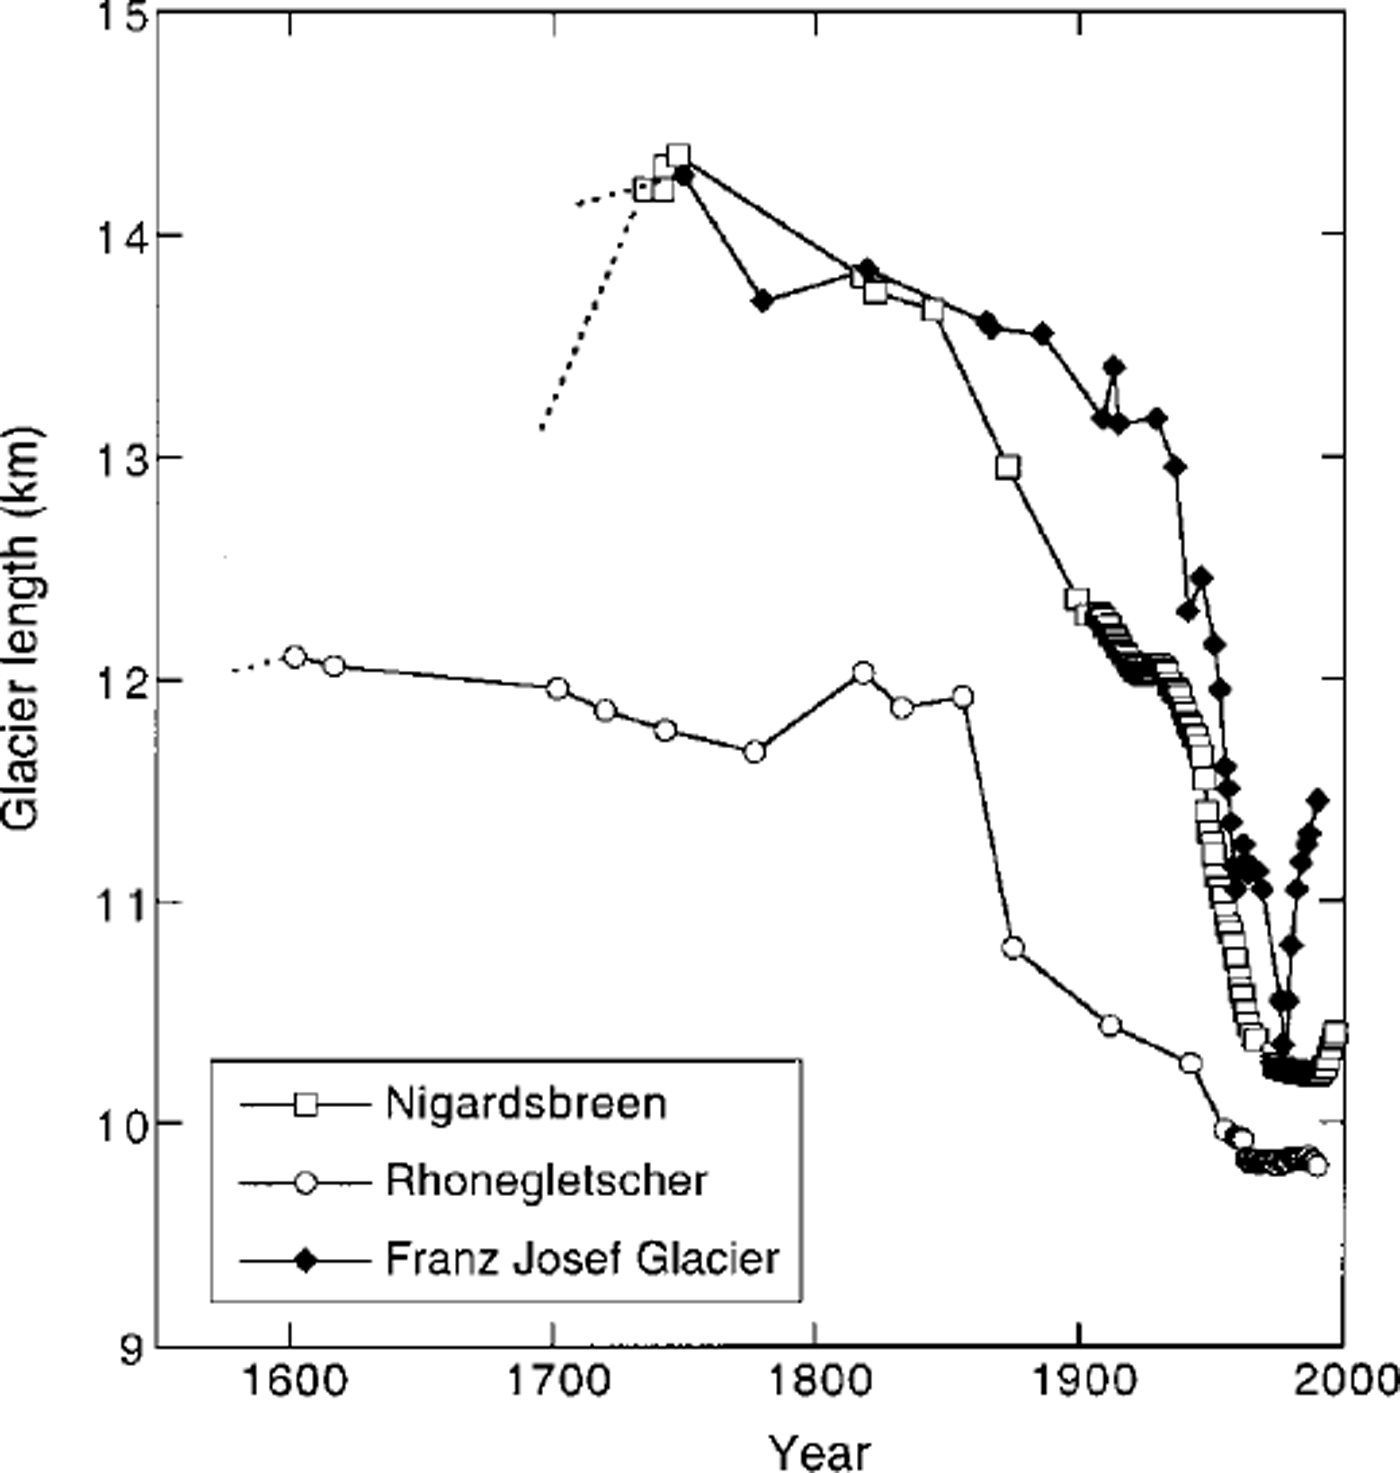
Fig. 1. Glacier lengthrecordsforMgardsbreen,Rhonegletscherand Franz Josef Glacier. Data from the World Glacier Monitoring Service (http://www.geo.unizh.ch/wgrns/), with some additions.
The purpose of this paper is to demonstrate that glaciers may fluctuate on a decadal-to-century time-scale as a response to short-term random forcing. An attempt is also made to determine the magnitude of such fluctuations and to compare this with the observed length records over the past few centuries.
2. Glaciers Studied
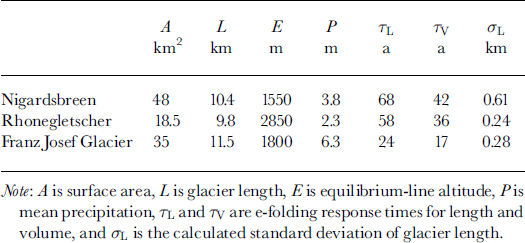
Some basic properties of the glaciers studied in this paper are given in Table 1 and Figure 2. Nigardsbreen is located in southern Norway and has been well studied. It is the only glacier in the world having a length record extending back to the 18th century as well as a long series of mass-balance observations (from 1962 onwards), and is therefore a very interesting target for numerical modeling (Reference OerlemansOerlemans, 1986, Reference Oerlemans1997b). The climate in southern Norway is wet and temperate. Even the highest parts of the glacier experience extensive melting in summer. On the snout, melting is not restricted to the summer: there is also considerable mass loss in spring and especially in fall. Precipitation occurs throughout the year, with a maximum in late summer and fall.
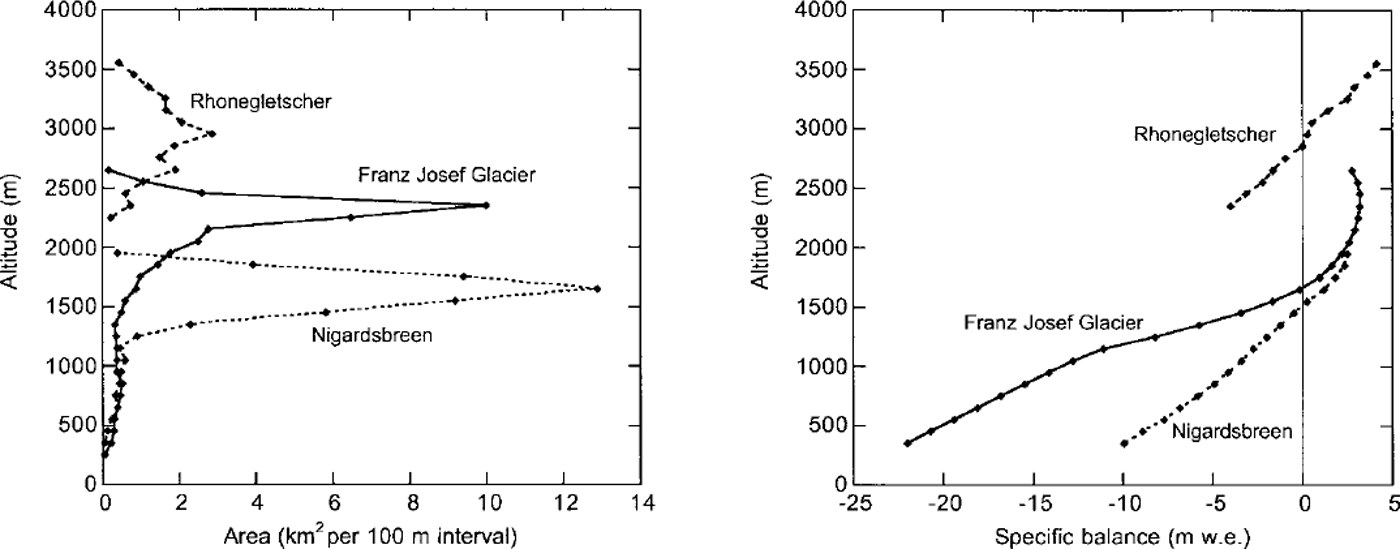
Fig. 2. Area-elevation distribution and mass-balance profiles for the glaciers studied. Data from the World Glacier Monitoring Service (http://www.geo.unizh.ch/wgms/) and Reference OerlemansOerlemans (1997a).
Table 1. Some characteristics of the glacier studied
Rhonegletscher has the longest length record of the three (Fig. 1). It is located in the central Alps and also receives a substantial amount of precipitation, especially in the higher parts. The hypsometry is very different from that of Nigardsbreen. The relative width of the ablation area is larger. The accumulation basin spans an altitudinal range of about 700 m and there is very little melting in the highest places.
Franz Josef Glacier, New Zealand, is a glacier with extreme mass turnover and a very small response time. The mean annual precipitation on the glacier is estimated to be 6.3 m. Melt rates on the lowest parts are of the order of 20 mw.e. (Reference OerlemansOerlemans, 1997a). The hypsometry is in some ways similar to that of Nigardsbreen, with a wide accumulation basin and a very narrow tongue, but it spans a larger altitudinal range.
3. Ice-Flow Model
The evolution of the glaciers is calculated with a flowline model, in which the three-dimensional geometry is parameterized. A prognostic equation follows from integration of the continuity equation over glacier depth and width, yielding:
where × is distance along the flowline, t is time, S is the area of the cross-section perpendicular to the flowline, U is the ice velocity along the flowline (averaged over S), w is the width of the glacier at the surface and B is the specific balance (averaged over the glacier width).
U is entirely determined by the local ˚driving stress" r, being proportional to the ice thickness H and surface slope ∂h/∂x (h is surface elevation). There is a contribution from simple shearing flow (Ud) and from sliding (Us). The following expression is used (Reference Budd, Keage and BlundyBudd and others, 1979; Reference OerlemansOerlemans, 1997b):
Although the sliding velocity depends on the water pressure, this is not explicitly dealt with. The bulk effect is supposed to be absorbed in the sliding parameter βs. The values of/, and /d suggested by Reference Budd, Keage and BlundyBudd and others, (1979), / d = 1.9 × l0–24 Pa–3 s–1 and / , = 5.7 × 10⁻²⁰ Pa–3 m2 s–1, are used for all glaciers. Shape factors are not included.
Choosing a shape for the cross-section enables Equation (1) to be written as a rate equation for ice thickness H. Substitution of Equation (2) then leads to the final prognostic model equation (not discussed here; see Reference OerlemansOerlemans, 1997b). Here a trapezoidal cross-section is used, having two degrees of freedom (glacier width at the bed and slope of the valley walls). All calculations are done on a grid with 100 m resolution, which is adequate for the glaciers considered.
The mass balance is formulated as
where B0(h) is the reference balance profile depending only on altitude (Fig. 2). It should be noted these balance profiles deviate from the balance profiles that would keep the present glaciers in steady state. The year-to-year fluctuations are denoted by B’(t). These are taken independent of altitude. In view of other uncertainties inherent in long integrations, this assumption is justified. C is a calibration constant, allowing the mean glacier length over a long time to be constrained to a given value. In fact, small values are assigned to C to make the observed neoglacial maximum length comparable to the maximum length generated in the long integrations with random forcing.
Input data and calibration of the flow models will not be discussed here, since these have been documented elsewhere (Nigardsbreen: Reference OerlemansOerlemans, 1997b; Rhonegletscher: Reference Wallinga and van de WalWallinga and Van deWal, 1998; Franz Josef Glacier: Reference OerlemansOerlemans, 1997a).
4. Mass-Balance Forging
The mass-balance perturbation B’{t) consists of two components: random forcing and a change linear in time associated with a prescribed long-term temperature change.
We first discuss the random forcing. A simple approach is taken, in which year-to-year perturbations are assumed to be uncorrected (white noise). The white noise has a Gaussian distribution with a prescribed standard deviation σSB. An estimate of σB can be obtained from mass-balance observations if it is assumed that
where subscript ˚Bm" is the mean specific balance. The mass-balance series for Nigardsbreen contains 36 data points (1962–97), yielding σB = 1.05 mwe. For Rhonegletscher, mass-balance data are too limited to estimate σB. However, a long series is available for Griesgletscher (1962–95), a glacier not too far away from Rhonegletscher and which has a similar climatic regime. The Griesgletscher record gives σB = 0.75 mwe., which will be used as the best estimate of the interannual variability for Rhonegletscher. No data are available for Franz Josef Glacier, but since it shares a similar climate with Nigardsbreen (in the heart of the westerlies) the same value of σB will be used. All the mass-balance data used can be found at the World Glacier Monitoring Service in Zürich (http://www.geo.unizh.ch/wgms/).
The relation between annual mean air temperature and mean specific balance for these glaciers is obtained from energy-balance modelling (Reference OerlemansOerlemans, 1992; Reference Oerlemans and FortuinOerlemans and Fortuin, 1992). The calculations reported earlier have been repeated with more detailed meteorological input data. The seasonal sensitivity characteristic (SSC) calculated for these glaciers is shown in Figure 3. The SSC gives the change of the mean specific balance for monthly temperature and precipitation anomalies and provides insight into the climatic setting of the glaciers (Reference Oerlemans and ReichertOerlemans and Reichert, 2000). These have been derived by imposing a temperature perturbation of + 1K and precipitation perturbations of 10%. The SSCs for Nigardsbreen and Rhonegletscher are rather similar, except that changes in summer precipitation hardly affect Nigardsbreen’s balance but do so for Rhonegletscher. This is because the accumulation region of Rhonegletscher extends much further above the equilibrium line and receives some snow even in summer. The SSC for Franz Josef Glacier is peculiar in that even a temperature increase in the winter months has a strong negative effect on the balance, illustrating the extreme maritime character of this glacier.

Fig. 3. SSCs for the glaciers studied as obtained from energy-balance modelling
Annual totals for a 1 K temperature perturbation are –0.67, –0.41 and –1.2 mwe. per IK warming for Nigardsbreen, Rhonegletscher and Franz Josef Glacier, respectively. Calculations with a 1 K temperature change throughout the year give slightly (∼5%) larger values than summing-up of the monthly contributions. This is understandable since a temperature perturbation in one particular month affects the sensitivity of the following month. However, the effect appears to be small and is ignored here, and the values listed above are used.
5. Results
Figure 4 shows glacier length from 10 000 year integrations with white-noise forcing. The initial glacier length was set to zero and it takes several hundreds of years before the glacier size becomes comparable to the current size. The forcing is shown in the lower panel of the figure; each dot represents an annual value of σB. For Rhonegletscher the forcing is the same, but all values are adjusted to give σB = 0.75 mwe. (see discussion in section 4).
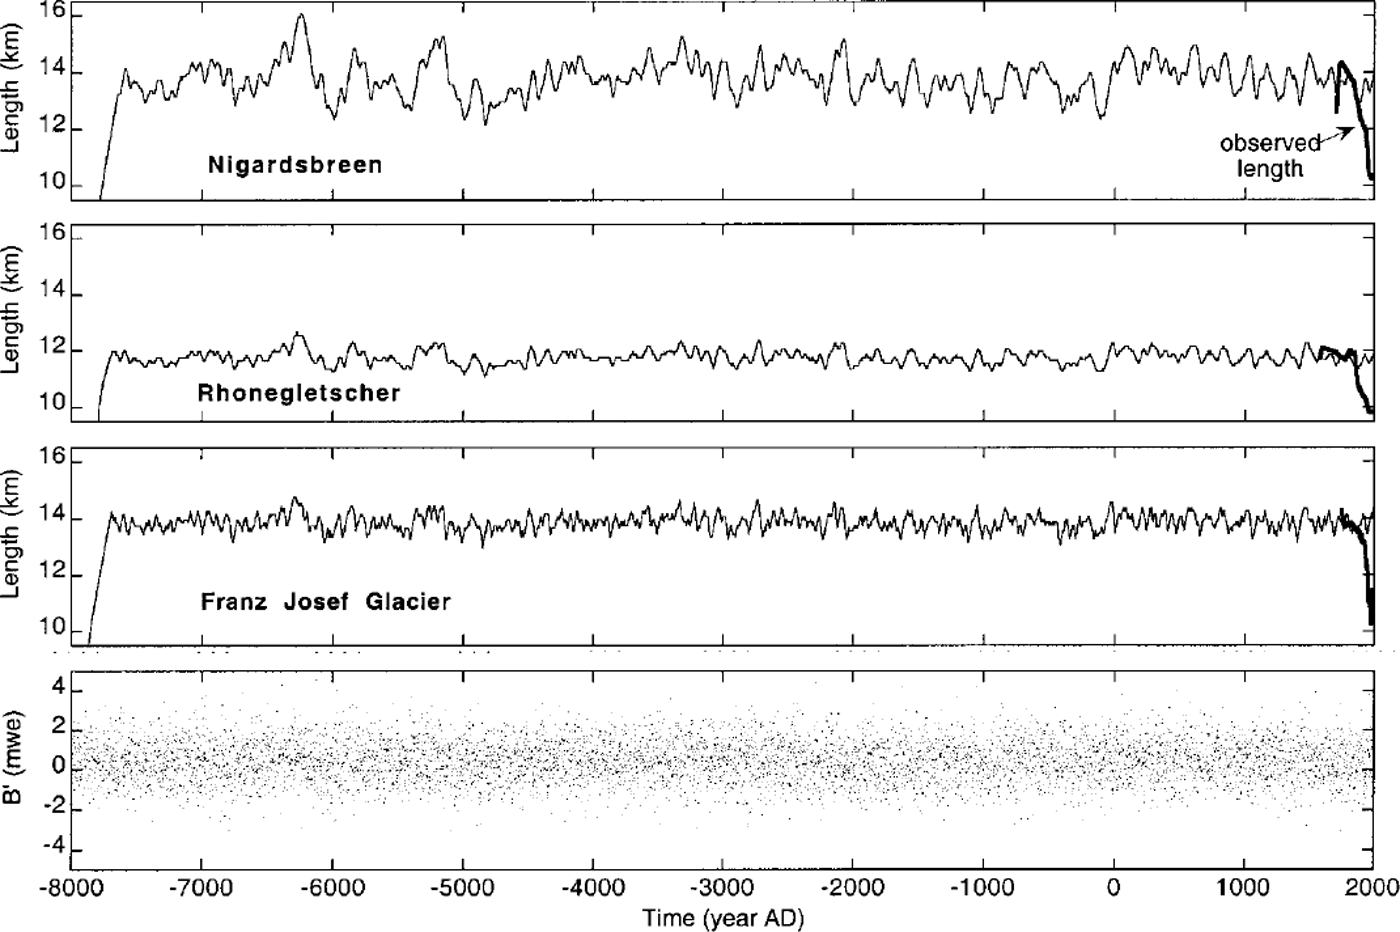
Fig. 4. Simulated glacier length for white-noiseforcing of the annual balance (B, lower panel). The heavily drawn curves show the observed length record. Note that vertical scales for the three glaciers are the same.
It is clear that the generated glacier-length fluctuations are of significant magnitude, especially for Nigardsbreen. In fact, in the curve for Nigardsbreen a retreat can twice be seen that has a magnitude comparable to what has been observed in the last two centuries. So the probability that the present retreat results from short-term internal variability is 4% (twice in 50 two-century periods, say). This is a very crude estimate without any refined statistics, but it provides a rough idea.
Fluctuations for the other glaciers are smaller. Nigardsbreen is extremely sensitive to mass-balance perturbations, because of its geometry. Rhonegletscher is less sensitive and the strength of the white noise is smaller, leading to smaller variability. Franz Josef Glacier is more sensitive, but the much smaller time-scale does not allow large deviations from the mean. For the period 8500 BC to AD 2000, the simulated standard deviations of glacier length are 0.61, 0.24 and 0.28 km for Nigardsbreen, Rhonegletscher and Franz Josef Glacier, respectively.
In the fictitious, perfectly constant Holocene climate, the probability that Nigardsbreen reached its postglacial maximum in not more than a few centuries is quite small. Given that most glaciers in the Northern Hemisphere reached a postglacial maximum only in recent times, the Holocene climate must have become gradually cooler, with not too large deviations from this trend. This probabilistic argument from glacier records supports other evidence of a warm Atlanticum with slow cooling afterwards in at least the mid- and high-latitude Northern Hemisphere (e.g. COHMAP members, 1988).
It is therefore interesting to look at 10 000 year integrations with white-noise forcing superposed on a cooling trend. A cooling of IK over 10 000 years, linear in time, was imposed. Precipitation was not changed (but the effect of a changing snow/rain fraction is implicit in the mass-balance model used). The corresponding values of B’(t) for the three glaciers are discussed in the previous section. The result for Nigardsbreen is shown in Figure 5. The original run is shown together with three other runs having the 1K cooling and different random forcing.
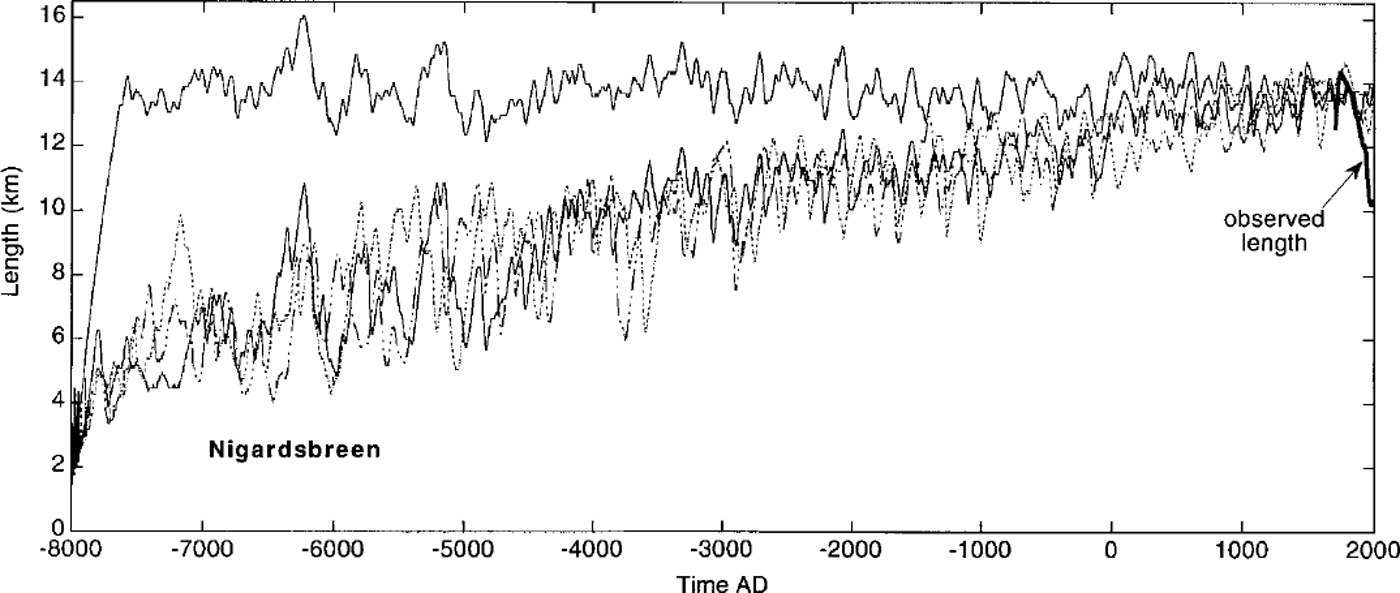
Fig. 5. Simulated glacier length of Nigardsbreen. The upper curve is the same as in Figure 4. The other curves show runs with a linear 1 K cooling imposed. The curves differ only because of different white-noise forcing (ofequal strength).
The difference between the runs with and without Holocene cooling turns out to be large. Again, this reflects the large sensitivity of Nigardsbreen. Especially in the 5–10 km range the variations in length generated by the white-noise forcing are impressive.
Similar integrations were done for Rhonegletscher and Franz Josef Glacier. In Figure 6, results are summarized for the last 3000 years. It is clear that the recent retreat of these glaciers should be considered a significant feature that cannot be explained as the result of random forcing on a small timescale. In the observations Nigardsbreen showed the largest retreat, but the signal-to-noise ratio is considerably smaller than for Rhonegletscher and Franz Josef Glacier.
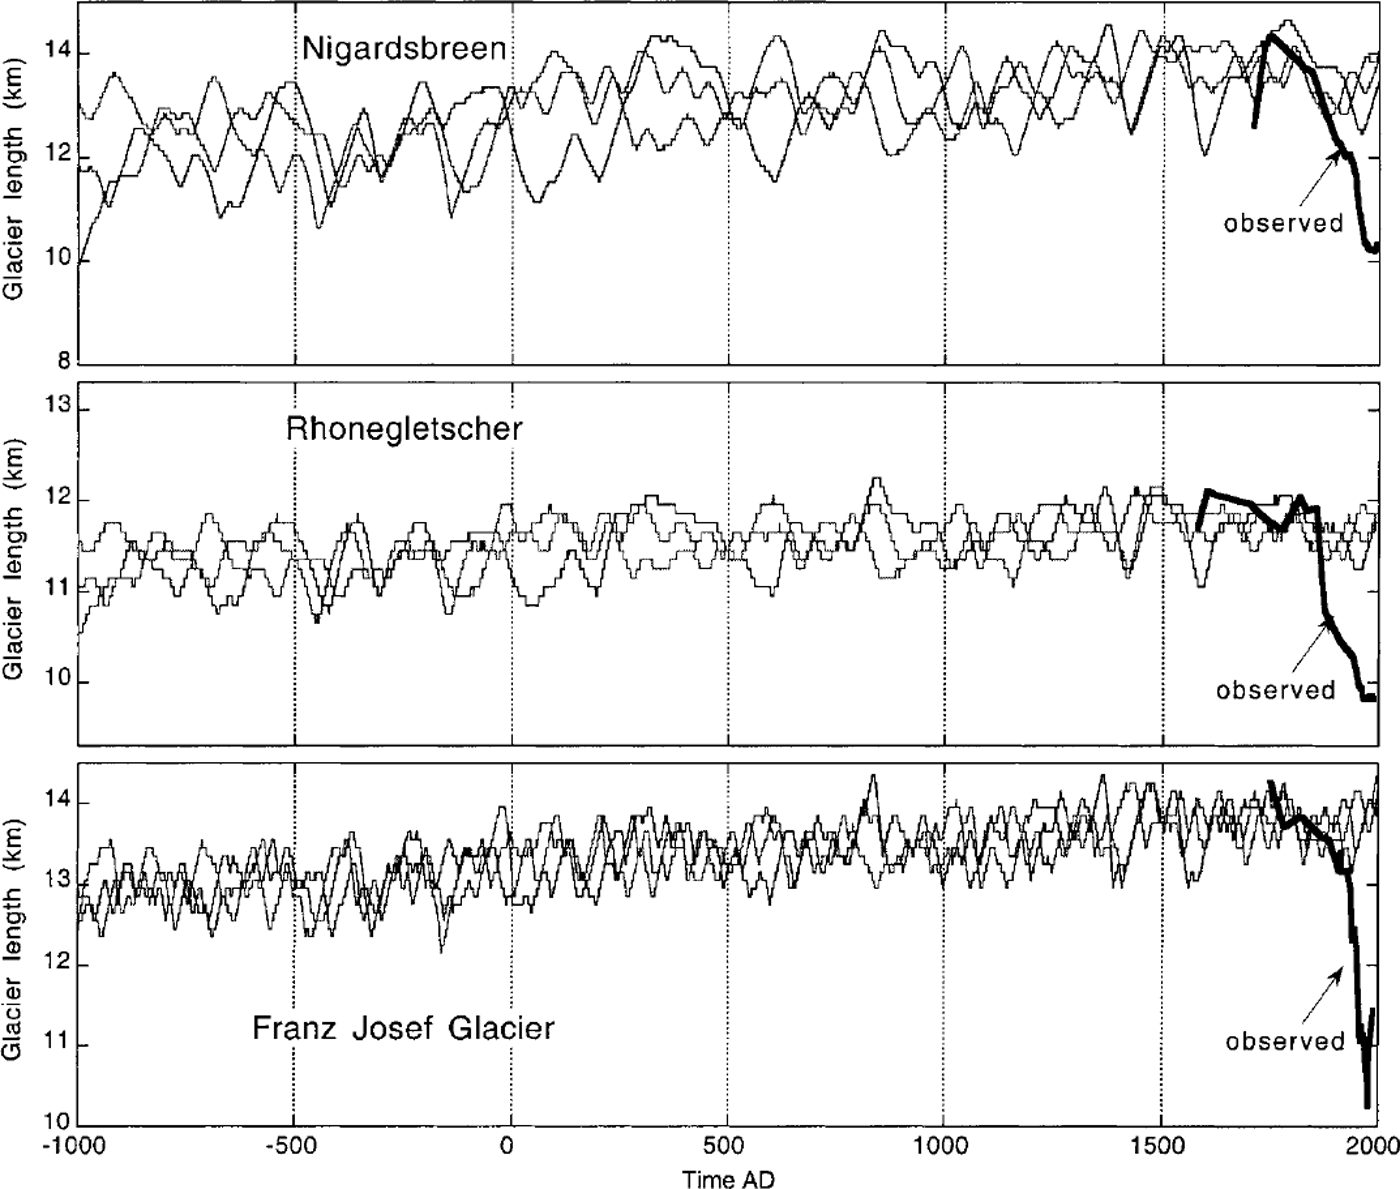
Fig. 6. Close-up of glacier length for the last 3000years, obtained with three different random series. In all runs a 1K Holocene cooling was imposed. Note that the vertical scales are different.
6. Epilogue
Following ideas long ago developed by Reference HasselmannHasselmann (1976), an attempt has been made in this paper to quantify the natural variability in glacier systems associated with short-term random forcing. From the numerical experiments with the glacier models it can be concluded that the interannual variability of the mean specific balance is capable of pushing glaciers far away from the equilibrium state. This ˚climate noise" obscures the signal associated with deterministic forcing on longer time-scales. However, the decrease in glacier length of the studied glaciers over the last few centuries appears too large to be attributed to natural variability It is likely that the current retreat of these glaciers reflects a response to external forcing on a century time-scale.
The method discussed here to quantify the strength of natural variability in glacier systems does not take into account all potential contributions. Glaciers may also exhibit internal variability not directly related to climate forcing. For surging glaciers this is clear, and they can hardly be used as climate indicators. Internal climatic variability on longer time-scales may also contribute to the forcing of glacier fluctuations. In the future the type of numerical experiments discussed here will be repeated with output from long integrations with coupled ocean-atmosphere climate models.
The significance of glacier retreat as a sign of exceptional warming is further enhanced by the coherence of the signal over the globe. Almost all larger valley glaciers have been retreating during the last one or two centuries (eg. Reference OerlemansOerlemans, 1994).
Finally one should not conclude that a significant level of natural variability makes glacier fluctuations less suitable for reconstructing or diagnosing climate change. In many other cases the system that translates forcing by meteorological quantities into a proxy has not been explicitly modeled and the level of natural variability is not known.


