Hostname: page-component-586b7cd67f-l7hp2 Total loading time: 0 Render date: 2024-11-30T15:45:38.786Z Has data issue: false hasContentIssue false

Friction drag model for axial turbulent flow along the surface of a circular cylinder based on the universal characteristics of wall turbulence

Published online by Cambridge University Press:  25 November 2024
Takashi Ohta*
Affiliation:
CFD Research Group, Department of Mechanical and System Engineering, University of Fukui, 3-9-1 Bunkyo, Fukui 910-8507, Japan
Futaro Shirahata
Affiliation:
CFD Research Group, Department of Mechanical and System Engineering, University of Fukui, 3-9-1 Bunkyo, Fukui 910-8507, Japan
*
Email address for correspondence: [email protected]

Abstract

The friction drag of the axial flow along the outer surface of a cylinder varies with the cylinder radius and flow conditions. This study included direct numerical simulations of the axial turbulent flow along a circular cylinder under different conditions for obtaining the turbulence statistics and wall friction coefficient. Then the characteristics of velocity streaks were observed from a geometrical perspective of turbulence structures around the circular cylinder, and compared with the characteristics of the turbulence structures in a boundary layer on a flat plate. The results showed that the velocity streak spacing and the distance between the velocity streak and the cylinder surface in the viscous length scale do not vary substantively with the radius of the cylinder, and are the same as those of the turbulent flow along a flat plate. Therefore, they can be considered geometrical characteristics of the turbulence structure independent of the cylinder radius. Moreover, the friction coefficient per pair of high- and low-speed velocity streaks is the same as that of flat-plate turbulent flow, independent of the cylinder radius, and can be regarded as a dynamical characteristic for a pair of velocity streaks. Two equations were derived based on the characteristics of wall turbulence. The characteristics of the turbulence predicted by the two formulae were consistent with the simulation results. Consequently, we showed that the wall friction coefficient and number of the velocity streak pairs, which are statistical and structural characteristics of wall turbulence, can be predicted appropriately by specifying the radius Reynolds number.

Type
JFM Papers
Copyright
© The Author(s), 2024. Published by Cambridge University Press

1. Introduction

Fluid flowing around a thin cylinder along its axial direction can become turbulent, even when the cylinder's radius of curvature is relatively low (Gould & Smith Reference Gould and Smith1980). In such a turbulent flow along a cylinder, streaky structures of the streamwise velocity fluctuation exist, which are similar to those of turbulent flow along a flat plate. However, in this turbulent state, the friction drag acting on a thin cylinder is 10–100 times larger than that on a flat plate, depending on the radius of the cylinder (Gould & Smith Reference Gould and Smith1980). This is because the turbulent flow along a wall with convex curvature transverse to the flow direction has a smaller area of the wall surface relative to the volume of the turbulent flow field, resulting in a larger drag per area. Notably, the turbulence is maintained in such cases, even though the area in which turbulence is generated is limited in flow along a thin circular cylinder because the surface area is small in relation to the volume of the flow field. In contrast to the case of flat-plate turbulent flow, the proportion of uniform flow in the flow field is large, and the area of shear flow is small. For example, the amount of friction drag acting on the yarn depends on the state of air flow around the yarn when considering the transport of fine yarns in a spinning machine. Therefore, the state of laminar or turbulent flow can change the energy efficiency concerning the driving force in the transport of yarns. Axial flow along a thin cylinder has been investigated with respect to the relationship between the sonar array diameter and the noise in a towed sonar (Potter et al. Reference Potter, Delaory, Constantin and Badiu2000; Tutty Reference Tutty2008; Jordan Reference Jordan2011b). Moreover, axial flow along a cylinder must be investigated from not only an engineering perspective but also an academic perspective to gain fundamental insights into turbulent phenomena. Nevertheless, few studies have investigated the turbulence present in the axial flow along a cylinder, and this system has received less attention compared to the flow along a flat plate.

Although many studies have focused on the flow in a direction perpendicular to the axis or inside a pipe, research on axial flow along the wall surface outside a cylindrical object in general is limited. For example, there are some studies that focused on the turbulent annular Poiseuille flow (Satake & Kawamura Reference Satake and Kawamura1995; Liu & Lu Reference Liu and Lu2004; Ishida, Duguet & Tsukahara Reference Ishida, Duguet and Tsukahara2016) to investigate the characteristics of the turbulence structures in flow with constrained circumferential periodicity along the convex wall surface around the inner cylinder. However, the results of these studies depend on a parameter related to the distance to the inner wall of the outer cylinder, which is different from the flow field assuming a yarn, which is the focus of our study. Glauert & Lighthill (Reference Glauert and Lighthill1955) theoretically analysed the laminar flow in a boundary layer along a circular cylinder. Their results showed that the profile of the streamwise velocity of laminar flow around a circular cylinder in the radial direction is similar to that of the flat-plate turbulent flow in the wall-normal direction. Methods for measuring unsteady phenomena in the flow field are required to characterise turbulent flow. Moreover, predictive models for the wall friction coefficient in the range from laminar to turbulent flow along a circular cylinder have been proposed through theoretical analyses and experimental measurements (White Reference White1972; Gould & Smith Reference Gould and Smith1980; Alam Reference Alam2020). In addition to the prediction of the wall friction coefficient, the characteristics of turbulent flow as a function of the curvature radius of the wall surface were investigated to clarify the mechanism for sustaining turbulence (Willmarth et al. Reference Willmarth, Winkel, Sharma and Bogar1976; Luxton, Bull & Rajagopalan Reference Luxton, Bull and Rajagopalan1984; Lueptow, Leehey & Stellinger Reference Lueptow, Leehey and Stellinger1985; Snarski & Lueptow Reference Snarski and Lueptow1995; Bokde, Lueptow & Abraham Reference Bokde, Lueptow and Abraham1999; Jordan Reference Jordan2011a). A boundary layer at some extent downstream along a circular cylinder is in dynamic equilibrium. Therefore, in such a flow field, the variations in the friction drag and turbulence statistics in the streamwise direction are not considered (Lueptow et al. Reference Lueptow, Leehey and Stellinger1985; Tutty Reference Tutty2008; Jordan Reference Jordan2011a,Reference Jordanb). Thus we can concentrate on the radius of curvature and flow conditions. Neves, Moin & Moser (Reference Neves, Moin and Moser1994) and Neves & Moin (Reference Neves and Moin1994) showed through direct numerical simulations (DNS) that turbulence structures such as streaky structures of the velocity fluctuation and quasi-streamwise vortices, which are similar to those of flat-plate turbulent flow (Robinson Reference Robinson1991), also exist in turbulent flow along a circular cylinder, and the turbulence intensities are smaller than those in the case of flat-plate turbulent flow. Ohta (Reference Ohta2017) performed DNS under conditions of the small radius of curvature to investigate one or two pairs of high- and low-speed velocity streaks around a circular cylinder. The results indicated that even under conditions of flow along a cylinder with a small radius, small circumference and limited spanwise spacing, turbulence structures such as velocity streaks and quasi-streamwise vortices, which are similar to those of flat-plate turbulent flow, exist, and a certain universality exists in the characteristics of turbulence structures. However, the relationship between turbulence structures around a circular cylinder and the turbulence statistics, such as the mean velocity profile and wall friction coefficient, varying depending on the cylinder radius, has not been clarified. Elucidating the tendency of the characteristics of the turbulence structures around a circular cylinder depending on the cylinder radius and the mechanism that determines the wall friction drag can facilitate the prediction and control of friction drag.

In this study, we performed DNS of air flow in the axial direction along a circular cylinder under different conditions. These situations may arise in systems such as a monofilament yarn in a spinning machine. Assuming a sufficiently downstream flow field, the friction drag can be considered as not changing. Moreover, the turbulence is statistically quasi-steady in the streamwise direction (Lueptow et al. Reference Lueptow, Leehey and Stellinger1985; Tutty Reference Tutty2008; Jordan Reference Jordan2011a,Reference Jordanb). First, we reviewed the results of the previous study in a broader perspective, and extended them to the geometrical characteristic for turbulence structures. Subsequently, the characteristics of the turbulence structures, particularly in the directions normal to the streamwise direction – which can change depending on the radius-based Reynolds number that is defined considering the cylinder radius and uniform flow velocity – were observed and compared with those in the flat-plate turbulent flow. The investigation of the simulation results revealed universal characteristics in the turbulent flow along the surface of a circular cylinder from the geometrical and dynamical perspectives. Then we derived equations that describe the characteristics of velocity streaks as one of the turbulence structures, and the friction drag as one of the turbulence dynamics. We proposed a predictive model for the wall friction coefficient that covers a range from well-developed turbulent flow along the surface of a circular cylinder to that on a flat plate, which includes the universal characteristics of the wall turbulence observed in this study.

2. Simulation method and conditions

We performed DNS of the boundary-layer flow along a curved surface outside a circular cylinder in air flow under various conditions of the radius Reynolds number. The fundamental equations for compressible fluid flow of an ideal gas were solved numerically using a compressible fluid flow solver (Ohta et al. Reference Ohta, Kajishima, Mizobata and Nakamura2012), which is computationally robust even under subsonic conditions, which were the focus of this study.

2.1. Fundamental equations for fluid flow

The non-dimensionalised fundamental equations and parameters used in the present simulations are described as follows.

Mass conservation equation for compressible fluid flow:

(2.1)\begin{equation} \frac{\partial}{\partial t}\rho+\frac{\partial}{\partial x_i}(\rho u_i) =0. \end{equation}

Navier–Stokes equation:

(2.2)\begin{align} \frac{\partial}{\partial t}(\rho u_i) +\frac{\partial}{\partial x_j}(\rho u_i u_j) &={-}\dfrac{1}{\gamma M^2}\,\frac{\partial}{\partial x_i}p \nonumber\\ &\quad +\dfrac{1}{\textit{Re}_a}\,\frac{\partial}{\partial x_j} \left(\frac{\partial u_i}{\partial x_j} +\frac{\partial u_j}{\partial x_i} -\frac{2}{3}\,\delta_{ij}\,\frac{\partial u_k}{\partial x_k}\right). \end{align}

Equation of state for ideal gas:

(2.3)\begin{equation} p = \rho T. \end{equation}

Mach number:

(2.4)\begin{equation} M = \frac{u_\infty}{\sqrt{\gamma R T_0}}. \end{equation}

Radius Reynolds number:

(2.5)\begin{equation} \textit{Re}_a = \frac{\rho_0 u_\infty a}{\mu_0}. \end{equation}

Here, $t$ is the elapsed time, and $x_i$ denotes the spatial coordinates, which are the dependent variables; $u_i$ denotes the velocity components, $p$ is the pressure, and $\rho$ is the density, which are the independent variables. Also, $\gamma$ is the specific heat ratio, $T$ is the temperature, $R$ is the gas constant, and $\delta _{ij}$ is the Kronecker delta. These equations are expressed using the Einstein summation convention. The flow field was assumed to be isothermal, and calculation of the temperature was omitted. In this study, the simulation results were considered to be non-dimensionalised with representative scales for the flow field. We used the cylinder radius $a$, uniform flow velocity $u_\infty$, temperature $T_0$, viscosity $\mu _0$, density $\rho _0$, and gas constant $R$ as representative scales for non-dimensionalisation. Here, $T_0$ and $\mu _0$ are the constant temperature and viscosity of the flow field, respectively, and $\rho _0$ is set to a value representing the property of the current fluid of interest.

The fundamental equations of compressible fluid flow were solved assuming air flow; however, a practically apparent effect of density change was not observed under the conditions of the present simulations. In the simulation program developed for this study, we used a fractional step method based on the pressure equation to calculate the time integral of the fundamental equations. The nonlinear convection and viscous diffusion terms in the Navier–Stokes equations were calculated using the second-order Adams–Bashforth method, and the pressure term and mass conservation equation for compressible fluid flow were calculated using the backward Euler method. The pressure equation was solved using the successive over-relaxation method. The iterative solution method works efficiently because the pressure equation for compressible flow is of the Helmholtz type and we solve the diagonal-dominant matrix equation. The spatial derivatives were approximated by a second-order central difference method using values at the boundaries of each grid so that the total flux passing through the boundaries is conserved. The simulation and observation methods are the same as those used in a previous study (Ohta Reference Ohta2017) that demonstrated that these methods can be used to predict flow fields with high accuracy.

2.2. Computational domain and simulation conditions

In this study, we assumed air flow along a monofilament yarn in the transport of spinning machines at the Mach number based on a uniform flow velocity $M=0.2$. We used the specific heat ratio of air, $\gamma =1.4$, in the fundamental equations. We did not focus on the density change because the effect of density change was negligible under the present conditions. We analysed the flow fields under seven conditions of the radius Reynolds numbers $\textit {Re}_a=\rho _0 u_\infty a / \mu =1500, 1250, 1000, 750, 500, 300, 120$. The flow along a flat plate can be considered as that along a circular cylinder with an infinite radius. Hereinafter, $\textit {Re}_a \rightarrow \infty$ is used to denote a case of flow along a flat plate.

In this study, we set up a cylindrical coordinate system for the computational domain, as shown in figure 1. The axes of the cylindrical coordinate system in the computational domain are $z$, $r$ and $\theta$ in the axial, radial and circumferential directions, respectively. The velocity components in each direction are $v_z$, $v_r$ and $v_\theta$, respectively. The distance in the radial direction from the surface of the cylinder is $y\ (=r-a)$. Using the coordinate system, the fundamental equations for the fluid flows were solved using a numerical method for a curvilinear coordinate system (Kajishima et al. Reference Kajishima, Ohta, Okazaki and Miyake1998). The size of the computational domain is given by $L_z$ and $L_r$ in the streamwise and radial directions, respectively. Assuming an infinitely long cylinder, the periodic condition was applied to the boundaries in the streamwise direction. The no-slip condition was applied to the wall surface, and the free-slip and non-reflecting pressure conditions were applied to the outer boundary.

Figure 1. Schematics of the computational domain and boundary conditions.

Collocated grids were used for the simulations, with the number of grid points being 256 in the streamwise and circumferential directions, and 128 in the radial direction. The grid points were placed close to the wall surface, with an exponential function in the radial direction to focus on the vicinity of the wall, resulting in at least 20 points located in $y^+<10$, and four points in $y^+<1$. The superscript $+$ indicates normalisation by the kinematic viscosity $\nu \ (=\mu /\rho _0)$ and the wall friction velocity $u_\tau$. The grid points are uniformly distributed in the streamwise and circumferential directions. Table 1 lists the sizes of the computational domain and grid resolution. Although the boundary layer around a cylinder grows with time, the radial computational domain is large enough so that the outer edge of the boundary layer never interacts with the outer boundary of the computational domain during the time the flow field is observed in this study. Instead of using the simulations in the past study (Ohta Reference Ohta2017), we performed new simulations for $\textit {Re}_a=300$ and $120$ to compare the results using a common simulation grid system under a wide range of conditions ($\textit {Re}_a=120\unicode{x2013}1500$). Notably, the axial grid size in the viscous length scale, $\Delta z^+$, at $\textit {Re}_a=120$ in the present simulations is larger than that in the previous study, owing to the difference in the wall friction velocity of each simulation result. The various statistics were obtained from simulation results for time $t/(L_z/u_\infty )=1.5\unicode{x2013}5.0$ in all cases. We confirmed that these results are sufficiently converged. In the following sections, we also present the results of the previous study to prove that the differences in the grid size and the size of the computational domain do not affect the considerations of this study. The other conditions are the same as those described in the previous study (Ohta Reference Ohta2017).

Table 1. Computational domain and grid sizes at each radius Reynolds number $\textit {Re}_a$. The sizes are normalised with the viscous length scale. Information on the different sizes used in a previous study (Ohta Reference Ohta2017) is shown for comparison.

3. Observation of the turbulence statistics and turbulence structures

3.1. Comparison of the turbulence statistics

The turbulence statistics at each radius Reynolds number are compared to identify the flow characteristics along a circular cylinder. Figure 2 shows the profiles of the mean velocity in the wall-normal direction at each $\textit {Re}_a$. The vertical axis indicates the streamwise component of the mean velocity, $\bar {v}^+_z$, and the horizontal axis indicates the viscous length of the distance from the surface of the cylinder, $y^+$. The overline represents the temporal and spatial average in the streamwise and circumferential directions. The dotted and dashed lines indicate the wall law $\bar {v}^+_z = y^+$ and the logarithmic law $\bar {v}^+_z = \log (y^+)/0.41 + 5$ for the flat-plate turbulent flow, respectively. The mean velocity profile for $\textit {Re}_a=1500$ is consistent with the wall law and a part of the logarithmic law, which is the same as the velocity profile for flat-plate turbulent flow. As in a previous study (Neves et al. Reference Neves, Moin and Moser1994), the smaller $\textit {Re}_a$ and the larger the curvature of the surface of the cylinder, the more different the velocity profile is from that observed in the flat-plate turbulent flow. In particular, at $\textit {Re}_a < 750$, the variation due to the difference in curvature is large, and the velocity profile appears to be unique to flow along a circular cylinder. In addition, the characteristics are different from those of the flat-plate turbulent flow.

Figure 2. Comparison of the mean velocity profiles at radius Reynolds numbers $\textit {Re}_a=1500, 750, 300, 120$. The logarithmic law and wall law for flat-plate turbulent flow, and the results of past studies for turbulent flow along a circular cylinder at $\textit {Re}_a=311$ and $120$, are also included to validate the reliability of the simulations.

The profiles of the streamwise, radial and circumferential velocity fluctuation intensities, and those of the streamwise vorticity fluctuation intensity at each $\textit {Re}_a$, are shown in figures 3 and 4, respectively. As in the previous study (Neves et al. Reference Neves, Moin and Moser1994), the intensity of the velocity fluctuations decreases as the radius Reynolds number decreases and the effect of the wall curvature increases. However, not all velocity fluctuation intensities disappear, and the unsteadiness of the flow persists even under the condition of the smallest curvature radius in this study. Furthermore, the smaller the radius Reynolds number, the smaller the vorticity fluctuation intensity. Vortices are weaker than those in the case of flat-plate turbulent flow. In particular, in the case $\textit {Re}_a=120$, there are no quasi-streamwise vortices; therefore, from a statistical perspective, the flow is not a well-developed turbulence along a wall.

Figure 3. Comparison of the velocity fluctuation intensities. The results of previous studies for turbulent flow along a circular cylinder at $\textit {Re}_a=311$ and $120$ are shown to validate the reliability of the simulations.

Figure 4. Comparison of the streamwise vorticity fluctuation intensities. The results of previous studies for turbulent flow along a circular cylinder at $\textit {Re}_a=311$ and $120$ are also shown to validate the reliability of the simulations.

Figure 5 shows the ratio of the wall friction velocity of turbulent flow along a circular cylinder, $u_\tau$, to that in the case of flat-plate turbulent flow, $u_{\tau \,{flat}}$. The wall friction velocity is larger for smaller $\textit {Re}_a$. In particular, at $\textit {Re}_a < 750$, $u_\tau$ becomes significantly larger than that of the flat-plate turbulent flow.

Figure 5. Variation in the wall friction velocity depending on the radius Reynolds number $\textit {Re}_a$. The wall friction velocity is normalised with that of the flat-plate turbulent flow.

In summary, from the viewpoint of turbulence statistics, the smaller the radius Reynolds number, the more different is the velocity profile from flow along a flat plate, and the larger the friction drag. In particular, the change is remarkable at $\textit {Re}_a < 750$, where the turbulence intensity is small. This suggests that the increase in the friction drag is because of the shape of the flow field rather than turbulence.

3.2. Observation of the turbulence structures

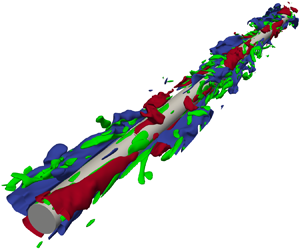
We observed changes in turbulence structures in flows along a circular cylinder at each $\textit {Re}_a$, where the mean velocity profile is different from that of flat-plate turbulent flow. Figure 6 shows the instantaneous turbulence structures in the flow fields at $\textit {Re}_a=1500, 750, 300, 120$. At all $\textit {Re}_a$ values, velocity streaks, which are turbulence structures observed in the flat-plate turbulent flow, exist with high-speed regions (coloured in red) and low-speed regions (coloured in blue) around the cylinders. At $\textit {Re}_a=1500$ and $750$, quasi-streamwise vortices (coloured in green) can be observed to coexist with the velocity streaks. At $\textit {Re}_a=120$, only a few vortices are visible at the threshold. The distributions of the streamwise component of the velocity fluctuation, $v'^+_z$, on one cross-section of each cylinder normal to the axial direction are shown in figure 7, viewed from the streamwise direction. Furthermore, we confirmed that qualitatively similar patterns were observed on the other cross-sections under each condition. Similar to the velocity streaks found in the flat-plate turbulent flow, high- and low-speed regions alternate on the wall surface around the circular cylinders. Thus the number of pairs of high- and low-speed streaks varies with the radius Reynolds number.

Figure 6. Instantaneous structures of high- and low-speed velocity streaks and quasi-streamwise vortices around each circular cylinder at radius Reynolds numbers (a) $\textit {Re}_a=1500$, (b) $\textit {Re}_a=750$, (c) $\textit {Re}_a=300$, and (d) $\textit {Re}_a=120$. The velocity streaks are visualised with the isosurfaces of the streamwise velocity fluctuation (blue for $v'^+_z=-2.4$, red for $v'^+_z=+2.4$), and the vortices are visualised with the isosurfaces of the streamwise vorticity fluctuation (green for ${\omega }'^+_z= \pm 0.2$).

Figure 7. Instantaneous distributions of the streamwise velocity fluctuation around a circular cylinder on a plane normal to the axial direction at radius Reynolds numbers (a) $\textit {Re}_a=1500$, (b) $\textit {Re}_a=750$, (c) $\textit {Re}_a=300$, and (d) $\textit {Re}_a=120$. The numbers of the velocity streak pairs observed on the planes at $\textit {Re}_a=1500, 750, 300, 120$ are $5, 3, 2, 1$, respectively.

The circumferential two-point correlations of the streamwise velocity fluctuation component at each $\textit {Re}_a$ are illustrated in figure 8 to quantitatively investigate the variation in the number of pairs of velocity streaks with the radius Reynolds number. The vertical axis indicates the two-point correlation coefficient of the streamwise velocity fluctuation component $v'_z$ spaced in the circumferential direction, $R(v'_z,v'_z)$, and the horizontal axis indicates the angular separation in the circumferential direction, $\Delta \theta$. The angle $\Delta \theta = \phi$ at which the two-point correlation coefficient $R(v'_z,v'_z)$ reaches a minimum is the spacing between the neighbouring high- and low-speed streaks around the circular cylinder. Subsequently, from the angle $\phi$, the average number of pairs of velocity streaks, $N$, can be estimated by

(3.1)\begin{equation} N = \frac{2 {\rm \pi}}{2\phi}. \end{equation}

Figure 9 shows a plot of $N$ at each $\textit {Re}_a$. The number of pairs depends on the cylinder radius, with approximately $N=1$ at $\textit {Re}_a=120$, and $N=2$ at $\textit {Re}_a = 300$. Generally, as stated in previous studies (Kim, Moin & Moser Reference Kim, Moin and Moser1987; Robinson Reference Robinson1991), the length of the velocity streaks is finite, and the edges of the velocity streaks are in the computational domain, as shown in figure 6. The radius Reynolds number is real, and the number of the velocity streak pairs varying with the condition is an integer. When the radius Reynolds number varies continuously, the number of pairs varies discretely in each cross-section of the cylinder; thus there are places where the number of pairs is high and low, depending on the cross-section of the cylinder. We focused on the average number of pairs, showing the trend along a long cylinder. Therefore, the average number of pairs of velocity streaks, $N$, is not necessarily an integer, but it can be regarded as a real variable. Here, $\textit {Re}_a$ and $N$ can be assumed to be related by a continuous function, as shown in figure 9.

Figure 8. Circumferential angular two-point correlation of the streamwise velocity fluctuation at the radius Reynolds numbers $\textit {Re}_a=1500, 750, 300, 120$. The distance to the first minimum of the correlation is the mean spacing between adjacent opposite-sign streaks.

Figure 9. Variation of the average number of high- and low-speed velocity streak pairs depending on the radius Reynolds number $\textit {Re}_a$. The number of velocity streak pairs was estimated from the mean spacing between the same-sign streaks.

4. Derivation of formulae for the characteristics of turbulent flow

4.1. Verification of the geometrical characteristic of the turbulence structure

Figure 10 shows schematic representations of the geometrical relationship of the turbulence structures around a circular cylinder that is based on the distribution of the streamwise velocity fluctuation component $v'_z$ described in § 3.2. Here, $a$ is the radius of the cylinder, $y_{s}$ is the mean distance between the centre of a velocity streak and the cylinder surface, and $\varLambda$ is the mean spacing between neighbouring high- or low-speed velocity streaks around the circular cylinder. We defined the centre of a velocity streak as the location where the intensity of the streamwise velocity fluctuation reaches its maximum. In the flow fields where the velocity streaks exist along a circular cylinder even at a small cylinder radius, the circumferential periodicity yields a geometrical constraint that is similar to the spanwise periodicity in a simulation of the minimal flow unit along a flat plate (Jiménez & Moin Reference Jiménez and Moin1991).

Figure 10. Schematic models of velocity streak distribution around a circular cylinder in the cases (a) $N=1$, (b) $N=2$, and (c) $N \geq 3$. The spacing between velocity streaks around a circular cylinder in the model is defined depending on the number of velocity streak pairs.

According to a previous study (Ohta Reference Ohta2017), from the geometrical relationship of the turbulence structure shown in figure 10, the velocity streak spacing around a circular cylinder can be obtained as follows. In the case $N=1$,

(4.1)$$\begin{gather} {\varLambda} =\left\{ (a + y_{s}) \times \cos{\alpha} + 2{\rm \pi} a \times \dfrac{\alpha}{2 {\rm \pi}} \right\} \times 4, \end{gather}$$
(4.2)$$\begin{gather}\alpha = \arcsin{\left(\dfrac{a}{a + y_{s}} \right)}. \end{gather}$$

In the case $N \geq 2$,

(4.3)\begin{equation} \varLambda = \frac{2{\rm \pi} (a + y_{s})}{N}. \end{equation}

Here, $\alpha$ is the angle shown in figure 10(a). In turbulent flow along a flat plate, the mean spacing between neighbouring high- or low-speed velocity streaks is approximately ${\varLambda ^+=110}$ in the viscous length scale, which is a characteristic of the velocity streaks (Smith & Metzler Reference Smith and Metzler1983; Kim et al. Reference Kim, Moin and Moser1987; Moser, Kim & Mansour Reference Moser, Kim and Mansour1999). Figure 11 shows the velocity streak spacing in the viscous length scale, $\varLambda ^+$, at each $\textit {Re}_a$ that is estimated by (4.1) and (4.3). The velocity streak spacing is approximately $\varLambda ^+=110$ and is independent of the radius Reynolds number. This is the same as that for turbulent flow along a flat plate.

Figure 11. Comparison of the mean streak spacing normalised with the viscous length scale depending on the radius Reynolds number $\textit {Re}_a$. The mean streak spacing for turbulent channel flow is shown for comparison.

We considered the factors that are used to determine the spacing between the velocity streaks. Equations (4.1) and (4.3) indicate that the velocity streak spacing $\varLambda$ is determined by the cylinder radius $a$, the distance between the velocity streak and cylinder surface $y_{s}$, and the number of the velocity streak pairs $N$. Notably, $a$ is determined by the radius Reynolds number $\textit {Re}_a$, which is set as a condition for fluid flow simulation. Also, $N$ varies as a function of $\textit {Re}_a$, as shown in figure 9. Therefore, instead of these parameters, we focused on the distance between the velocity streak and cylinder surface, $y_{s}$, which is estimated as the position $y$ where the streamwise velocity fluctuation intensity $v'_{z\,{rms}}$ shown in figure 3 reaches its maximum. Figure 12 shows the distance between the velocity streak and cylinder surface at each $\textit {Re}_a$. The positions of the velocity streaks are represented as averages because they change over time, and error bars indicate the standard errors. Similar to the velocity streak spacing, the distance in the viscous length scale at $\textit {Re}_a \geq 500$ does not vary significantly with $\textit {Re}_a$ and is approximately $y^+_{s}=14$. Moreover, the distance for turbulent flow along a circular cylinder is the same as that for the flat-plate turbulent flow (Kim et al. Reference Kim, Moin and Moser1987; Moser et al. Reference Moser, Kim and Mansour1999).

Figure 12. Comparison of the mean distance between the streaks and the wall surface normalised with the viscous length scale depending on the radius Reynolds number $\textit {Re}_a$. Vertical bars indicate the standard errors for the magnitude of the scatter in each case. The mean streak spacing for the turbulent channel flow is shown for comparison.

The DNS results of this study indicate that the velocity streak spacing around the circular cylinder, and the distance between the velocity streak and the cylinder surface, which were estimated in the viscous length scale, are both constant regardless of the condition of the cylinder radius and are the same as those for the flat-plate turbulent flow. However, some discrepancies were observed for $\textit {Re}_a=120$ and $300$ because of the geometrical constraints with the small number of the velocity streak pairs shown in figures 10(a) and 10(b). Therefore, at $\textit {Re}_a \geq 500$, these lengths can be regarded as geometrical characteristics of the turbulence structure independent of the curvature of the wall surface.

4.2. Derivation of a formula for the geometrical characteristic of the turbulence structure

As universal characteristics of the wall turbulence that are independent of the differences in wall curvature, we can assume that the velocity streak spacing and distance between the velocity streak and the cylinder surface in the viscous length scale are constant. Thus we can derive a formula based on the geometrical characteristic of the turbulence structure around a circular cylinder. Based on the geometry of the turbulence structure shown in figure 10, the following equation is valid for the velocity streak spacing $\varLambda$ and the number of velocity streak pairs $N$:

(4.4)\begin{equation} 2{\rm \pi} \left(a^+ + y^+_{s}\right) = \varLambda^+ N \quad (N \geq 2). \end{equation}

According to the schematic in figure 10(a) and (4.1), this geometrical relationship is not necessarily valid for the case $N=1$ because the velocity streak spacing cannot be estimated on one circle. Thus we considered the cases $N \geq 2$. The cylinder radius normalised with the viscous length scale is expressed as

(4.5)\begin{equation} a^+ = \frac{a u_\tau}{\nu} = \frac{a u_\infty}{\nu}\,\frac{u_\tau}{u_\infty} = \textit{Re}_a\, \frac{u_\tau}{u_\infty}. \end{equation}

By definition, the wall friction coefficient $C_f$ can be expressed as

(4.6)\begin{equation} C_f = \frac{2 \tau_w}{\rho {u_\infty}^2} = \frac{2 {u_\tau}^2}{{u_\infty}^2}. \end{equation}

This equation becomes

(4.7)\begin{equation} \frac{u_\tau}{u_\infty} = \sqrt{\frac{C_f}{2}}. \end{equation}

Thus, with the help of (4.5) and (4.7), (4.4) is expressed as

(4.8)\begin{equation} 2 {\rm \pi}\left(\textit{Re}_a\,\sqrt{\frac{C_f}{2}} + y^+_{s} \right) = \varLambda^+ N. \end{equation}

This equation can be rearranged to yield a formula for $C_f$ that is based on the geometrical characteristic of the turbulence structure around a circular cylinder:

(4.9) \begin{equation} C_f = 2 \left( \dfrac{\dfrac{\varLambda^+}{2{\rm \pi}} N - y^+_{s}}{\textit{Re}_a} \right)^2 \quad (N \geq 2). \end{equation}

From the results of § 4.1, $\varLambda ^+$ and $y^+_{s}$ in the above equation can be regarded as constants $\varLambda ^+=110$ and $y^+_{s}=14$, as universal properties of the wall turbulence. Therefore, (4.9) can be considered as a formula for the three variables $C_f$, $\textit {Re}_a$ and $N$.

First, figure 13 shows the wall friction coefficient $C_f$, estimated by (4.9) depending on $\textit {Re}_a$ and $N$, and the results of the DNS at each $\textit {Re}_a$, indicated by red filled circles. The series of $C_f$ in the DNS results are compatible with the models from previous studies (White Reference White1972; Gould & Smith Reference Gould and Smith1980). The application range of the model of Gould & Smith (Reference Gould and Smith1980) was supposed to be between the conditions of laminar flow (Glauert & Lighthill Reference Glauert and Lighthill1955) and developed turbulence (White Reference White1972). The results from previous experimental studies (Willmarth et al. Reference Willmarth, Winkel, Sharma and Bogar1976; Luxton et al. Reference Luxton, Bull and Rajagopalan1984) and a simulation study (Neves et al. Reference Neves, Moin and Moser1994) are also plotted in the figure for comparison. Because the $C_f$ values are larger and located between the conditions $z/a=100$ and $500$ of White (Reference White1972), the boundary layers in the previous studies may be less developed than assumed in this study. Although the boundary of the conditions is not clear, for $\textit {Re}_a=120$, there is no developed turbulence along the wall surface because, from a statistical perspective, there are no quasi-streamwise vortices present, as mentioned in § 3.1. The average number of velocity streak pairs, $N$, in the DNS results corresponds to the results estimated by (4.9). The combinations of the friction drag coefficient and radius Reynolds number correspond to the present DNS results. As the plots of these results are close to the conditions $N=1$, $2$ and $3$ in the figure, the numbers of streak pairs in other studies are expected to correspond to the predictions of the present study, although this information was not given. Subsequently, (4.9) is plotted three-dimensionally in figure 14. The DNS results are located on the surface given by the equation, indicating that the results estimated by (4.9) are consistent with the DNS results.

Figure 13. Friction coefficient for each streak pair number estimated from the radius Reynolds number $\textit {Re}_a$ with the proposed formula (4.9), and the DNS results with the mean streak pair number $N$. Predictions by the models of White (Reference White1972) ($z/a=500$), Gould & Smith (Reference Gould and Smith1980) and Alam (Reference Alam2020) are shown as blue solid, dashed and dotted lines, respectively, for comparison. Also, a prediction of White (Reference White1972) ($z/a=100$) is shown as a red solid line. The results of Willmarth et al. (Reference Willmarth, Winkel, Sharma and Bogar1976), Luxton et al. (Reference Luxton, Bull and Rajagopalan1984) and Neves et al. (Reference Neves, Moin and Moser1994) are plotted as blue circle, triangle and filled circle symbols, respectively.

Figure 14. Relationship among the radius Reynolds number $\textit {Re}_a$, mean velocity streak pair number $N$, and wall friction coefficient $C_f$ estimated using the proposed formula. The DNS results are shown for comparison.

As mentioned previously, (4.9) shows one relationship among the three variables: the radius Reynolds number $\textit {Re}_a$, the wall friction coefficient $C_f$, and the average number of velocity streak pairs $N$. Therefore, two variables, the wall friction coefficient $C_f$ and the average number of velocity streak pairs $N$, cannot be uniquely determined if only the radius Reynolds number $\textit {Re}_a$ is used, as shown in figure 14. We need another equation involving these three variables to determine these variables uniquely.

4.3. Verification of the dynamical characteristic for a pair of velocity streaks

For a given radius Reynolds number $\textit {Re}_a$, another formula involving the three variables $\textit {Re}_a$, $C_f$ and $N$ is required in addition to (4.9) to uniquely determine the wall friction coefficient $C_f$ and the average number of high- and low-speed velocity streak pairs $N$. For a formula with a different dimension in the same flow field, we focused on the dynamical relationship among the three variables in the turbulent flow along a circular cylinder, which is independent of the curvature of the wall surface. For this relationship, we considered the friction coefficient per pair of high- and low-speed velocity streaks, $C_{f,{sp}}$, which is defined as

(4.10)\begin{equation} C_{f,{sp}} = \frac{2 {\rm \pi}a^+}{N}\,C_f. \end{equation}

Figure 15 shows the friction coefficient per pair of the velocity streaks, $C_{f,{sp}}$, at each $\textit {Re}_a$; $C_{f,{sp}}$ for the flat-plate turbulent flow is given by an experiment (Coles Reference Coles1962, Reference Coles1964). According to experience with flat-plate turbulent flow, the value is not necessarily constant and can vary depending on the flow conditions. The most common value is quoted here. In most cases $\textit {Re}_a \geq 300$, the friction coefficient per velocity streak pair is approximately $C_{f,{sp}}=0.56$, which is common for turbulent flows along both a circular cylinder and a flat plate. Therefore, we considered the friction coefficient per velocity streak pair as a dynamical characteristic for a pair of velocity streaks in wall turbulence, independent of the curvature of the wall surface, which was derived from the results of the DNS under the condition $\textit {Re}_a \geq 300$.

Figure 15. Comparison of the friction coefficient per pair of high- and low-speed velocity streaks depending on the radius Reynolds number $\textit {Re}_a$. The friction coefficient per velocity streak pair for turbulent boundary-layer flow along a flat plate is shown for comparison.

In contrast, $C_{f,{sp}}$ at $\textit {Re}_a=120$ is larger than that under the other conditions. Based on figure 9, the average number of the velocity streak pairs in this case is $N=1$, which does not satisfy the geometrical characteristic of the turbulence structure, which is the focus of this study. This is because $\textit {Re}_a$ is relatively small, and as shown in figure 10(a), the effect of the curvature of the cylinder surface makes the flow specific to the field around the circular cylinder; and the characteristics of turbulence dynamics related to a pair of the velocity streaks, which are common from the turbulent flow along a cylinder to that along a flat plate, are no longer applicable in the case $N=1$. Therefore, the universal characteristics of wall turbulence independent of the wall curvature assumed in this study are valid under the condition $N \geq 2$.

4.4. Derivation of a formula for the dynamical characteristic of a velocity streak pair

As a universal characteristic of turbulence dynamics, the friction coefficient per pair of high- and low-speed velocity streaks, $C_{f,{sp}}$, can be assumed to be constant. Subsequently, within the range of conditions under which this characteristic is valid, we derived a formula based on the dynamical characteristic for a pair of velocity streaks in wall turbulence. Using (4.5) and (4.7), (4.10) can be transformed to

(4.11)\begin{equation} C_{f,{sp}} = \frac{2 {\rm \pi}}{N}\,\textit{Re}_a\,\sqrt{\frac{C_f}{2}}\,C_f = \frac{\sqrt{2} {\rm \pi}\,\textit{Re}_a\,C_f^{3/2}}{N}. \end{equation}

By further transforming this equation into an expression for the wall friction coefficient $C_f$, the formula for the relationship among the variables based on the dynamical characteristic of a velocity streak pair is expressed as

(4.12)\begin{equation} C_f = \left(\frac{N\,C_{f,{sp}}}{\sqrt{2} {\rm \pi}\,\textit{Re}_a}\right)^{2/3} \quad \left(N \geq 2\right). \end{equation}

Assuming a constant value $C_{f,{sp}}=0.56$ based on figure 15, (4.12) represents the relationship among the three variables $C_f$, $\textit {Re}_a$ and $N$. We continue our discussion by noting the value of the dynamical characteristic parameter as $C_{f,{sp}}=0.56$. However, the argument presented in this study is not limited to the value of this parameter.

In figure 16, (4.9) and (4.12) are displayed three-dimensionally with black and blue surfaces, respectively. The DNS results are located at the intersection of the two surfaces. This indicates that the results estimated by combining the two formulae are consistent with the DNS results. Moreover, figure 17 shows the result for a wider range of $\textit {Re}_a$. We can obtain $C_f=C_{f,{sp}}/\varLambda ^+=0.56/110=0.00509$ by combining the two equations and setting $\textit {Re}_a \rightarrow \infty$. The wall friction coefficient is close to $C_f=0.00503$ of flat-plate turbulent flow (Coles Reference Coles1962, Reference Coles1964). This indicates that we can estimate the wall friction coefficient up to $\textit {Re}_a \rightarrow \infty$ as the flow over a flat plate.

Figure 16. Relationship among the radius Reynolds number $\textit {Re}_a$, mean velocity streak pair number $N$, and wall friction coefficient $C_f$ estimated by the combination of the two equations. The DNS results are shown for comparison.

Figure 17. Relationship among the radius Reynolds number $\textit {Re}_a$, mean velocity streak pair number $N$, and wall friction coefficient $C_f$ estimated by the combination of the two formulae over a wide range of $\textit {Re}_a$. The DNS results are also shown for comparison. The friction coefficient for flat-plate turbulent flow can be predicted by combining the formulae at $\textit {Re}_a \rightarrow \infty$.

Table 2 lists the wall friction coefficients and average numbers of velocity streak pairs obtained by the DNS and predicted by the proposed model. Because explicitly solving the conjunction of the two equations is challenging, the solutions were obtained numerically by iterative calculations. The relative errors of the model results to the DNS results are also presented to objectively verify the prediction accuracy of the model. Comparisons with the results of the previous studies shown in figure 13 are also presented in the table. The model can predict the number of velocity streak pairs under those conditions. The trends of the changes depending on the radius Reynolds number correspond, but the errors of the predictions are larger in the case when the development of the boundary layer is not exactly the same as the present DNS seen in figure 13. As mentioned during the derivation process of the model, the constant parameters used in the model were only read from the figures of the DNS results and not specifically comprehensively optimised. Nevertheless, at $\textit {Re}_a \geq 300$, the relative errors are almost equal to or less than $5\,\%$. The results demonstrate that the model is valid for turbulent flows where $N \geq 2$, or equivalently, where $\textit {Re}_a \geq 300$ (see figure 9). The correct prediction of the changes in the average number of pairs as a function of the radius Reynolds number confirms that the model appropriately predicts the turbulence statistics based on the characteristics of the turbulence structure in the present DNS. The high prediction accuracy of the wall friction coefficient suggests from an engineering perspective that the model is a practical prediction tool.

Table 2. Comparison of the average numbers of the wall friction coefficient and velocity streak pairs estimated by the present DNS and the proposed model at each radius Reynolds number. The relative errors of the model predictions to the DNS and results of the previous studies are shown to verify the prediction accuracy of the model. The results of the previous studies (White Reference White1972; Gould & Smith Reference Gould and Smith1980; Willmarth et al. Reference Willmarth, Winkel, Sharma and Bogar1976; Luxton et al. Reference Luxton, Bull and Rajagopalan1984; Neves et al. Reference Neves, Moin and Moser1994) are also compared with the model estimates.

In summary, the characteristics of the turbulent flow along a circular cylinder in the axial direction can be estimated by combining the geometrical characteristic of the turbulence structure and the dynamical characteristic for a pair of velocity streaks in wall turbulence. Furthermore, we demonstrated that this approach can predict the wall friction coefficient of the turbulent flow along a flat plate with $\textit {Re}_a \rightarrow \infty$ as flow along a surface with infinite radius.

5. Conclusions

In this study, we performed DNS of the axial turbulent flow along the surface of a circular cylinder in air flow. We investigated the characteristics of the changes in the turbulence structure with the radius Reynolds number, which is defined using the cylinder radius and the uniform flow velocity, and compared them with those of the turbulence structure in a boundary layer on a flat plate. The conclusions of this study are as follows.

  1. (i) The geometry of the turbulence structure shows that the velocity streak spacing around a circular cylinder and the distance between the velocity streak and the cylinder surface in the viscous length scale do not vary substantively with the radius Reynolds number, and are the same as those for the flat-plate turbulent flow. Therefore, they can be regarded as geometrical characteristics of the turbulence structure independent of the radius Reynolds number.

  2. (ii) The friction coefficient per pair of high- and low-speed velocity streaks in the viscous length scale is also constant, independent of the radius Reynolds number, and the same as that for the flat-plate turbulent flow. It can be regarded as the dynamical characteristic for a pair of velocity streaks in wall turbulence.

  3. (iii) We derived two formulae based on the geometrical and dynamical characteristics of the well-developed turbulent flow in the axial direction along the surface of a circular cylinder. The combination of the two formulae can be used as a model to predict the magnitude of wall friction drag and the characteristics of the turbulence structure around the circular cylinder.

The model, derived from the DNS findings, aligns with predictions from previous studies under the same range of conditions. It is valid for radius Reynolds numbers above $300$, where the number of high- and low-speed streak pairs is at least $2$, reflecting the model's assumption of an unconstrained presence of turbulence structures. We demonstrated that the proposed approach can accurately estimate the wall friction coefficient, which is one of the statistical characteristics of the turbulence structure, and the average number of velocity streak pairs, which is one of the structural characteristics. The wall friction drag was predicted in relation to the instantaneous turbulence structure in this study.

Funding

This work was performed using the supercomputer of the Academic Centre for Computing and Media Studies, Kyoto University. The use of the supercomputer was funded by the Centre for Information Initiative, University of Fukui.

Declaration of interests

The authors report no conflict of interest.

References

Alam, M.M. 2020 A review of transverse curvature effect on friction force and leading-edge flow. Ocean Engng 218, 107573.CrossRefGoogle Scholar
Bokde, A.L.W., Lueptow, R.M. & Abraham, B. 1999 Spanwise structure of wall pressure on a cylinder in axial flow. Phys. Fluids 11 (1), 151161.CrossRefGoogle Scholar
Coles, D.E. 1962 The turbulent boundary layer in a compressible fluid. Tech. Rep. R–403–PR. RAND Corporation, Santa Monica.Google Scholar
Coles, D.E. 1964 The turbulent boundary layer in a compressible fluid. Phys. Fluids 7 (9), 14031423.CrossRefGoogle Scholar
Glauert, M.B. & Lighthill, M.J. 1955 The axisymmetric boundary layer on a long thin cylinder. Math. Phys. Sci. 230 (1181), 188203.Google Scholar
Gould, J. & Smith, F.S. 1980 Air-drag on synthetic-fibre textile monofilaments and yarns in axial flow at speeds of up to 100 metres per second. J. Text. Inst. 71 (1), 3849.CrossRefGoogle Scholar
Ishida, T., Duguet, Y. & Tsukahara, T. 2016 Transitional structures in annular Poiseuille flow depending on radius ratio. J. Fluid Mech. 794, R2.CrossRefGoogle Scholar
Jiménez, J. & Moin, P. 1991 The minimal flow unit in near-wall turbulence. J. Fluid Mech. 225, 213240.CrossRefGoogle Scholar
Jordan, S.A. 2011 a Axisymmetric turbulent statistics of long slender circular cylinders. Phys. Fluids 23, 075105.CrossRefGoogle Scholar
Jordan, S.A. 2011 b Near-wall turbulent characteristics along very long thin circular cylinders. J. Fluids Struct. 27 (3), 329341.CrossRefGoogle Scholar
Kajishima, T., Ohta, T., Okazaki, K. & Miyake, Y. 1998 High-order finite-difference method for incompressible flows using collocated grid system. JSME Intl J. 41 (4), 830839.CrossRefGoogle Scholar
Kim, J., Moin, P. & Moser, R. 1987 Turbulence statistics in fully developed channel flow at low Reynolds number. J. Fluid Mech. 177, 133166.CrossRefGoogle Scholar
Liu, N.S. & Lu, X.Y. 2004 Large eddy simulation of turbulent concentric annular channel flows. Intl J. Numer. Meth. Fluids 45 (12), 13171338.CrossRefGoogle Scholar
Lueptow, R.M., Leehey, P. & Stellinger, T. 1985 The thick, axisymmetric turbulent boundary layer: mean and fluctuating velocities. Phys. Fluids 28, 34953505.CrossRefGoogle Scholar
Luxton, R.E., Bull, M.K. & Rajagopalan, S. 1984 The thick turbulent boundary layer on a long fine cylinder in axial flow. Aeronaut. J. 88 (875), 186199.CrossRefGoogle Scholar
Moser, R.D., Kim, J. & Mansour, N.N. 1999 Direct numerical simulation of turbulent channel flow up to $Re_\tau = 590$. Phys. Fluids 11 (4), 943945.CrossRefGoogle Scholar
Neves, J.C. & Moin, P. 1994 Effects of convex transverse curvature on wall-bounded turbulence. Part 2. The pressure fluctuations. J. Fluid Mech. 272, 383406.CrossRefGoogle Scholar
Neves, J.C., Moin, P. & Moser, R.D. 1994 Effects of convex transverse curvature on wall-bounded turbulence. Part 1. The velocity and vorticity. J. Fluid Mech. 272, 349382.CrossRefGoogle Scholar
Ohta, T. 2017 Turbulence structures in high-speed air flow along a thin cylinder. J. Turbul. 18 (6), 497511.CrossRefGoogle Scholar
Ohta, T., Kajishima, T., Mizobata, K. & Nakamura, K. 2012 Influence of density fluctuation on DNS of turbulent channel flow in the presence of temperature stratification. Flow Turbul. Combust. 89 (3), 435448.CrossRefGoogle Scholar
Potter, J.R., Delaory, E., Constantin, S. & Badiu, S. 2000 The ‘thinarray’; a lightweight, ultra-thin (8 mm OD) towed array for use from small vessels of opportunity. In Proceedings of the 2000 International Symposium on Underwater Technology (Cat. No. 00EX418), pp. 49–53. IEEE.CrossRefGoogle Scholar
Robinson, S.K. 1991 Coherent motions in the turbulent boundary layer. Annu. Rev. Fluid Mech. 23, 601639.CrossRefGoogle Scholar
Satake, S. & Kawamura, H. 1995 Large eddy simulation of turbulent flow in concentric annuli with a thin inner rod. In Turbulent Shear Flows 9 (ed. F. Durst, N. Kasagi, B.E. Launder, F.W. Schmidt, K. Suzuki & J.H. Whitelaw), pp. 259–281. Springer.CrossRefGoogle Scholar
Smith, C.R. & Metzler, W.G. 1983 The characteristics of low-speed streaks in the near-wall region of a turbulent boundary layer. J. Fluid Mech. 129, 2754.CrossRefGoogle Scholar
Snarski, S.R. & Lueptow, R.M. 1995 Wall pressure and coherent structures in a turbulent boundary layer on a cylinder in axial flow. J. Fluid Mech. 286, 137171.CrossRefGoogle Scholar
Tutty, O.R. 2008 Flow along a long thin cylinder. J. Fluid Mech. 602, 137.CrossRefGoogle Scholar
White, F.M. 1972 An analysis of axisymmetric turbulent flow past a long cylinder. Trans. ASME J. Basic Engng 94 (1), 200204.CrossRefGoogle Scholar
Willmarth, W.W., Winkel, R.E., Sharma, L.K. & Bogar, T.J. 1976 Axially symmetric turbulent boundary layers on cylinders: mean velocity profiles and wall pressure fluctuations. J. Fluid Mech. 76, 3564.CrossRefGoogle Scholar
Figure 0

Figure 1. Schematics of the computational domain and boundary conditions.

Figure 1

Table 1. Computational domain and grid sizes at each radius Reynolds number $\textit {Re}_a$. The sizes are normalised with the viscous length scale. Information on the different sizes used in a previous study (Ohta 2017) is shown for comparison.

Figure 2

Figure 2. Comparison of the mean velocity profiles at radius Reynolds numbers $\textit {Re}_a=1500, 750, 300, 120$. The logarithmic law and wall law for flat-plate turbulent flow, and the results of past studies for turbulent flow along a circular cylinder at $\textit {Re}_a=311$ and $120$, are also included to validate the reliability of the simulations.

Figure 3

Figure 3. Comparison of the velocity fluctuation intensities. The results of previous studies for turbulent flow along a circular cylinder at $\textit {Re}_a=311$ and $120$ are shown to validate the reliability of the simulations.

Figure 4

Figure 4. Comparison of the streamwise vorticity fluctuation intensities. The results of previous studies for turbulent flow along a circular cylinder at $\textit {Re}_a=311$ and $120$ are also shown to validate the reliability of the simulations.

Figure 5

Figure 5. Variation in the wall friction velocity depending on the radius Reynolds number $\textit {Re}_a$. The wall friction velocity is normalised with that of the flat-plate turbulent flow.

Figure 6

Figure 6. Instantaneous structures of high- and low-speed velocity streaks and quasi-streamwise vortices around each circular cylinder at radius Reynolds numbers (a) $\textit {Re}_a=1500$, (b) $\textit {Re}_a=750$, (c) $\textit {Re}_a=300$, and (d) $\textit {Re}_a=120$. The velocity streaks are visualised with the isosurfaces of the streamwise velocity fluctuation (blue for $v'^+_z=-2.4$, red for $v'^+_z=+2.4$), and the vortices are visualised with the isosurfaces of the streamwise vorticity fluctuation (green for ${\omega }'^+_z= \pm 0.2$).

Figure 7

Figure 7. Instantaneous distributions of the streamwise velocity fluctuation around a circular cylinder on a plane normal to the axial direction at radius Reynolds numbers (a) $\textit {Re}_a=1500$, (b) $\textit {Re}_a=750$, (c) $\textit {Re}_a=300$, and (d) $\textit {Re}_a=120$. The numbers of the velocity streak pairs observed on the planes at $\textit {Re}_a=1500, 750, 300, 120$ are $5, 3, 2, 1$, respectively.

Figure 8

Figure 8. Circumferential angular two-point correlation of the streamwise velocity fluctuation at the radius Reynolds numbers $\textit {Re}_a=1500, 750, 300, 120$. The distance to the first minimum of the correlation is the mean spacing between adjacent opposite-sign streaks.

Figure 9

Figure 9. Variation of the average number of high- and low-speed velocity streak pairs depending on the radius Reynolds number $\textit {Re}_a$. The number of velocity streak pairs was estimated from the mean spacing between the same-sign streaks.

Figure 10

Figure 10. Schematic models of velocity streak distribution around a circular cylinder in the cases (a) $N=1$, (b) $N=2$, and (c) $N \geq 3$. The spacing between velocity streaks around a circular cylinder in the model is defined depending on the number of velocity streak pairs.

Figure 11

Figure 11. Comparison of the mean streak spacing normalised with the viscous length scale depending on the radius Reynolds number $\textit {Re}_a$. The mean streak spacing for turbulent channel flow is shown for comparison.

Figure 12

Figure 12. Comparison of the mean distance between the streaks and the wall surface normalised with the viscous length scale depending on the radius Reynolds number $\textit {Re}_a$. Vertical bars indicate the standard errors for the magnitude of the scatter in each case. The mean streak spacing for the turbulent channel flow is shown for comparison.

Figure 13

Figure 13. Friction coefficient for each streak pair number estimated from the radius Reynolds number $\textit {Re}_a$ with the proposed formula (4.9), and the DNS results with the mean streak pair number $N$. Predictions by the models of White (1972) ($z/a=500$), Gould & Smith (1980) and Alam (2020) are shown as blue solid, dashed and dotted lines, respectively, for comparison. Also, a prediction of White (1972) ($z/a=100$) is shown as a red solid line. The results of Willmarth et al. (1976), Luxton et al. (1984) and Neves et al. (1994) are plotted as blue circle, triangle and filled circle symbols, respectively.

Figure 14

Figure 14. Relationship among the radius Reynolds number $\textit {Re}_a$, mean velocity streak pair number $N$, and wall friction coefficient $C_f$ estimated using the proposed formula. The DNS results are shown for comparison.

Figure 15

Figure 15. Comparison of the friction coefficient per pair of high- and low-speed velocity streaks depending on the radius Reynolds number $\textit {Re}_a$. The friction coefficient per velocity streak pair for turbulent boundary-layer flow along a flat plate is shown for comparison.

Figure 16

Figure 16. Relationship among the radius Reynolds number $\textit {Re}_a$, mean velocity streak pair number $N$, and wall friction coefficient $C_f$ estimated by the combination of the two equations. The DNS results are shown for comparison.

Figure 17

Figure 17. Relationship among the radius Reynolds number $\textit {Re}_a$, mean velocity streak pair number $N$, and wall friction coefficient $C_f$ estimated by the combination of the two formulae over a wide range of $\textit {Re}_a$. The DNS results are also shown for comparison. The friction coefficient for flat-plate turbulent flow can be predicted by combining the formulae at $\textit {Re}_a \rightarrow \infty$.

Figure 18

Table 2. Comparison of the average numbers of the wall friction coefficient and velocity streak pairs estimated by the present DNS and the proposed model at each radius Reynolds number. The relative errors of the model predictions to the DNS and results of the previous studies are shown to verify the prediction accuracy of the model. The results of the previous studies (White 1972; Gould & Smith 1980; Willmarth et al.1976; Luxton et al.1984; Neves et al.1994) are also compared with the model estimates.