INTRODUCTION
Acute respiratory infections (ARI) are a major contributor to childhood hospitalizations and are the leading cause of death in children aged <5 years worldwide [1–Reference Pio3]. ARI tend to follow a seasonal pattern. In temperate climates, ARI have seasonal epidemic periods that correspond with the cooler, dryer, winter months [Reference Foy4–Reference Johnston, Holgate, Myint and Taylor-Robinson7]; however, the seasonality of ARI in tropical climates is less clear. Of the studies that have been completed in the tropics, the majority found ARI, including influenza, to peak during the pre-rainy and rainy seasons [Reference Spika8–Reference Brooks14]. In the tropics, the rainy season is often accompanied by higher temperatures and higher relative humidities, which is in marked contrast to the weather conditions during the ARI season in temperate regions. The explanation for this dichotomy is not yet known, but could possibly be due to non-meteorological environmental influences. While there may be many, one possible explanation may be household crowding. The primary modes of transmission for most acute respiratory pathogens are through large droplets and contact with infected objects [Reference Heymann15–Reference Hall23]. Thus, the additional time spent indoors in closer contact with other household members during the cold, winter season in temperate climates and the rainy season in tropical climates may provide more opportunities for person-to-person spread of acute respiratory pathogens via these mechanisms.
The goal of this study was to determine if episodes of ARI were more likely to be preceded by days with rainfall, a potential indicator for spending more time indoors, compared to illness-free days in children and determine if household crowding modified this association. To do this, we conducted a case-crossover study in children aged <5 years residing in an urban slum of Dhaka, Bangladesh between 15 March and 14 June 2005, the period with sporadic rainfall leading up to the monsoon season.
METHODS
Study population
The study population consisted of residents of Kamalapur, an impoverished urban area located in the southeastern sector of Dhaka, Bangladesh. The community under surveillance is densely populated with 81 338 persons/km2 in a 2·4 km2 area. Bangladesh has a tropical climate with a mild winter, hot, humid summer, and warm, rainy monsoon season.
We conducted surveillance for ARI in children aged <5 years and included surveillance for laboratory-confirmed influenza in the same population [Reference Brooks24]. The International Centre for Diarrhoeal Disease Research, Bangladesh (ICDDR,B) maintains a medical clinic in Kamalapur with over 70 field staff employed by ICDDR,B regularly on site, including eight doctors, eight nurses, 15 health assistants, three field research officers, and 40 field research assistants (FRAs). This research infrastructure is described in more detail elsewhere [Reference Brooks25].
Case ascertainment
This study utilized the existing ARI and influenza surveillance infrastructure in Kamalapur [Reference Brooks25, 26]. Briefly, 5000 households in randomly selected geographic residence clusters were monitored. Parents or guardians of all children aged <5 years in selected households were asked to consent for their child to participate in the surveillance. Participation included access to free medical care and <1% declined participation.
During recruitment, the household's FRA determined if there were children aged <5 years in the household during a regularly scheduled visit. If there were, the parent(s) of the child/children were informed of the study and asked for their consent to enrol the child/children. Initial recruitment took place prior to the study period and children aged <5 years who entered the study households during the study period were recruited during the first FRA visit after their entrance to ensure that all children aged <5 years had an opportunity to participate. Only children whose parents indicated they were not planning to move during the study period were included, and neurologically compromised children at risk for aspiration during nasopharyngeal wash procedures were excluded.
Institutional review board (IRB) approval for the study of human subjects was obtained from ICDDR,B, Dhaka, Bangladesh, the Centers for Disease Control and Prevention, Atlanta, Georgia, and Emory University, Atlanta, Georgia.
FRAs visited households weekly and used a standardized calendar questionnaire to ask children's caregivers about the presence of clinical signs of ARI for each day of the week since the previous visit and measured the child's temperature and respiratory rate. Clinical signs were divided into major and minor signs. Major signs included fever (axillary temperature ⩾38°C), age-specific respiratory rate using WHO criteria in breaths/min (<2 months: ⩾60/min; 2–11 months: ⩾50/min; 12–59 months: ⩾40/min) [27], danger signs (chest indrawing, lethargy, cyanosis, inability to drink, convulsions), difficult breathing, noisy breathing, and ear pain/discharge. Minor signs included cough, rhinorrhea, sore throat, myalgia/arthralgia, chills, headache, irritability/decreased activity, and vomiting.
Children were referred to the clinic if they had at least one major or ⩾2 minor signs. In the clinic, the medical officer examined the child and provided a clinical diagnosis, treatment, and follow-up plan. Every fifth child with ARI had nasopharyngeal aspirations and acute and convalescent sera collected for testing for influenza viruses. Children given a diagnosis of acute otitis media, sinusitis, tonsillitis, pharyngitis, upper respiratory infection, pneumonia, bronchitis, bronchiolitis, or lower respiratory infection by a field clinic medical officer were considered to have an ARI.
Data collection
The entire study period encompassed the time period from 17 October 2004 to 30 September 2005; however, meteorological records indicated that there was no rainfall during 17 October 2004 to mid-March, 2005 and it rained nearly every day from mid-June to the end of the study period. Because of the lack of variability in the amount of rainfall during these time periods, which probably also corresponded to a lack in variability with respect to spending time indoors, they were excluded from the analysis. Thus, this analysis was limited to children with ARI onset during 15 March to 14 June 2005, the time period with variable rainfall, which was also hypothesized to be accompanied by variable behaviour with respect to the amount of time spent indoors due to rainfall.
The ARI surveillance data were combined with meteorologic data, i.e. temperature, humidity, and rainfall, which were obtained from the Bangladesh Meteorological Department. Additionally, all households with enrolled children completed an oral questionnaire assessing levels of crowding within their home at one of the weekly FRA visits conducted during the analysis period. Crowding was defined as the number of people per room and served as a crude measurement of indoor household density. Data from influenza surveillance in Kamalapur were also compared to ARI data; however, there were too few laboratory-confirmed influenza cases in the surveillance population during the analysis period to perform influenza-specific analyses.
Data analysis
A case-crossover study design was used, matching on subject; thus, cases served as their own controls. This study design inherently controls for factors, both measured and unmeasured, that do not vary over time. Because cases and controls were the same person, this analysis was limited to children who experienced an ARI during the analysis period.
A case day was defined as the day on which the first symptom of the ARI episode began. Control days were defined as days occurring during the same month as the child's illness and during the period the child was at risk for developing an ARI. The at-risk period of developing an ARI excluded the 7-day period preceding the onset of the first symptom of the ARI episode up to the 7-day period after the resolution of the last symptom of the ARI episode. This was to ensure that the control days were completely distinct from periods of ARI in the child, thus reducing autocorrelation that may have been present if every day were used. Days outside of this period were considered the at-risk period. Figure 1 illustrates the at-risk and not at-risk periods.

Fig. 1. An example of case and control days. The line represents a 1-month calendar, with the dates and days of the week noted. The case day, which corresponds to the day of symptom onset, is indicated. The at-risk period of developing an acute respiratory infection (ARI) excludes the 7-day period preceding the onset of the first symptom of the ARI episode to the 7-day period after the resolution of the last symptom of the ARI episode. The entire excluded time period is shaded and comprises the not at-risk period. The remaining dates make up the at-risk periods and are not shaded; the control days are equivalent to the days that fall in the at-risk periods.
If a child had multiple episodes of ARI between 15 March and 14 June 2005, then his/her at-risk period was adjusted to exclude the time period surrounding these subsequent illnesses from the 7 days prior to the onset of symptoms to the end of the 7-day period after the last day of symptoms. Control days were determined as described above.
Conditional logistic regression, matched on the child, was used for the analysis. The main exposure variable, rainfall, was defined as the 6-day average of rainfall from days −1 to −6 preceding the index case or control day. This choice of measuring rainfall through lag periods accounted for the incubation period range of most relevant acute respiratory pathogens [Reference Heymann15, 28, Reference Pickering29]. Because the child was serving as his/her own control, child-specific variables, such as socioeconomic status and maternal and child characteristics were controlled for by the design and were not included in the model. Possible confounders that were considered in the analysis were those that were temporally varying and thus could be different between case and control days, including temperature and humidity, which were defined as 6-day averages of the temperature and humidity of days −1 to −6 preceding the index case or control day to match the lag period being used for rainfall. All weather variables were analysed as continuous variables.
Additionally, linear, quadratic, and cubic terms to control for possible within-season time trends were also included (see model below). In order to assess effect modification by household crowding and determine if the relationship between rainfall and ARI was stronger in children living in households with a larger number of people per room compared to those living in households with fewer people per room, a stratified analysis was performed for the following levels of household crowding: (1) a dichotomy (categorized as <3 vs. ⩾3) and (2) five categories (categorized as <3 vs. ⩾3 to <4, ⩾4 to <5, ⩾5 to <6, and ⩾6 people/room).
Model

where Y d represents the child's ARI case or control status on day d, β0 is the intercept, Rainfalld represents the 6-day average of rainfall from days −1 to −6 preceding day d, Tempd and Humidityd represent the 6-day average of temperature and humidity from days −1 to −6 preceding day d, t d represents the dth day of the season and t d, t d2, t d3 are linear, quadratic, and cubic terms to control for within-season time trends, DOWn represents dummy variables for the day-of-week to control for any day-of-week effect that might be present in the data (n=1, 2, 3, …, 6), and Subjectm represents dummy variables for the different subjects in the study (m=1, 2, 3, …, 717). Separate models were run for each level of household crowding analysed. Odds ratios for rainfall for each model were calculated as ![]() .
.
A sensitivity analysis was performed to assess alternate lag periods for rainfall, temperature, and humidity, including individual days and additional groups of days. For each individual analysis, the same lag period was used for rainfall, temperature, and humidity. These included −1 to −14 days preceding the index case or control day and the following groups of days: −2 to −4 days; −2 to −5 days; −2 to −6 days; −1 to −4 days; −1 to −5 days; and −1 to −6 days.
RESULTS
Descriptive statistics
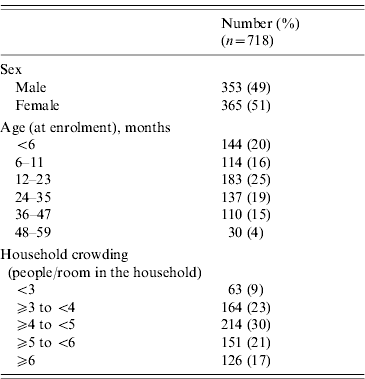
During the analysis period (15 March to 14 June 2005), 718 children aged <5 years experienced 827 ARIs. The symptom onset days of the 827 ARI were matched with 9258 control days, with an average of 11 control days per child (range 1–29). Of children with ARI, 49% were male, 36% were aged <1 year, and 68% lived in households with ⩾4 people per room (Table 1). Monthly total influenza virus infections, by type and subtype, and ARI are displayed in Figure 2. The temporal distribution of ARI and rainfall (mm) during the study period can be seen in Figures 3 (monthly) and 4 (daily). Influenza viruses were most likely to circulate during the period of intermittent rainfall and during the monsoon period for the study year of October 2004 to September 2005.
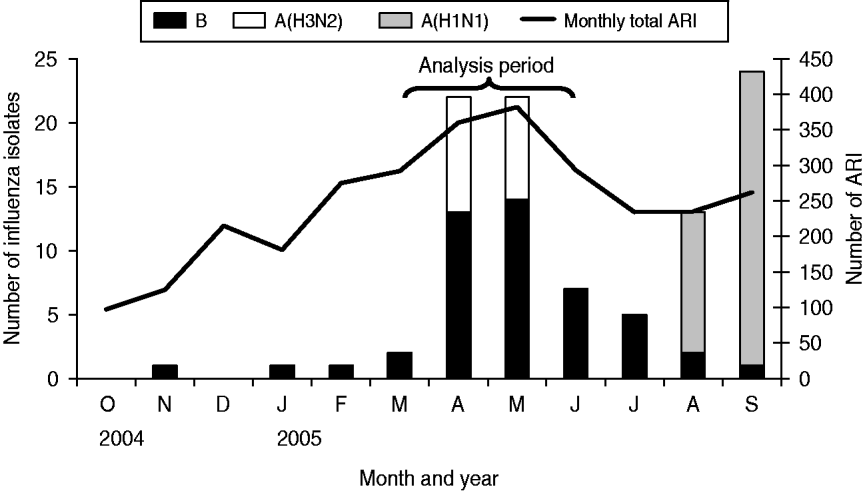
Fig. 2. Influenza isolates and acute respiratory infection (ARI), 17 October 2004 to 30 September 2005.
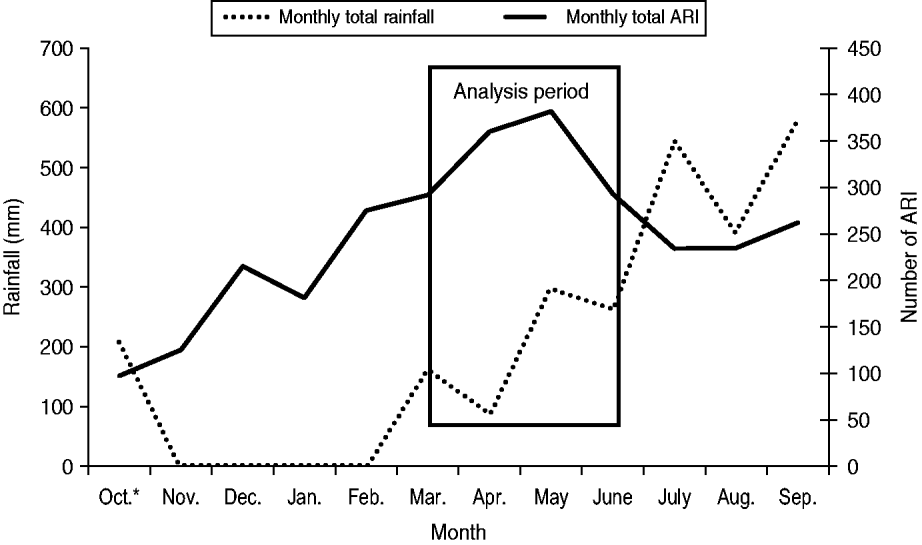
Fig. 3. Monthly acute respiratory infection (ARI) by onset date and rainfall, October 2004 to September 2005. * Rainfall data for the month of October is for the time period 1–31 October. ARI data for the month of October is for the time period 17–31 October.
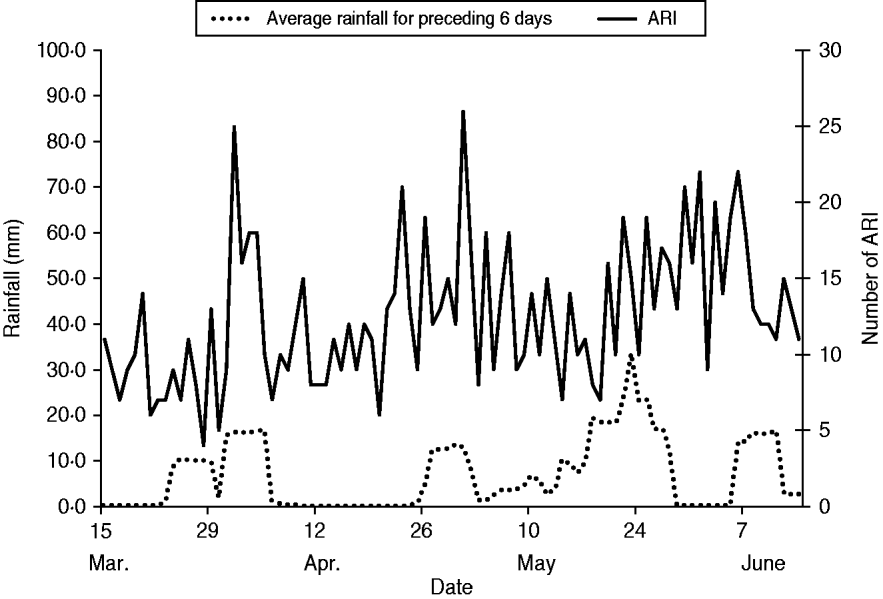
Fig. 4. Daily acute respiratory infection (ARI) by onset date and average rainfall for the preceding 6 days during the analysis period: 15 March to 14 June 2005.
Table 1. Sex, age, and household crowding characteristics of children included in the case-crossover study
Sensitivity analysis
The results of the sensitivity analysis can be found in Table 2. Lag periods of days −1 and −3 preceding the index case or control day individually produced associations between ARI and rainfall. All of the day ranges produced associations between rainfall during the lag period and a subsequent ARI; however, the inclusion of day −1 in the range increased the strength of the associations. Because many acute respiratory pathogens have an incubation period range of about 1–6 days [Reference Heymann15, 28, Reference Pickering29], the lag period that included this range of days was chosen for further analyses.
Table 2. Results of sensitivity analysis of different lag periods for rainfall (all children)
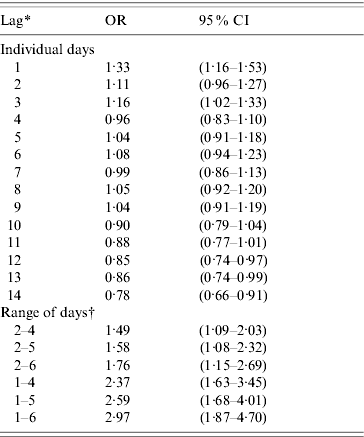
OR, Odds ratio; CI, confidence interval.
The OR represents the odds of a 25·4 mm (average) increase of rainfall on the days included in the lag period preceding an ARI episode compared to the odds of rainfall on the days preceding control days.
* Lag indicates the number of days before illness onset
† Used the average rainfall, temperature, and humidity over the days included in lag period.
Conditional logistic regression
The results of the conditional logistic regression, controlling for average temperature and average humidity (6-day average of days −1 to −6), day of week, and within-season time trends, can be found in Table 3. For all children, the odds of rainfall [average increase of 25·4 mm (1 inch)] in the 6-day interval prior to episodes of ARI were nearly three times higher than the odds of a similar increase in rainfall in the 6-day interval preceding control days. An association between an increase in rainfall and a subsequent ARI in children living in households with ⩾3 people per room was found (OR 3·31, 95% CI 2·03–5·38), while no association was found for households with <3 people per room. When households with ⩾3 people per room were further subdivided, associations for households with ⩾3 to <4, ⩾4 to <5, and ⩾6 people per room were also found, but no association was found for households with ⩾5 to <6 people per room.
Table 3. Association between acute respiratory illness (ARI) and rainfall by household crowding
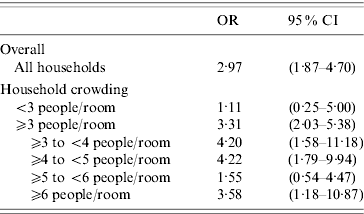
OR, Odds ratio; CI, confidence interval.
The OR represents the odds of a 25·4 mm (average) increase of rainfall on days – 1 to – 6 preceding an ARI episode compared to the odds of rainfall on days – 1 to – 6 preceding control days.
DISCUSSION
In this study, peak ARI activity was found to occur during April and May with a smaller increase in December. The December increase corresponds to the cooler, dryer season in Bangladesh; however, the peak of ARI activity found to occur during April and May corresponds with the period with the highest temperatures, increasing humidity, and the initiation of the rainy season. This study also found that rainfall was more likely to have occurred on days preceding episodes of ARI than on days preceding control days.
The observed peak of ARI corresponded with the peak of influenza A(H3N2) and influenza B virus circulation, which did not occur during periods of continual rainfall when people were potentially spending even more of their time indoors together compared to the early onset period of the rainy season. Influenza viruses have an average incubation period of 2 days (range 1–4) [Reference Cox and Subbarao30], but once a person is exposed to a particular antigenic strain of influenza, immunity is developed and re-infection by the same strain is unlikely [Reference Clements31]. Thus, the lack of ARI transmission sustainability during periods of extended rainfall may be due to rapid transmission and immunity development within households during the onset of the rainy season. While the development of household and community immunity to influenza is only one possible explanation for the ARI infection pattern observed in this study, similar influenza activity patterns have been observed in other populations. During non-influenza pandemic periods, influenza epidemic activity also tends to be limited to a ~2-month period in the USA [32].
The association we found between rainfall and ARI may be indicative of an increase in the amount of time spent indoors with other household members. The increased number of people per room within highly crowded households may further increase the amount of close contact with other family members during periods spent indoors, thus increasing the opportunity for acute respiratory pathogen transmission for children living in those households compared to children living in less densely crowded households. Our study found that the association between rainfall and ARI was stronger in more crowded households; however, it was not consistent across all household densities. The inconsistency found in the stratified analysis for households with ⩾5 to <6 people per room may be a spurious result since it is the only household crowding level with ⩾3 people per room where an association was not found. Another possible explanation may be that more densely populated households have a larger mix of older and younger children, providing some opportunity for some immunity acquisition from prior exposures [Reference Couch and Kasel33].
This analysis included the time period when day-to-day rainfall was relatively sporadic, in an attempt to isolate a period when rainfall was most likely to create a variation in behaviour; however, we did not directly observe behaviour. The number of people per room in the household served as a crude measurement of household density and relied on the assumption that more time was spent indoors during periods of rainfall than during other times. Future studies should consider a more direct measurement of the time household members spend in close proximity to each other. We also analysed longer time periods extending into the rainy season. The significance of the results and the conclusions remained the same during these extended time periods, but the associations were weaker, probably because of less variability in behaviour with respect to the amount of time spent indoors. The use of a case-crossover design ensured that non-temporally varying risk factors for ARI were controlled for, but it is possible that there were other temporally varying explanations for the association found between rainfall and ARI that were not measured in this study, such as other meteorological variables and household practices such as opening or closing windows, which may change household ventilation and possibly change acute respiratory pathogen transmission dynamics. Because the study community itself has a high population density, differentiating between different degrees of crowding within the household is challenging; however, the results of this study suggest that increased household crowding may increase the strength of the association between rainfall and ARI despite the high population density of the community. An additional limitation is that our study was conducted over only one year. It is possible that the relationship found in this study would not have been found during other years because acute respiratory virus activity and influenza activity vary from year to year; however, other influenza virus information available from our study community has shown influenza virus circulation to occur during the pre-rainy and rainy seasons during additional influenza seasons [34, 35].
This was the first study to consider the relationship between rainfall and ARI that assessed whether this relationship differed between children living in households with different levels of crowding, as measured by the number of people per room in the household. Bangladesh provided an ideal setting for studying the seasonality of ARI in tropical climates. The surveillance infrastructure in place in Bangladesh provided a rich source of public health information, including influenza virus isolates, and meteorological data were readily available through the Bangladesh Meteorological Department. Future studies should be conducted to determine if this relationship holds over multiple years and in different tropical settings. Additional studies on factors contributing specifically to influenza and other acute respiratory pathogen transmission are also needed.
ACKNOWLEDGEMENTS
We thank the staff at the Kamalapur field site and at ICDDR,B for their hard work collecting and entering the data used in this study. This study was supported by the National Vaccine Program Office, US Department of Health and Human Services, Achievement Rewards for College Scientists, Emory University Graduate School of Arts and Sciences Fund for Internationalization, Rollins School of Public Health Global Field Experience and Anoopa Sharma Awards.
The findings and conclusions in this report are those of the authors and do not necessarily represent the official position of the ICDDR,B, Emory University, or the Centers for Disease Control and Prevention.
DECLARATION OF INTEREST
None.


