1. Introduction
A vortex ring is a toroidal-shaped region within a fluid where the majority of the fluid is spinning around an invisible, looped axis. A typical vortex ring can be characterized by its propagation velocity, ring radius, and vortex core radius. As the fluid revolves intensely around the circular vortex centreline, generating significant circulation, the vortex ring can remain stable over a long distance in its propagation direction without being dissipated. The existence of vortex rings can be observed in both nature and engineering fields. Cigarette smoke rings may be the most common examples that people are familiar with (Lim & Nickels Reference Lim and Nickels1995). They are formed when smoke is quickly exhaled through the lips of a smoker, forming a circular shape. Volcanic vortex rings can be observed at places like Etna in Italy (Pulvirenti et al. Reference Pulvirenti, Scollo, Ferlito and Schwandner2023). They are rings of ash and gas that are created by the eruptions of a volcano. The propulsive action of some aquatic creatures, like jellyfish, and the blood discharged from the atrium to the ventricular cavity can generate a vortex ring (Gharib, Rambod & Shariff Reference Gharib, Rambod and Shariff1998). Recently, dandelions have been discovered to use a separated vortex ring created by their pappus’ structure to effectively disperse seeds over great distances (Cummins et al. Reference Cummins, Seale, Macente, Certini, Mastropaolo, Viola and Nakayama2018). In practice, vortex rings can be generated through injecting fluid at a high velocity from a circular opening (Walters & Davidson Reference Walters and Davidson1963; Gharib et al. Reference Gharib, Rambod and Shariff1998; Gao et al. Reference Gao, Yu, Ai and Law2008; Limbourg & Nedić Reference Limbourg and Nedić2021). Potential applications have been developed based on the characteristics of vortex rings. By ‘freezing’ vortex rings at controlled stages, uniquely shaped particles can be created for use in applications such as cell encapsulation and three-dimensional (3-D) cell culture (An et al. Reference An, Warning, Yancey, Chang, Kern, Datta, Steen, Luo and Ma2016). Meanwhile, vortex rings can promote the non-contact transportation of colloidal microparticles due to their prolonged existence (Gulinyan et al. Reference Gulinyan, Kuzikov, Podgornyi, Shirkin, Zakharov, Sadrieva, Korobkov, Muzychenko and Kudlis2023).
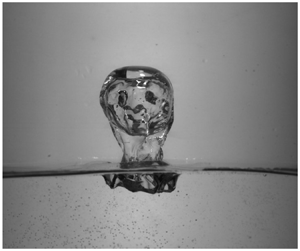
While vortex rings typically refer to single-phase phenomena, toroidal bubbles (TBs), or ring bubbles, represent cases with a gas–liquid interface where a gas vortex ring is encased within a liquid vortex ring. Arguably, the most frequently observed TBs occur when dolphins expel air from their blowholes. A lab apparatus constructed to generate TBs emulates this specific process, as detailed by Lesage et al. (Reference Lesage, Kemiha, Poncin, Midoux and Li2016). TBs can serve as effective media for mass conveyance, process mixing, noise reduction and reaction regulation, as suggested in previous research studies (Mazumdar & Guthrie Reference Mazumdar and Guthrie1995; Domon, Ishihara & Watanabe Reference Domon, Ishihara and Watanabe2000; Spratt et al. Reference Spratt, Lee, Wilson and Wochner2013; Moon, Song & Kim Reference Moon, Song and Kim2023).
A number of research studies have been carried out on the characteristics of the TBs. The upward movement of a TB is mainly driven by buoyancy. It has been revealed that, under the influence of buoyancy, the circulation of a TB remains essentially constant as it travels within a singular liquid medium (Turner Reference Turner1957). Over time, the ring radius of the TB increases and, as a result of volume conservation, its core radius gradually decreases. In their research, Walters & Davidson (Reference Walters and Davidson1963) investigated the transformation of a distorted spherical gas bubble into a TB. Lundgren & Mansour (Reference Lundgren and Mansour1991) used numerical and model analysis to investigate the formation, motion and behaviour of TBs under the influence of gravitational forces and surface tension. Cheng, Lou & Lim (Reference Cheng, Lou and Lim2013) used the lattice Boltzmann method to find that the TB growth and deceleration in the viscous fluid are interrupted by instability, leading to breakup into smaller bubbles. Vasel-Be-Hagh, Carriveau & Ting (Reference Vasel-Be-Hagh, Carriveau and Ting2015a) experimentally investigated the impact of dimensionless surface tension on various characteristics of a TB produced by an underwater bursting balloon. A perturbation analysis was then carried out by Vasel-Be-Hagh et al. (Reference Vasel-Be-Hagh, Carriveau, Ting and Turner2015b) to involve buoyancy and viscosity effects, providing a method to calculate drag coefficients in TBs at different Bond numbers. Yan, Carriveau & Ting (Reference Yan, Carriveau and Ting2018) established parameters for classifying TBs as laminar, transitional or turbulent based on experiments and analysis. Chang & Smith (Reference Chang and Smith2018) provided a model to factor buoyancy in thin TB's motion, attributing local acceleration of axial flow to gravity-induced external pressure gradients. Then, Chang & Smith (Reference Chang and Smith2020) used a reduced-order model to study the motion of a TB with a non-negligible core size.
Generally, the impacts of diverse interfaces, including solid walls, interfaces and free surfaces, on fluid flows constitute some of the key issues in the domain of fluid mechanics. For example, Madnia & Bernal (Reference Madnia and Bernal1994) examines the interaction of a turbulent jet with a free surface, finding that it generates surface waves and reduces the decay rate of the maximum mean velocity due to confinement. Previously, researchers have explored phenomena concerning vortex ring collisions with solid walls (Dommermuth & Yue Reference Dommermuth and Yue1991; Orlandi & Verzicco Reference Orlandi and Verzicco1993; Cheng, Lou & Luo Reference Cheng, Lou and Luo2010), interfaces (Linden Reference Linden1973; Dahm, Scheil & Tryggvason Reference Dahm, Scheil and Tryggvason1989; Stock, Dahm & Tryggvason Reference Stock, Dahm and Tryggvason2008; Advaith et al. Reference Advaith, Manu, Tinaikar, Chetia and Basu2017; Olsthoorn & Dalziel Reference Olsthoorn and Dalziel2017; Song, Choi & Kim Reference Song, Choi and Kim2021; Wang & Feng Reference Wang and Feng2022) and free surfaces (Dommermuth & Yue Reference Dommermuth and Yue1991; Song, Bernal & Tryggvason Reference Song, Bernal and Tryggvason1992; Ruban Reference Ruban2000; Wang, Duan & Wang Reference Wang, Duan and Wang2015). Meanwhile, investigations have also been made concerning interactions between spherical bubbles and free surfaces (Boulton-Stone & Blake Reference Boulton-Stone and Blake1993; Duchemin et al. Reference Duchemin, Popinet, Josserand and Zaleski2002). Recently, Moon et al. (Reference Moon, Song and Kim2023) examined the dynamics of TBs crossing the interface between two immiscible liquids using experimental methods. However, to the knowledge of the authors, no systematic studies have been reported on the interaction between a TB and a free surface.
This work focuses on the interactions between a TB of air and a free surface. We identify through high-speed photography strong and weak interactions in terms of the maximum deformation of the free surface during the interactions. Then, we develop a numerical simulation technique based on the volume of fluid (VOF) method on the OpenFOAM platform for the TB–free surface interactions. Combining the experimental and numerical results, we verify that the Froude number, $Fr$, determines the main characteristics during the interaction process. By adopting the energy balance conditions, we derive a scaling of the maximum deformation of the free surface against $Fr$ and the slenderness of the TB at a reference position.
2. Experimental set-up
In the current research, we employ an experimental set-up based on previous works by Vasel-Be-Hagh et al. (Reference Vasel-Be-Hagh, Carriveau, Ting and Turner2015b), Lesage et al. (Reference Lesage, Kemiha, Poncin, Midoux and Li2016) and Yan et al. (Reference Yan, Carriveau and Ting2018); Moon et al. (Reference Moon, Song and Kim2023) (see also figure 1) to generate TBs and study their interactions with a free liquid/air surface. The experimental tank is constructed from acrylic glass and has a square cross-section measuring $800\,{\rm mm} \times 800\,{\rm mm}$, with a height of 1200 mm. This choice of tank size ensures that the effects of sidewalls on the behaviour of TBs are minimized. The tank is filled with liquid to heights $H=500\unicode{x2013}1000\,{\rm mm}$. At the bottom of the tank, a TB generator, consisting of a cylinder with a small opening at its top, is installed (figure 1c). The properties of the three liquids used in the experiments, water and two different aqueous glycerol solutions (AGS 1 and AGS 2), are at $22\,^{\circ }{\rm C}$, as shown in table 1. The principle of the TB generator is briefly described here. Compressed air of desired pressure is supplied from a high-pressure gas cylinder into the generator via a computer-controlled solenoid valve. A TB is then generated from the air release at the opening at the top of the bubble generator once the solenoid valve is opened for a short period of time. By regulating the air pressure (68 950–206 850 Pa gauge pressure) and the opening time period of the solenoid valve (5–30 ms), TBs of various sizes and propagation speeds are created.
$^{a}$AGS: aqueous glycerol solution.
The evolution of the TB and the interaction between the TB and the free surface are recorded by a high-speed camera (Phantom V711, Vision Research, USA or I-Speed 726R, iX Cameras, UK) at a frame rate of 5000 frames per second (f.p.s) with a spatial resolution of $151\unicode{x2013}217\,\mathrm {\mu }{\rm m}\,{\rm pixel}^{-1}$. A light-emitting diode (LED) plate light source (200 W) is employed as a backlight, positioned opposite to the high-speed camera to enhance the contrast of images. Additionally, a spotlight is positioned above the tank and directed downwards to illuminate the bubble–liquid interface.
Given the assumption that the bubble takes on a circular toroidal form, its shape is defined by the ring radius $R$ and the vortex core radius $a$. The volume of the TB, $V_b$, is then estimated as $V_b = 2 {\rm \pi}^2 R a ^2$. The propagation speed of the bubble is represented as $U$. It should be noted that the values of $R$, $a$ and $U$ vary as the bubble rises in the liquid. In the experiments, we define the ring radius, core radius, volume and propagation speed of the bubble at $t=t_{{ref}}$ as reference values $R=R_{{ref}}$, $a=a_{{ref}}$, $V_b = V_{b,{ref}}$ and $U=U_{{ref}}$, respectively (figure 1b). At this instant, the uppermost point of the TB is positioned at $2 R_{{ref}}$ below the horizontal free surface, where the deformation of the free surface caused by the bubble is negligible. We then measure $R=R_{{ref}}$ and $a=a_{{ref}}$ directly from the calibrated high-speed images, with the uncertainty of 1 pixel. The reference propagation speed of the bubble $U_{{ref}}$ is calculated by the central difference scheme using the vertical positions of the ring's centre from high-speed images at $t=t_{{ref}}$.
As proposed by Lamb (Reference Lamb1932) and experimentally proven by Moon et al. (Reference Moon, Song and Kim2023), the circulation of the vortical flow around the TB in a single liquid can be estimated analytically as
which strongly influences the dynamics of the TB. The reference circulation at $t=t_{{ref}}$ is denoted as ${\varGamma }_{{ref}}$.
It has been shown that $Fr$, which measures the ratio between the inertial and gravitational forces for a single-phase vortex ring, is crucial in characterizing the interaction between the vortex ring and a density-stratified interface (Linden Reference Linden1973; Dahm et al. Reference Dahm, Scheil and Tryggvason1989; Stock et al. Reference Stock, Dahm and Tryggvason2008; Advaith et al. Reference Advaith, Manu, Tinaikar, Chetia and Basu2017; Olsthoorn & Dalziel Reference Olsthoorn and Dalziel2017; Song et al. Reference Song, Choi and Kim2021; Wang & Feng Reference Wang and Feng2022). Hence, following the study by Moon et al. (Reference Moon, Song and Kim2023), we define the Froude number for a TB as
where $g$ is the gravitational acceleration. To identify the different interaction types between the TB and the free surface, a wider range of $Fr$ values, $Fr = 0.80\unicode{x2013}13.64$, is selected compared with the range used by Moon et al. (Reference Moon, Song and Kim2023). We acknowledge in the following sections that in the present experiments, the major dynamics of the interactions are determined by the value of $Fr$.
Additionally, since different liquids are used in the experiments, we also define the Bond number, $Bo = {\rho g D_{{eq}}^2}/{\sigma }$, and Archimedes number, $Ar = {\rho g^{1/2} D_{{eq}}^{3/2} }/{\mu }$, of the TB to measure the ratios between the gravitational force and the surface tension, and the gravitational force to viscous force, respectively. Here, $\rho$ and $\mu$ are the density and the viscosity of the liquid, respectively, and $\sigma$ is the surface tension coefficient for the free surface between the air and the liquid. The equivalent diameter of the bubble $D_{{eq}}$ is calculated by $D_{{eq}} = {{6 V_{b,{ref}}^{1/3}}/{{\rm \pi} }}$ (Moon et al. Reference Moon, Song and Kim2023). In the present study, by varying the bubble sizes and the liquid types, the ranges of $Bo$ and $Ar$ for water are $4.96\times 10^1\unicode{x2013}1.61\times 10^3$ and $1.50\times 10^4\unicode{x2013}9.35\times 10^4$, respectively; for AGS 1 are $3.25\times 10^2\unicode{x2013}7.63\times 10^2$ and $4.33\times 10^3\unicode{x2013}7.96\times 10^3$, respectively; and for AGS 2 are $3.79\times 10^2\unicode{x2013}1.20\times 10^3$ and $7.57\times 10^2\unicode{x2013}1.39\times 10^3$, respectively. In § 4.1, we present the comparison of the interactions with three liquids considering the values of $Bo$ and $Ar$.
To compare the dynamics of interactions for different cases, we introduce a dimensionless time $t^*$ as
where $t_0$ represents a certain moment in the interaction process. We hereby define $t_0=t_{{ref}}$ for convenience of discussions in the following sections. The acquired high-speed image sequences, as well as the subsequent data analysis related to the dynamics of interactions, are then organized in terms of $t^*$.
The measurement error of bubble dimensions obtained from the image, such as $R$ and $a$, is less than 0.5 pixels (corresponding to $\sim$0.1 mm in physical dimension). The propagation speed of the TB, $U$, is obtained by differentiating after fitting its position in multiple frames of high-speed images, with an uncertainty of less than $5\,{\rm mm}\,{\rm s}^{-1}$ ($1.7\,\%$).
3. Numerical method
We perform numerical studies for TBs in water for analysis. The OpenFOAM platform is used for conducting numerical simulations. The fluids of the two phases, including air and water, are considered to be incompressible and immiscible. Heat and mass transfers between the phases are disregarded (McQuaid et al. Reference McQuaid, Kolaei, Bramesfeld and Walsh2020; Hu & Peterson Reference Hu and Peterson2021; Terrington, Hourigan & Thompson Reference Terrington, Hourigan and Thompson2022). The governing equations of both phases are given by the mass and momentum conservation laws as
where $\boldsymbol {u}=\boldsymbol {u}_l\alpha +\boldsymbol {u}_g(1-\alpha )$ and $p$ are the velocity and pressure, respectively, where the subscript $l$ refers to liquid and $g$ to gas, and $\alpha$ is the volume fraction of the liquid phase; $\boldsymbol {I}$ is the unit tensor; density $\rho =\rho _l\alpha +\rho _g(1-\alpha )$, where $\rho _l=1000\,\text {kg}\,\text {m}^{-3}$ and $\rho _g=1.0\,\text {kg}\,\text {m}^{-3}$; viscosity $\mu =\mu _l\alpha +\mu _g(1-\alpha )$, where $\mu _l=1.0\times 10^{-3}\,\text {Pa}\,\text {s}$ and $\mu _g=1.48\times 10^{-5}\,\text {Pa}\,\text {s}$; and $\boldsymbol {g} = 9.81\,\text {m}\,\text {s}^{-2}$ is the gravitational acceleration. The last term on the right-hand side of (3.2), $\boldsymbol {f}_{\delta }$, denotes the surface tension term calculated based on the continuous surface force (CSF) method, with a surface tension coefficient $\sigma =0.072\,\text {N}\,\text {m}^{-1}$ (Brackbill, Kothe & Zemach Reference Brackbill, Kothe and Zemach1992).
To capture the interface of TB, the VOF method is used. In this study, we adopt the OpenFOAM-based solver InterFOAM, which implements a modified two-phase formulation
where $\boldsymbol {u}_r=\boldsymbol {u}_l-\boldsymbol {u}_g$ is the relative velocity between the two phases (Russo et al. Reference Russo, Icardi, Elsharkawy, Ceglia, Asinari and Megaridis2020). This new formulation gives rise to an additional convective term, which is due to the representation of the velocity terms as weighted averages.
The finite volume method is employed to solve the equations. Time and space discretizations are realized with the Euler scheme. The gradient and Laplacian terms are discretized by the Gauss method. The coupling between pressure and velocity is dealt with by the transient PIMPLE algorithm, which is a merged PISO-SIMPLE (pressure implicit split operator-semi-implicit method for pressure-linked equations) algorithm.
To reduce the calculation load, considering the axisymmetric characteristics of the TB, we define a wedge-shaped computational domain with $1^{\circ }$ in the circumferential direction (Ren et al. Reference Ren, Li, Xu, Wakata, Liu, Sun, Zuo and Liu2022; Wang et al. Reference Wang, Liu, Li, Zuo and Pan2022), as is shown in figure 2. The domain is $200\,\text {mm}$ in the radial direction and $1200\,\text {mm}$ in the axial direction, and it contains a 1000 mm deep water column and a TB generator consistent with the experimental geometry. The fluid domain is discretized into a grid system, where the grid in the central portion has been further refined. After the grid independence test, the minimum grid spacing selected for the calculations is $\Delta x = 0.25\,{\rm mm}$, resulting in a total of 879 660 grids. To maintain numerical stability, the adjustable time step $\Delta t$ is chosen to satisfy the Courant number $|u|\Delta t/\Delta x \leq 0.1$, where $|u|$ is the magnitude of the fluid velocity.
All the solid boundaries are defined as no-slip boundaries, and the top of the domain is set as a pressure opening with $p_0=101\,325\,\text {Pa}$. A cylindrical air pocket with a hemispherical cap is initially situated at the TB generator. To simulate the generation of the TB, we pressurize the generator with compressed air and specify varying combinations of pressure and time periods for the ventilation condition at the bottom of the generator ($p_1$ and $t_1$ in figure 2b). The calculation results are verified against particular experimental cases. Then additional cases are investigated with a wider parameter range for analysis.
4. Results and discussion
The discussion in this section is organized as follows. First, we provide high-speed photographic image results of the TB–free surface interactions at different $Fr$ value conditions from the experiments and analyse the characteristics of the interactions and the free surface deformation. Then, based on the numerical calculation results, we explore the flow field details in cases of different interactions and summarize the characteristics of the variation of ring radius $R$ of TBs. On this basis, we analyse the flow field characteristics caused by the TB, and establish the flow field model of TB movement in a single liquid, as well as the TB–free surface interaction model. With the help of the energy balance consideration, we finally derive the scaling law of the maximum deformation of the free surface against the $Fr$, and summarize the parametric plot of the interactions.
4.1. Overview of interactions between TBs and free surfaces
We first identify two different types of interactions – namely strong and weak interactions – between the TBs in water and the free surface, depending on the normalized magnitude of the free surface deformation. For each interaction type, we examine both the deformation of the free surface and the behaviours of the TBs as below.
Figure 3 shows an example of high-speed images of strong interactions, with non-dimensional parameter $Fr=7.15$, $Bo=1.18\times 10^2$ and $Ar=2.21\times 10^3$. It is seen that when the TB resides below the reference position, the free surface has no significant deformation. The bubble appears to be relatively unstable, noticeable through the presence of undulating wrinkles on its surface ($t^*=0$). As the bubble approaches the free surface, the free surface gradually deforms into an ellipsoidal cap ($0< t^*<6.84$). The distance between the uppermost point of the ellipsoid and the position of the initial free surface is denoted as $h$. Subsequently, the bubble continues its ascent and surpasses the initial position of the free surface, carrying the ellipsoidal cap-shaped volume of water around the bubble upwards ($6.84< t^*<17.07$). The TB then narrows under horizontal compression while elongating in the vertical direction while reaching its highest position ($h_{max}=48.6$ mm), characterized by a nearly half-circle-shaped toroidal core. This causes the water volume surrounding the bubble to form a spherical droplet. A water column with a narrowing ‘neck’ is created beneath the bubble, connecting the water sphere to the water bath ($17.07< t^*<26.89$). We classify cases with $h_{max}^*= h_{max} /R_{{ref}}>1$ as strong interactions between the TBs and the free surface. It is also observed that during this stage, a ring of the free surface around the droplet sinks, forming a vertical, annular, thin gas layer, as indicated in figure 3. At $26.89< t^*<41.86$, the sphere enclosing the bubble descends and impacts the water surface. As a result of this impact, the free surface starts oscillating. Eventually, the bubble bursts at the free surface and creates an oblique upward water jet due to flow focusing at the bottom of the bubble ($41.86< t^*<63.48$).
Another case of strong interactions is exemplified in figure 4, where $Fr=4.02$, $Bo=2.18\times 10^2$ and $Ar=2.69\times 10^4$. Compared with the case in figure 3, at a smaller $Fr$ value, the TB appears more slender with a larger $R/a$ ratio and possesses a smoother surface at the reference position ($t^*=0$). Furthermore, the TB experiences milder deformations in both horizontal and vertical directions as the liquid surface deforms and rises to the highest level ($h^*_{max}=1.54$), leading to an ellipsoidal shape of the liquid droplet that encapsulates the bubble ($0< t^*<13.44$). As the majority of the ellipsoid rises above the initial position of the free surface, it remains connected to the water bath through a narrow neck. Meanwhile, portions of the free surface around the ellipsoid are drawn into the liquid pool and fragment into small bubbles. By observing the motion of these small bubbles, it becomes apparent that there exists a liquid vortex ring beneath the liquid surface, rotating in the opposite direction to the TB. The ellipsoid encapsulating the TB then falls and impacts the liquid pool, resulting in oscillations of the liquid surface and the rupture of the bubble at the liquid surface. Subsequently, in comparison to the liquid jet in the case in figure 3, a conical surface protrusion is generated, suggesting a less intense interaction between the bubble and the free surface as well ($13.44< t^*<31.90$).
At even smaller $Fr$ values, weak interactions between the TB and the free surface occur. As shown in figure 5, with non-dimensional number $Fr=2.94$, $Bo=8.21\times 10^2$ and $Ar=6.19\times 10^4$, the TB possesses an even larger $R/a$ ratio and smoother surface at the reference position ($t^*=0$). The TB does not ascend to a sufficient height when the deformed free surface reaches its apex. As a result, the ellipsoid enveloping the bubble remains incomplete, with only half of it extending above the free surface, and the ‘necking’ phenomenon does not occur ($t^*=11.81$). In this case, we also observe the entrainment and breakups of the surrounding free surface, or the formation and breakups of a secondary TB, during the oscillations of the ellipsoid, owing to the existence of the counter-rotating liquid vortex ring, as indicated in the figure ($11.81< t^*<18.89$). After the falling of the ellipsoid, the TB ruptures as it ‘bounces off’ the free surface, resulting in a small bulge at the centre of the TB on the free surface ($18.89< t^*<27.07$).
Figures 6 and 7 show two more weak interaction cases where the bubbles do not rise across the initial free surface position, with non-dimensional numbers $Fr=0.96$, $Bo=1.21\times 10^3$ and $Ar=5.59\times 10^4$, and $Fr=0.86$, $Bo=9.99\times 10^2$ and $Ar=5.10\times 10^4$, respectively. When the TB approaches the free surface, the surface experiences a mild deformation, for the case in figure 6. The upper part of the free surface elevates slightly, while the surrounding area sinks, forms secondary TBs and then fragments into multiple bubbles. Eventually, the TB breaks up near the free surface due to instabilities. In contrast, for the case shown in figure 7, there is no noticeable deformation observed in the free surface during the interaction.
Figure 8 shows the evolution of the deformation of the free surface with time during the TB–free surface interactions. From figure 8(a), it can be seen that the maximum non-dimensional height $h^*$ of the free liquid surface decreases with the decrease of $Fr$. In the case of large $Fr$, the time $t^*$ when the liquid surface reaches the maximum height is later. Meanwhile, in the four cases, the rising and falling of the free surface are not symmetrical in time, with the falling being slightly faster than the rising. Additionally, we plot normalized $h^*$, i.e. $h^*/h_{max}^*$, against $t'=(t-t_{h=h_{max}})/\sqrt {h_{max}/g}$ in figure 8(b) to better compare the deformation of the free surface during the interactions, where $\sqrt {h_{max}/g}$ represents a characteristic time scale of the vertical projectile motion. Hence, $t'=0$ corresponds to the time when the free surface reaches the maximum height. It can be seen that the curves in the four cases share similar shapes, but they do not completely collapse. The curves all slightly deviate from the shape of a parabola of a vertical projectile motion ($h^*/h^*_{max}=1-t'^2/2$), which implies that we can make simplifications accordingly in our subsequent discussion of scaling laws. The curves with smaller $Fr$ have less steep slopes. The two curves with closer values of $Fr$ are more similar, indicating that $Fr$ partly determines the normalized behaviour of the free surface during the interaction process.
In addition, we compare the high-speed photographic results of TB–free surface interactions in the three experimental liquids, as shown in figure 9. Panels (a), (b) and (c) present the results in water, AGS 1 and AGS 2, respectively. The $Fr$ values of the three cases are similar, the values of $Bo$ are of the same order of magnitude, while the values of $Ar$ are one order of magnitude smaller in sequence. Overall, the size of the TB and the displacement of the free surface in the three cases are similar. In fact, as summarized in table 2 for five cases of similar sizes in the three liquids, the variation of $\mu$ does not have a great influence on the normalized maximum deformation of the free surface $h_{max}^* = h_{max} /R_{{ref}}$ during the TB–free surface interactions. The corresponding evolution of the free surfaces for the cases are shown in figure 10. It should be noted that due to the inherent randomness in the experiment, the five curves do not completely collapse. Moreover, under comparable $Fr$ and $Bo$, the amplitude of the curves does not exhibit a monotonic change with $Ar$. However, as the viscosity of the liquid increases, that is, the $Ar$ value decreases, the surface of the TB appears smoother. At the same time, due to the effect of viscous dissipation, the secondary TB generated after the free surface is pinched off is smaller in size and smoother in surface.
Now that the influences of $Ar$ and $Bo$ by $\mu$ on the dynamics of the interactions have been investigated, we further select two groups of data from both experiments and numerical simulations for comparison, to better illustrate the effect of the bubble size, as shown in tables 3 and 4, respectively. In the first group, the $Fr$ value is roughly 3.60, but the volume of the bubbles $V_b$ spans from approximately 90 ml to approximately 360 ml, resulting in a $Bo$ value in the range of $4.78\times 10^2\unicode{x2013}8.71\times 10^2$ and $Ar$ value in the range of $4.32\times 10^3\unicode{x2013}8.74\times 10^4$. In the second group, the $Fr$ value is roughly 6.90. The volume of the bubbles in the experiments are approximately 40 ml and 80 ml. Considering the limited bubble size range in the experiments due to the restriction of the experimental set-up, we perform additional numerical simulations of large-sized TBs by simultaneously increasing the size of the TB generator and the ventilation time period. Here, we added the numerical results of a much larger bubble (volume approximately 5000 ml), but with a similar $Fr$ value, to the second group for comparison. Thus, the $Bo$ value range of the second group is $1.29\times 10^2\unicode{x2013}7.25\times 10^3$, and $Ar$ value range is $2.60\times 10^4\unicode{x2013}5.38\times 10^5$. It can be seen that $h_{max}^*$ of each group is roughly equivalent. This feature is further demonstrated in figure 11, where the $h^*$–$t^*$ curves are mainly grouped by the value of $Fr$, regardless of the values of $Bo$ or $Ar$. This indicates that the influence on the TB–free surface interactions caused by bubble size variation is limited. That is, within the ranges of $Bo$ and $Ar$ variation in this study, the major characteristic of the interactions discussed in subsequent sections, particularly $h_{max}^*$, is mainly determined by the $Fr$ value.
4.2. Flow characteristics during TB–free surface interactions
In this section, we first validate the numerical methods through the comparison of numerical calculations and experimental results. Then, we analyse the results of numerical calculations and discuss the dynamics of the TBs and free surface during both types of interactions in detail.
Examples of the simulated results using the above numerical method, compared with experimental images for both strong and weak TB–free surface interactions ((a) $Fr=7.37$, $Bo=2.82\times 10^2$, $Ar=3.05\times 10^4$; and (b) $Fr=1.77$, $Bo=7.64\times 10^2$, $Ar=6.43\times 10^4$), are shown in figure 12. In each panel of the figure, the left half represents numerical results, whereas the right half shows experimental images at the corresponding time. In the computational results, the light-coloured area indicates the gas phase, while the dark area indicates the liquid phase. From the figure, it can be seen that the computational results accurately replicate the primary characteristics observed during the entire experiment of TB–free surface interaction, such as the evolution of free surface deformation over time. In addition, the computation also predicts the emergence of secondary TB. However, due to the adoption of an axisymmetric computational domain, the details of secondary TB movement and rupture in the experiment cannot be accurately given in the current computation. It should be noted that since the calculations cannot precisely set the boundary conditions at the outlet position of the TB generator in the experiments, we need to attempt different $p_1$ and $t_1$ combinations in the calculations to adjust the TB volume and shape obtained in the calculations so that it closely matches the experiments at the reference position.
The calculation results of the flow field in the strong interaction process for the experimental case shown in figure 3 are demonstrated in figure 13. When the TB is at the reference position, i.e. $t^*=0$, the free surface has already shown slight deformation. This is due to the fact that the velocity of the liquid vortex ring around the TB has become large enough at the central axis. It is seen that the core of the TB is elongated vertically. Subsequent calculated evolution of the free surface matches the experimental observations. When the free surface rises, the TB is further stretched vertically. When the free liquid surface reaches its maximum deformation, the TB further deforms, with the bottom radius shrinking more than the top, and rotates along the motion of the liquid vortex ring. Afterwards, the free surface begins to fall back, and the TB extends outward along the free surface during this process. Furthermore, under the combined influence of the free surface oscillation and the motion of the liquid vortex ring, the generation and movement of secondary TB can be observed.
In contrast, figure 14 illustrates the calculated flow field characteristics during the weak interaction process for the case in figure 12(b). Again, at $t^*=0$, even though the deformation is not visible on the free surface, it can be seen from the flow field that the liquid vortex ring around the TB has already made contact with the free surface. However, the velocities at the points of contact have become insignificant. Compared with cases of strong interactions (e.g. figure 13), the core of the TB at this instant is more spherical. As the TB rises beneath the free surface, its radius gradually increases. At $t^*=6.72$, the TB has risen to a position closer to the original liquid surface level. Its radius increases and its core size decreases. When the free surface reaches its highest position ($t^*=8.40$), the sinking edge around its raised part is almost level with the height of the TB. This means that throughout the weak interaction process, the height of TB has never exceeded the position of the initial free surface. At this instant, the flow velocities in the entire liquid are comparatively low. When the free surface begins to recover from the maximum height, the TB is further elongated under the joint action of the liquid vortex and the free surface ($t^*=10.92$). The previously sunk part of the liquid surface is laterally squeezed by the liquid under it, thus forming a secondary liquid vortex ring rotating in the opposite direction on the outer side of the original one ($t^*=13.44$). If this portion of the free surface is sufficiently deep, it may also involve air into the vortex core of the secondary liquid vortex ring, or free surface ’pinch-off’, forming a secondary TB, which is less stable due to the smaller circulation. The interaction between the two vortices induces complex motion of the TBs if they are present. The disturbances of the free surface then progressively diminish as the circumferential motions of the two vortices steadily weaken, resulting in the breakdown of the TBs ($t^*=15.96$).
Next, we investigate the flow field caused by a TB in a single liquid with numerical results. Figure 15 shows an example of the flow field in the reference frame of the laboratory for the case in figure 5 when TB has not yet interacted with the liquid surface. As can be seen from the figure, there exists a liquid vortex ring around the TB, constituting the circulation around the TB, or $\varGamma$. Under the effect of $\varGamma$, the TB retains its annular shape and rises with the liquid vortex ring. Additionally, it can be observed that the pressure distribution within the entire flow field is only slightly affected by the TB motion, primarily displaying the distribution characteristics of hydrostatic pressure.
Thus, the entire flow field can be divided into two regions. The first is the liquid ellipsoid containing the liquid vortex ring and the TB. Within this ellipsoid, the liquid is circulating the TB while the ellipsoid has a uniform upward propagation velocity $U$. Beyond this ellipsoid, the liquid remains almost stationary. This observation is further confirmed in figure 16(a–c), where we plot the relative velocities $u_r$ of the fluid in reference to the propagation velocity $U$ of the TB. Furthermore, at three different times, $t_1 < t_2 < t_3$, $R$ of the TB gradually increases, while $a$ gradually decreases. In figure 16(d), we plot the distribution of the normalized relative circulating fluid velocity component $u_{cr}^*=(u_c-U)/U$ along the horizontal line passing through the core centre of the TB at the three moments together, where $u_c$ is the circulating velocity component of the liquid around the TB, and $U$ is the propagation velocity of the TB. The $x$-axis in the figure is normalized to $x^*=(x-R)/a$. In this figure, the white colour marks the bubble region. Given the propagation velocity $U$ of the TB evolution shown in Appendix A, and that the curves for the three moments almost collapse, it is seen that the flow at different moments is self-similar.
With such observations, we establish the relative flow model as shown in figure 16(e), where the geometry of the ellipsoid is approximated. We further assume that the circulating velocity component of the liquid around the TB $u_c$ satisfies the following equation when $|x| > R$:
where $r$ denotes the distance between the nearest core centre and the point of interest in the liquid. By (4.1), it is seen that
as indicated with a dashed curve in figure 16(d). Note that this approximation matches the analytical conditions used by Orlandi & Verzicco (Reference Orlandi and Verzicco1993), and the initial flow conditions in calculating vortex ring motions of Cheng et al. (Reference Cheng, Lou and Luo2010, Reference Cheng, Lou and Lim2013). At locations with $|x| < R$, the changes in the relative velocity at different phase angles $\theta$ are quite complex. Nevertheless, it is verified in Appendix A with numerical results that kinetic energy from the circular motion of the liquid $E_c$, where $|x|< R$ is with a nearly fixed ratio (close to unity) against $|x|>R$.
Now, we consider the energy ratio, the evolution of the circulation and shape of a TB in a single liquid. Combining the expression for $\varGamma$ in (2.1), the ratio of kinetic energy from the circular motion of the liquid $E_c$ compared with that of the propagation motion of the ellipsoid $E_k$ can thus be expressed as
where $\zeta =({r}/{a})^2$, $\eta = {R}/{a}$ is the shape factor of the TB that defines its slenderness, and $V_e$ is the volume of the ellipsoid. Note that $Ec$ of the region of $|x|< R$ is included by setting the upper limits of $\theta$ and $\phi$ to $2 {\rm \pi}$ in this integration formula. From (4.3), it is seen that this ratio relies solely on $\eta$. For the sake of convenience, we derive an estimated fit of ${E_c}/{E_k}$ against $\eta$ of TBs in a single liquid to the numerical solutions of (4.3) as
as shown in figure 17(a). In comparison to the kinetic energy associated with the propagation motion of the ellipsoid $E_k$, the component $E_c$ appears to be less considerable, particularly noticeable in the instant of large values of $\eta$.
According to Walters & Davidson (Reference Walters and Davidson1963), the circulation $\varGamma$ of an upward-moving TB in a single quiescent liquid domain can also be estimated in terms of its volume $V_b$ as
Note that $V_b = 2 {\rm \pi}^2 R a^2$, so from (2.2), we obtain
where $Fr_i$ indicates the instantaneous value of the Froude number. The validation of this relation is provided against present experimental measurements in all three liquids with different viscosities, as shown in figure 17(b), although the estimation in (4.5) is, by definition, more applicable in low-viscosity liquids. The shape factor of TBs, $\eta$, is inversely proportional to the Froude number $Fr_i$. As a TB rises in the liquid, it becomes more slender in shape, while the corresponding $Fr_i$ decreases gradually. Note here the Froude number $Fr_i$ is applicable to the entire process of the TB's movement in a single liquid.
In figure 18, we present the evolution of $R/R_{ref}$ and $h^*$ with respect to $t^*$ of TBs during the TB–free surface interaction with six different $Fr$ values, where the strong and weak interactions can be readily distinguished. Note that in figure 18(b), the dashed line indicates the limiting condition of $h_{max}^*=1$. At $t^*<0$, i.e. prior to the TB–free surface interaction according to the definition in the preceding sections, the four cases with high-$Fr$ values (7.37–4.26) shown in the figure are markedly different from the other two cases ($Fr=2.67$ and 1.63). In all cases, $R/R_{ref}$ increases with time, but with different slopes, among which the curves corresponding to weak interactions have a larger slope. This indicates that the deceleration effect of the existence of the free liquid surface on the TB at $t^*<0$ is relatively large for weak TB–free surface interactions.
When $t^*>0$, i.e. when the TB rises above the reference position, the difference between strong and weak interactions becomes larger. In cases with larger $Fr$ values, when the TB is still below the free surface, $R/R_{ref}$ gradually increases. However, as the TB continues to rise through the original free surface position, due to the influence of the surrounding finite liquid environment, $R/R_{ref}$ of the TB begins to shrink. Note that this observation is similar to that of Moon et al. (Reference Moon, Song and Kim2023). When the raised free surface along with the TB hits back down, $R/R_{ref}$ has a trend of increasing again, rendering a more slender TB shape until it ruptures. In contrast, in weak interactions, the TB never exceeds the position of the original free surface, and the deformation of the free surface is also smaller. In these cases, the TB rebounds at the free surface, and its $R/R_{ref}$ accelerates to increase. A smaller $Fr$ value means the more it resembles the case where the liquid vortex ring hits the solid boundary.
The essence of the interaction between the TB and the free surface lies in the dynamic characteristics of the system, triggered by the flowing liquid vortex ring around the TB interacting with the liquid surface. The presence of the TB makes this process even more complex. These include deformation and oscillation of the free surface throughout the process, movement and deformation of the TB, as well as the subsequent generation of secondary liquid vortex ring and TB.
4.3. Scaling of $h^*_{max}$
We have established that different interactions between the TB and the free surface are characterized by the maximum non-dimensional elevation of the free surface $h^*_{max}$ and the deformation of the TB during the interactions. Meanwhile, from § 4.1, it is known that $h^*_{max}$ is dependent on the value of $Fr$. Here, we present an analytical scaling of $h^*_{max}$ against $Fr$ by considering the energy balance of the liquid during the interactions.
Now, we can simplify the processes of typical TB–free surface interactions as shown in figure 19, where strong and weak interactions are summarized in panels (a) and (b), respectively. When $t^*<0$, i.e. when the TB is below the reference point, the flow field can be approximated as an uprising liquid ellipsoid containing a liquid vortex ring and the TB. The main differences between strong and weak TB–free surface interactions lie in the behaviour of the TB, the maximum deformation of the free surface, as well subsequent phenomena after the free surface falls back to the original position, as described in the figure. For ease of discussion, we term the liquid portions above the original liquid surface of both the strong and weak interactions as the liquid column. With the flow model shown in figure 16(e), we assume that for both strong and weak interactions, it is the same liquid ellipsoid that forms the deformation of the free surface, or the liquid column, as shown in figure 19. Next, we consider the energy of the liquid column situated above the free surface at its highest level, i.e. when the maximum deformation of the free surface $h_{max}$ occurs during the TB–free surface interaction. As per the numerical simulations highlighted in § 4.2, the liquid velocities within the majority of the liquid column are observed to be at their minimum for both strong and weak TB–free surface interactions. The numerical simulations also suggest that the kinetic energy of the liquid column is at its minimum at maximum free surface deformation, as shown in Appendix A. Therefore, we can readily estimate the potential energy of the liquid column $E_p$ at this instant by roughly assuming that the centroid of the liquid column is at half of $h_{max}$, or $E_p=({g h_{max}}/{2}) V_e$, where $V_e$ is the volume of the liquid ellipsoid.
The liquid column below the ellipsoid has an additional effect on the pressure on the lower surface of the ellipsoid (Ji, Yang & Feng Reference Ji, Yang and Feng2021). The effect of the Laplace pressure and surface tension over the boundary of the TB can be ignored, since the scales of the former (${\rm \pi} \sigma R$) and the latter $2{\rm \pi} \sigma R$ are lower than $1/1000$ and $1/500$ of the gravitational force, respectively. The variation in surface energy due to the shape change of the TB is less than $1/200$ of that by buoyancy, which can also be ignored.
Taking into account the considerable density ratio between the liquids and air, the fluctuation of the mechanical energy of the TB throughout the interaction can be disregarded. Ignoring all the viscous forces, the potential energy of the liquid column when the free liquid surface deformation is at its maximum, $E_p$, is approximately equivalent to the sum of the total mechanical energy of the ellipsoid at the reference point, $E_c^*+E_k^*$. Within the liquid ellipsoid, only the TB is affected by buoyancy due to the difference in densities between air and liquid. The centre of gravity of the TB is $2R_{{ref}}+a_{{ref}}$ below the free surface at $t^*=0$. Thus, the work done by the buoyancy on the ellipsoid $W_b$ can be evaluated via calculating the buoyancy force acting on the TB, $\rho gV_b$, and the displacement of the centre of the TB till it reaches the original position of the free surface. Hence, we can write $W_b=\rho gV_b(2R_{{ref}}+a_{{ref}})$. Thus,
or
where $V_e$ is the volume of the ellipsoid. Equation (4.7) implies that the ellipsoid does approximate vertical projectile motion after reaching the free surface.
Referring to the flow model in figure 16(e), we can roughly estimate the volume of the ellipsoid by approximating the major axis of the ellipsoid to $4R$ and the minor axis to $3R$, as detailed in Appendix B. The volume of the ellipsoid is thus $V_e=8{\rm \pi} R_{{ref}}^3$. Substitute (2.2), (4.4) and (4.6) into (4.8), and we derive the scaling of $h_{max}^*$ as
The detailed derivation of (4.9) is shown in Appendix C.
This proves that the normalized maximum deformation of the free surface during the TB–free surface interaction $h_{max}^*$ is solely dependent on the Froude number of the TB at the reference point $Fr$, or its slenderness $\eta$. Figure 20 shows the comparison of the results from the above equation with the experiments and provides a concise approximate fit for $h_{max}^*$ in this range of $Fr$ or $\eta$ values,
Both equations provide predictions that fit with the experimental results for all three test liquids. If we define $h_{max}^*=1.0$ as the threshold between strong and weak interactions, we can readily determine the critical values for $Fr$ and $\eta$ as $Fr_c = 3.2$ and $\eta _c = 4.2$.
By (4.9), we can evaluate the respective contributions of $E_c^*$, $E_k^*$ and $W_b$ to $E_p$. As shown in figure 21, $E_c^*/E_p$ remains below 20 % in the whole range of $Fr$ considered. While the circulation of the liquids plays a pivotal role in maintaining the shape of TB, its impact on the TB–free surface interaction is relatively moderate, especially at small $Fr$ values. Meanwhile, $E_k^*/E_p$ decreases rapidly, and the proportion of work done by buoyancy $W_b/E_p$ increases rapidly, as $Fr$ increases. This indicates that in cases with strong TB–free surface interactions, the considerable influence of buoyancy forces on the dynamics cannot be ignored. Note that $\eta =1.0$ corresponds to the limiting condition where $R=a$.
Based on the above analysis and discussion, we can finally summarize the characteristics of the TB–free surface interactions in figure 22. The interactions can be distinguished as strong and weak interactions based on the critical values $Fr_c = 3.2$ and $\eta _c = 4.2$. In strong interactions, i.e. $Fr>Fr_c$ or $\eta <\eta _c$, the TB crosses the original surface position during the process, where its radius decreases with time. The greater the $Fr$ number value, the more intense the deformation of the free surface, and the stronger the subsequent oscillation of the free surface. The processes are also characterized by the strong pinch-off of the free surface and the generation of the secondary TB. In weak interactions, i.e. $Fr< Fr_c$ or $\eta > \eta _c$, the TB never exceeds the original free surface. The deformation of the liquid surface is smaller, and the pinch-off of the free surface and the secondary TB are weaker. The radius of TB continuously increases over time. The smaller the $Fr$ number, the more its behaviour is similar to the liquid vortex ring hitting the solid wall.
Finally, to better demonstrate the characteristics of the TB–free surface interactions, we next compare the results with the research of single-phase vortex ring cases, i.e. the liquid vortex ring (LVR)–free surface interactions in the literature. Several studies have focused on vortex rings that approach a water surface at various oblique angles (Weigand & Gharib Reference Weigand and Gharib1995; Ohring & Lugt Reference Ohring and Lugt1996). In addition, several other studies have explored phenomena such as the self-connection of vorticity formed by vortex rings near the free surface and the characteristics of wave components (Dommermuth & Yue Reference Dommermuth and Yue1991; Ruban Reference Ruban2000; Bandyopadhyay Reference Bandyopadhyay2020). Here, we only compare with the cases with the normal collision of the LVR with the free surface, as described by Song et al. (Reference Song, Bernal and Tryggvason1992). Apart from the rich phenomena of bubble evolution in the case of TB–free surface interactions, from the dimensionless parameter range involved in the research, as well as the free surface deformation, both are also significantly different.
As shown in previous sections, the circulation around the TB can be conveniently estimated based on the shape of the TB. Correspondingly, the circulation of the LVR can only be obtained by integrating the velocity distribution based on experimental or numerical data. Before the onset of the interactions, it is known that the circulation of the LVR generated by impulsively started flows decays in time (Pullin Reference Pullin1978). Instead, due to the effect of buoyancy on the bubble, the circulation around the TB remains approximately constant (Turner Reference Turner1957).
Therefore, we can expect lower $Fr$ values for the LVR. Unfortunately the reference position used for the $Fr$ definition by Song et al. (Reference Song, Bernal and Tryggvason1992) is different from this study, making direct comparison impossible without further information. By their definition, the $Fr$ values are lower and the range is narrower, i.e. 0.252–0.988, which would be even lower if they could be converted to the definition used in this study. Correspondingly, in the experiments of the TB–free surface interactions, it is found that when $Fr < 0.8$, the TB is difficult to maintain stability and tends to fragment into multiple small bubbles. Since the LVR–free surface interactions are also characterized by $Fr$, the interaction is of a single type and is relatively weak by the current standard. The free surface deformations remain within a moderate range, and the LVR never exceeds the initial position of the free surface during the interaction processes for all the cases. Moreover, if the same reference position is used to define $Fr$, it can be predicted that due to the work done by buoyancy force $W_b$, $h_{max}$ caused by TB should be larger than that of LVR. According to figure 21, the larger the $Fr$, the greater the difference.
5. Concluding remarks
We carry out a systematic study on the interaction between a toroidal bubble (TB) in a liquid and a free surface. For this purpose, we first build a liquid tank containing a TB generator. By controlling the air pressure and ventilation time at the inlet of the TB generator, TBs are formed in three different liquids, water and two different aqueous glycerol solutions. Based on this, we take high-speed photographs of the system's dynamic behaviour. According to the experimental results, two types of interactions are summarized, i.e. strong and weak interactions. During strong interactions, the TB passes the initial free surface position. The free surface deforms drastically, forming a liquid ellipsoid enveloping the TB. During the rise of the ellipsoid, under the squeeze of the surrounding liquid, the radius of the TB decreases and its height increases. Subsequently, the ellipsoid smashes back to the free surface, causing the free surface to oscillate. After that, the pinch-off of the free surface and the secondary TB are formed. In weak interactions, TB never exceeds the initial free surface. There is less liquid surface deformation. TB rebounds on the surface of the liquid, with its radius continuously increasing. Free surface oscillates with weaker magnitudes. Summarizing the normalized maximum free surface deformation $h_{max}^*$ shows that the value of $Fr$ plays a major role.
To further study its mechanism, we develop a numerical simulation technique based on the volume of fluid (VOF) method on the OpenFOAM platform for the TB–free surface interactions. By establishing a geometrically consistent axisymmetric calculation field, and giving different combinations of ventilation pressure and time at the inlet at its bottom, we successfully simulate the motion of the TB in the liquid and the dynamic behaviour of its interaction with the free surface. Flow field analysis shows that when the TB is at the reference position, even though the free surface has not yet deformed significantly, the liquid vortex ring enveloping TB has already made contact. In the subsequent stages of strong and weak interactions, the liquid vortex ring strongly affects the dynamic behaviour of the entire system, including the rise, fall and pinch-off of the free surface, generation of the secondary TB, etc. The study of the change of the radius of the TB over time from the calculation results shows a significant difference in strong and weak interactions, which is consistent with the experimental observation. Meanwhile, we verify that the $Fr$ determines the main characteristics during the interaction process. The interaction between the TB and the free surface is essentially the interaction between the liquid vortex ring enveloping the TB and the free surface, supplemented by the TB's complex behaviour in this process.
Next, we establish the scaling law of $h_{max}^*$ based on the energy balance conditions. First, we observe the flow field caused by the TB when the TB is below the reference position. The entire flow field can be split into two parts: the propagation of the ellipsoid containing the liquid vortex ring and the TB, and the circulating motion of the liquid vortex ring inside the ellipsoid around the TB. Based on the numerical results, we can identify the distribution law of the relative velocity of the liquid. By analysing the kinetic energy of the relative motion of the liquid inside the ellipsoid, we successfully derive the ratio between the kinetic energy of the relative motion and the kinetic energy of ellipsoid propagation, at different $Fr$ or shape factor of the TB, $\eta$. After considering the work done by the buoyancy forces, we use the energy balance analysis of the ellipsoid during the interaction process to derive the scaling law between $h_{max}^*$ and $Fr$ or $\eta$. This relationship demonstrates an interesting fact, i.e. the shape factor (or the slenderness) of the TB, $\eta$, at the reference position determines the entire process of the interaction. In addition, we provide the critical $Fr$ and $\eta$ values for identifying the strong and weak interactions, and a parametric plot of the interactions in terms of $Fr$ and $\eta$.
This study clarifies the mechanism and characteristics of the TB's behaviour at the free liquid surface through systematic experimental, numerical and theoretical approaches. The results of this study can provide guidance for the future application of TBs in various fields.
Supplementary movies
Supplementary movies are available at https://doi.org/10.1017/jfm.2024.892.
Acknowledgements
We gratefully acknowledge Y. Guo for the technical support.
Funding
This work was supported by the National Natural Science Foundation of China (grant nos. 52076120 and 52079066), the Creative Seed Fund of Shanxi Research Institute for Clean Energy, Tsinghua University, the Academic Research Projects of Beijing Union University (no. ZK90202108), and the R&D Program of Beijing Municipal Education Commission (no. KM202211417011).
Declaration of interests
The authors report no conflict of interest.
Appendix A. Evaluation of the kinetic energy of the liquid ellipsoid
The evolution of the propagation velocity $U$ of the TB for the case in figure 5 with $Fr = 2.94$ is shown in figure 23. To derive the scaling law of $h_{max}^*$, we need to estimate the energy of the liquid during the interaction process. One of the key steps is to decompose the motion of the liquid at $t^*<0$ into the propagation of the liquid ellipsoid, and the rotational motion of the liquid vortex ring inside the ellipsoid with respect to TB. Here, based on the results of numerical simulation, we provide the kinetic energy analysis of the liquid relative to TB at three instants $t_1< t_2< t_3$ for the case in figure 5 with $Fr = 2.94$ (case 1), and two more cases (case 2 and case 3) with $Fr = 5.77$ and $Fr = 5.29$, respectively, as shown in table 5. It can be seen that the proportions of the kinetic energy of the relative motion of the liquid in the $|x|< R$ part and the $|x|>R$ part are almost fixed, and the order of magnitude is similar.
Estimations of the relative amplitude of the instant kinetic energy of the liquid ellipsoid, $E_{ki} + E_{ci}$, where $E_{ki}$ and $E_{ci}$ represent the instant kinetic energy from the propagation and the circular motions of the liquid ellipsoid, respectively, compared with that of the potential energy at the maximum free surface deformation, $E_p$, for both strong and weak TB–free surface interaction cases, are shown in figure 24. From the numerical simulation results, it is seen that for the two cases, where $Fr =7.15$ and $Fr=1.77$, respectively, as the normalized deformation of the free surface $h^*$ reaches maximum, the ratio $(E_{ki} + E_{ci})/E_p$ reaches minimum (approximately 5 % and 1 %, respectively) as the TB rises. This indicates that we can ignore the kinetic energy of the liquid column when evaluating the total energy at the maximum free surface deformation.
Appendix B. Estimation of the major and minor axes of the liquid ellipsoid
The major and minor axes of the ellipsoid, $2a$ and $2b$, can be first estimated through the flow model presented in figure 16(e). The undisturbed maximum radius of the vortices that circle around the TB, or $R$, meets at the centreline, which is a quarter of the major axis. Hence, the major axis is roughly $4R$. By the approximation of an ellipse with osculating circles, the curvature radius of the ellipsoid at the end of the major axis is $b^2/a$ (Capderou Reference Capderou2014). To cover a circle centred at $(R, 0)$ with a radius of $R$, $b^2/a$ must be larger than $R$. Hence, for $a=2R$, $b \geq \sqrt {2}R$. The minor axis $2b$ should be larger than $2\sqrt {2}R \approx 2.828R$. With the above information, we examine the numerical results as in figure 14(a–c), and find that $4R$ and $3R$ are good approximations for the major and minor axes, respectively.
Appendix C. Formula derivation from (4.8) to (4.9)
According to (4.8):
Since $\varGamma _{{ref}}=4{\rm \pi} R_{{ref}}U_{{ref}}\left [\ln (8\eta )-\tfrac {1}{4}\right ]^{-1}$, we have $U^2_{{ref}}=({\varGamma _{{ref}}}/{4{\rm \pi} R_{{ref}}})\left [\ln (8\eta )-\tfrac {1}{4}\right ]$.
By (4.5) and (4.6), $Fr={\varGamma _{{ref}}}/{\sqrt {gR^3_{{ref}}}}=3\sqrt {2}{\rm \pi} \eta ^{-1}$, so
Then, the non-dimensional maximum deformation of the free surface can be expressed as
which is (4.9) in the main text.