


Sugar-sweetened beverages are the leading source of added sugars in Western diets(Reference Bleich and Wolfson1), while carbonated soft-drinks (e.g. Coke, Pepsi, Sprite, Fanta) are the major contributors of sugar from all sugar-sweetened beverages(Reference Reedy and Krebs-Smith2,Reference Garnett, Rosenberg and Morris3) . Euromonitor predicts that the global soft-drink market will increase in size in the coming years, with most of the growth expected to occur in low- and middle-income countries (LMIC). It has been forecasted that, in 2024, global sales volume and revenue figures will be 5·0 % and 16·1 % greater, respectively, than what they were in 2019(4). Such an increase in carbonated soft-drinks sale is of a global public health concern, as carbonated soft-drink consumption has been associated with a plethora of adverse health outcomes, especially in young people(Reference Lake, Mathers and Rugg-Gunn5). For example, several studies have shown that consumption of soft-drinks with high sugar and acid content can contribute to increasing risk of overweight, obesity, type 2 diabetes, suicidal behaviour, dental caries and dental erosion, among children and adolescents(6–Reference González-Carcelén, Nicolás López and López Sánchez11).
It is essential to understand the prevalence and temporal trends of carbonated soft-drink consumption among adolescents to aid in the establishment of policies that aim to reduce carbonated soft-drink consumption. Adolescence is an important time to intervene as this is a time when habits are formed that persist into adult life including healthy diets(Reference Movassagh, Baxter-Jones and Kontulainen12). However, despite the known adverse health outcomes in relation to carbonated soft-drink consumption in adolescents, there is limited literature on its temporal trends. In the USA, for example, one study using data from the 2011–2018 cycles of the California Health Interview Survey found that soda consumption prevalence declined by 4·24% among adolescents(Reference Lee, Altman and Madsen13). In another US study using repeated cross-sectional data from National Health And Nutrition Examination Survey and including 21 156 children and adolescents aged 2–19 years, it was observed that from 2003–2004 to 2017–2018, the prevalence of drinking any amount of sugar-sweetened beverages on a given day declined significantly among all race and/or ethnicity groups (non-Hispanic White: 81·6 % to 72·7 %; non-Hispanic Black: 83·2 % to 74·8 %, Hispanic: 86·9 % to 77·2 %)(Reference Dai, Soto and Dunn14). In another repeated cross-sectional study from Eastern Europe using data from 2002 to 2018 of the Health Behaviour in School-Aged Children school-based study (n 325 184 adolescents aged 11–15 years), it was found that the prevalence of daily sugar-sweetened beverage consumption declined in ten out of fourteen countries. The largest reductions were observed in Slovenia and the Russian Federation(Reference Chatelan, Rouche and Dzielska15). It is clear that further research is needed from other settings where no data on trends exist (i.e. non-Western countries, LMIC). In particular, studying this trend in LMIC is of importance as sales of carbonated soft-drink consumption are likely to rise at a rapid rate in this setting owing to carbonated soft-drink companies targeting these regions(4).
Given this background, the aim of the present study was to examine the temporal trend of carbonated soft-drink consumption in a sample of 74 055 students aged 12–15 years from eighteen countries in Africa, Asia and the Americas (predominantly LMIC), which were selected based on data availability.
Methods
The survey
Secondary data analysis of the Global School-based Student Health Survey (GSHS) was conducted. Details on this survey can be found at https://www.who.int/teams/noncommunicable-diseases/surveillance/data and http://www.cdc.gov/gshs. In brief, the GSHS was developed by the WHO and the US Centers for Disease Control and Prevention, and other UN allies. The primary objective of the survey was to identify risk factors of major non-communicable diseases. The survey used a standardised two-stage probability sampling design to select students within each country. For the first stage, schools were selected with probability proportional to size sampling. The second stage consisted of the random selection of classrooms which included students aged 13–15 years within each selected school. All students in the selected classrooms were eligible to participate in the survey regardless of age. Thus, the survey was not restricted to those aged 13–15 years. Data collection was done during one regular class period. The questionnaire was translated into the local language and consisted of multiple-choice response options. Students recorded their responses on computer scannable sheets. All GSHS surveys were approved, in each country, by both a national government administration (most often the Ministry of Health or Education) and an institutional review board or ethics committee. Student privacy was protected through anonymous and voluntary participation, and informed consent was obtained as appropriate from the students, parents and/or school officials. Data were weighted for non-response and probability selection.
From all publicly available data, we chose all nationally representative datasets that included the variables pertaining to our analysis, and for which comparable data on at least two waves were available from the same country. Based on this inclusion criteria, a total of eighteen countries were included in the current study. The characteristics of each country including the region, survey year, country income level, response rate, sample size and demographics are provided in Table 1. The country income level was based on the World Bank classification at the time of the survey(Reference Hamadeh, Van Rompaey and Metreau16). These countries were mainly LMIC and were from five WHO regions: African Region (n 2), Region of the Americas (n 5), Eastern Mediterranean Region (n 5), South-East Asia Region (n 1) and Western Pacific Region (n 5). The surveys included in the current study were conducted between 2009 and 2017.
Table 1. Survey characteristics
(Mean values and standard deviations)

AFR, African Region; AMR, Region of the Americas; EMR, Eastern Mediterranean Region; SEAR, South-East Asia Region; WPR, Western Pacific Region; H, high income; L, low income; LM, lower middle income; UM, upper middle income. Country income level was not available for Anguilla and Cook Islands.
Carbonated soft-drink consumption
Consumption of carbonated soft-drinks was assessed with the question ‘During the past 30 days, how many times per day did you usually drink carbonated soft-drinks?’ Country-specific examples of carbonated soft-drinks were provided, and the student was instructed not to include diet soft-drinks. Response options included ‘I did not drink carbonated soft-drinks during the past 30 days’, ‘less than 1 time per day’, ‘1 time per day’, ‘2 times per day’, ‘3 times per day’, ‘4 times per day’ and ‘5 or more times per day’. This variable was dichotomised as ≥ 1 time per day or not(Reference Ashdown-Franks, Vancampfort and Firth17).
Statistical analysis
Only those aged 12–15 years were included in the analysis as most students were within this age group, while information on the exact age outside of this age range was not available (i.e. some ages were provided only in aggregate (e.g. ≤ 11 years). The prevalence and 95 % CI of carbonated soft-drink consumption were calculated for the overall sample and sex-stratified samples for each survey. Crude linear trends in carbonated soft-drink consumption were assessed by linear regression models across surveys within the same country to estimate regression coefficients (β) and 95 % CI for every 1-year change. P for trends were estimated using the survey year as a continuous variable. We also conducted interaction analysis to assess whether there are differing trends among boys and girls by including a product term (survey year X sex) in the model. Sampling weights (that reflect population size of each country) and the clustered sampling design of the surveys were taken into account in all analyses. Statistical analyses were done with Stata 14.2 (Stata Corp LP).
Results
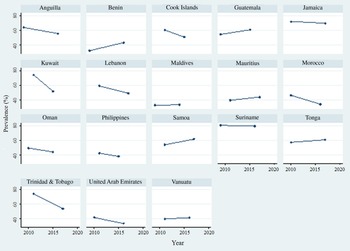
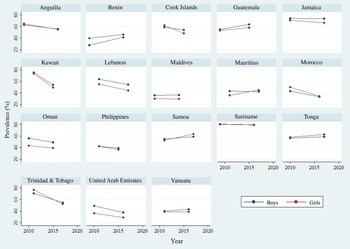
Data were available for a total of 109 347 students, but 34 506 students were deleted as they were not within the age range of 12–15 years, and a further 786 students were omitted as data on age were missing. Thus, 74 055 students aged 12–15 years were included in the final analysis. The mean age was 13·9 (sd 1·0) years and 49·2 % were boys. The overall mean prevalence of carbonated soft-drink consumption (i.e. at least once per day during past 30 d) was 42·1 % (once 20·5 %, twice 11·4 %, 3 times 5·0 %, 4 times 1·7 %, ≥ 5 times 3·5 %). The prevalence of carbonated soft-drink consumption ranged widely between countries with the lowest and the highest being observed in Benin in 2009 (32·1 %) and Suriname in 2009 (80·5 %), respectively. The trends in the prevalence of carbonated soft-drink consumption are shown in Table 2 (overall and by sex), Fig. 1 (overall) and Fig. 2 (by sex). Of the eighteen countries included in the study, based on the overall sample, significant decreasing trends of carbonated soft-drink consumption were observed in seven countries, while increasing trends were found in two. No significant decreasing or increasing trends were observed in the remaining nine countries in the overall sample. Specifically, significant decreasing trends were found in Anguilla between 2009 (63·9 %) and 2016 (55·7 %) (β = –1·17; 95 % CI –1·89, –0·46), Cook Islands between 2011 (60·5 %) and 2015 (50·9 %) (β = –2·41; 95 % CI –3·50, –1·31), Kuwait between 2011 (74·4 %) and 2015 (51·7 %) (β = –5·66; 95 % CI –7·73, –3·59), Lebanon between 2011 (59·2 %) and 2017 (49·0 %) (β = –1·70; 95 % CI –2·70, –0·70), Morocco between 2010 (46·3 %) and 2016 (34·1 %) (β = –2·02; 95 % CI –2·80, –1·25), Trinidad & Tobago between 2011 (73·9 %) and 2017 (53·6 %) (β = –3·38; 95 % CI –4·32, –2·45) and United Arab Emirates between 2010 (41·5 %) and 2016 (33·3 %) (β = –1·36; 95 % CI –2·38, –0·35). The β can be interpreted as the average point change in prevalence (%) per year. On the other hand, significant increasing trends were observed in Benin between 2009 (32·1 %) and 2016 (43·3 %) (β = 1·60; 95 % CI 0·63, 2·56) and Samoa between 2011 (53·9 %) and 2017 (61·6 %) (β = 1·27; 95 % CI 0·42, 2·13). In terms of sex differences, a significant difference was only observed in Samoa. Specifically, a significant increasing trend was only observed among girls in this settings, while the trend for boys was not significant.
Table 2. Trends in prevalence of carbonated soft-drink consumption (%) in eighteen countries (overall and by sex)
(95 % confidence intervals and β-coefficients)

Carbonated soft-drink consumption referred to drinking carbonated soft-drinks at least once per day in the past 30 d.
The β is based on linear regression including survey year as a continuous variable. The β can be interpreted as the average percentage point change in prevalence per year.
* P for trend < 0·05.
** P for trend < 0·01.
*** P for trend < 0·001.
† Significant interaction by sex (P < 0·05).

Fig. 1. Prevalence of carbonated soft-drink consumption (%) across years by country (overall sample including both boys and girls). Carbonated soft-drink consumption referred to drinking carbonated soft-drinks at least once per day in the past 30 d.

Fig. 2. Prevalence of carbonated soft-drink consumption (%) across years by sex and country. Carbonated soft-drink consumption referred to drinking carbonated soft-drinks at least once per day in the past 30 d.
Discussion
Main findings
In the present study including nationally representative samples of 74 055 school-going adolescents aged 12–15 years from eighteen countries in Africa, Asia and the Americas (predominantly LMIC), the mean prevalence of carbonated soft-drink consumption was high (i.e. 42·1 %), and significant decreasing and increasing trends were observed in seven (Anguilla, Cook Islands, Kuwait, Lebanon, Morocco, Trinidad & Tobago, United Arab Emirates) and two (Benin, Samoa) countries, respectively. Kuwait experienced the largest decreasing trend (2011 (74·4 %) and 2015 (51·7 %)) and Benin the greatest increasing trend (2009 (32·1 %) and 2016 (43·3 %)). The remaining countries showed stable trends. However, most countries with declining trends still had high prevalence at the most recent survey because the rate of decline was modest and/or due to very high prevalence in earlier years. Furthermore, in some countries with stable trends, a very high prevalence was observed across multiple years (e.g. Suriname 80·5 % in 2009 and 79·4 % in 2016). Finally, significant sex-differences in the trends were observed only in Samoa. Specifically, there was a significant increasing trend only among girls in this country.
Interpretation of findings
It is encouraging that decreasing trends in carbonated soft-drink consumption were observed in seven countries with the greatest decrease observed in Kuwait. It may be hypothesised that this decrease is owing to nation-wide initiatives; however, it is important to note that there are no empirical studies in these countries to support this hypothesis. The Kuwait National Programme for Healthy Living was developed in 2013 to predominantly address the high prevalence of obesity in Kuwait. Among other initiatives, the programme introduced knowledge on the pathophysiology of obesity into the school curriculum, and the harmful effects of physical inactivity in conjunction with excessive energetic intake (e.g. carbonated soft-drinks)(Reference Behbehani18). However, it is important to further highlight that despite the declining trend observed in Kuwait, the prevalence was still high in the latest survey (51·7 % in 2015). In 2020, Kuwait introduced a 50 % excise tax on carbonated soft-drinks, which will hopefully contribute to a continuation of declining trends of carbonated soft-drink consumption among adolescents in Kuwait(Reference Al-Jawaldeh and Megally19). Importantly, other countries that experienced declining trends also had implemented similar initiatives to Kuwait(20). Importantly, other studies carried out in countries not included in the present paper have also found declining trends, such as in the USA and Eastern Europe (with the greatest reductions observed in Slovenia, and the Russian Federation)(Reference Lee, Altman and Madsen13–Reference Chatelan, Rouche and Dzielska15). However, direct comparisons in the rate of decline between these countries and those included in the present study are not possible owing to differences in measures used and these measures pertaining to different time periods.
While decreasing trends were observed in seven countries, increasing trends were observed in two, with the largest increase observed in Benin, which was the only low-income country included in our study. This is of concern as the global soft-drink market is projected to increase in size in the coming years, with most of the growth expected to occur in LMIC and thus potentially further increasing such trends(4). This may be owing to the westernisation of diets in LMIC(Reference Kennedy, Nantel and Shetty21). Such increasing trends may also be driven by carbonated soft-drink organisations engaging in powerful and aggressive marketing and advertising that target adolescents(Reference Taber, Chriqui and Vuillaume22). For example, in 2015, Coca-Cola launched a pan-African television advertisement called ‘Billion Reasons to Believe’, which aimed to capture the spirit of optimism and perseverance embodied by African youth(Reference Brownsell23). Moreover, in the African continent, Coca-Cola franchises its bottlers and is thus considered to be a ‘local brand’, which likely further entices adolescents to consume the product(Reference Byala24). Indeed, this trend continues in Benin with a new bottling partner announced in 2022 and receiving US$30 million in investment(25). Samoa also observed increasing trends in carbonated soft-drink consumption among adolescents. It is likely, although speculative, that this increase is owing to similar reasons as observed in Benin.
It is important to highlight that sex-differences in trends of carbonated soft-drink consumption were observed in Samoa. Specifically, significant increasing trends were only found in females in this country. The reasons behind sex-specific trends in Samoa are elusive and further research of a qualitative nature is required to shed light on potential mechanisms. However, it may be that in this setting, marketing tactics by carbonated soft-drink organisations may be more targeted towards girls than boys. For example, sponsorship of female sports teams such as the female FIFA/Coca-Cola football league, for which Samoa participates in, may partially explain an increase in consumption among girls compared with boys(26).
Policy implications
Despite decreasing trends observed in seven countries, the prevalence of carbonated soft-drink consumption remained high in all the countries included in our study. It is thus prudent to introduce nation-wide policy and intervention to combat such a high prevalence. An example of a successful policy likely includes excise tax on carbonated soft-drinks. Evidence of the effectiveness of excise taxes on such drinks is growing fast, with reductions on frequency of consumption being observed in Philadelphia and low-income areas of Berkley, and decreased sales in Mexico, Barbados and Chile(Reference Zhong, Auchincloss and Lee27–Reference Caro, Corvalán and Reyes31). Indeed, a recent systematic review of real-word studies concluded that excise taxes on sugar-sweetened beverages are effective in reducing their purchases and dietary intake, suggesting a greater effect for volumetric taxes with sugar thresholds(Reference Teng, Jones and Mizdrak32). However, it is important to note that there is a lack of studies on this topic focusing on adolescents and future research to understand the impact of excise tax on soft-drink purchasing among this population is now required. Moreover, school-based policies may also be effective focusing on the education of the impact of unhealthy diets on health(33). For example, in a recent systematic review, evidence suggests that school-based education programmes focusing on reducing sugar-sweetened beverage consumption, but including follow-up modules, offer opportunities for implementing effective, sustainable interventions. Peer support and changing the school environment (e.g. providing water or replacement drinks) to support educational programmes were found to improve their effectiveness. Home delivery of more suitable drinks also had an important impact on reducing consumption(Reference Avery, Bostock and McCullough34).
Strengths and limitations
The analysis using large representative samples of school-going adolescents from eighteen countries in Africa, Asia and the Americas, and the presentation of data from countries where no data on trends of carbonated soft-drink consumption previously existed are clear strengths of the study. However, findings must be interpreted considering the study’s limitations. First, carbonated soft-drink consumption was self-reported, potentially introducing some level of bias (e.g. recall bias) into the findings. Second, our study results are only generalisable to school-going adolescents. Third, the question on carbonated soft-drink consumption used in our study was based on frequency per day rather than the volume of carbonated soft-drink consumed. Thus, our measure can only be considered a proxy of daily volume of carbonated soft-drinks consumed and its associated sugar intake. Furthermore, there were only two data points for each country, and thus, a clear temporal trend was difficult to establish. Future studies on this topic should consider including more data points. In addition, seasonal factors could have also influenced carbonated soft-drink consumption. For example, it is possible for students to consume more carbonated soft-drinks in summer, but there were no data on the season or month in which the survey was conducted. Finally, given that the survey years differed between countries, results should be interpreted together with the years in which the surveys were conducted especially when comparing between countries, since the β-coefficient could be representing estimates from different periods.
Conclusion
Among school-going adolescents aged 12–15 years from eighteen countries, trends in carbonated soft-drink consumption declined in more countries than increased. However, regardless of the direction of trends, the prevalence of carbonated soft-drink consumption was overwhelmingly high in all countries included in the present study. With sales of carbonated soft-drinks increasing via aggressive marketing campaigns by carbonated soft-drink organisations, public health initiatives to reduce the consumption of such products among adolescents are urgently required.
Acknowledgements
This paper uses data from the Global School-based Student Health Survey (GSHS). GSHS was supported by the WHO and the US Centers for Disease Control and Prevention. All authors listed have made a substantial, direct and intellectual contribution to the work, and approved it for publication.
Dr. Guillermo F. López Sánchez was funded by the European Union – Next Generation EU.
There are no conflicts of interest.


 Open access