1. INTRODUCTION
The growth of world trade before 1913 and its decline in the 1930s are regarded as essential components of the globalisation before World War One and its retreat during the Great Depression (Findlay and O’rourke Reference Findlay and O’rourke2007; Meissner Reference Meissner2014). In recent years, the issue has been extensively studied using data on bilateral trade within a gravity model framework (Fouquin and Hugot Reference Fouquin and Hugot2016; Jacks et al. Reference Jacks, Meissner and Novy2011 Pascali Reference Pascali2017) and also by the parallel literature on market integration using price data (Federico Reference Federico2012 and Reference Federicoforthcoming). In contrast, trends in total trade have been largely neglected. We still rely on the work of the League of Nations (1933-1938) for the interwar years and on the pioneering estimates by Maddison (Reference Maddison1962) and Lewis (Reference Lewis1981) for the period before World War One. By definition, these series do not take into account the recent work on the trade of specific countries nor the series of imports and exports included in new sets of national accounts. Furthermore, the available series are affected by a number of flaws and rely almost exclusively on data for the most advanced countries (Federico and Tena-Junguito Reference Federico and Tena-Junguito2016b). Neither the gravity models nor the estimates of market integration are good substitutes for series of total trade. Mapping trade from integration is very difficult, while the data on bilateral trade are incomplete and sometimes seriously flawed (Federico and Tena-Junguito Reference Federico and Tena-Junguito1991).
Our research aims to fill this gap. We compute a new series of world trade by summing exports at constant prices for «trading polities» from 1800 to 1938 and extend it by linking it to the post-war series from the United Nations. For each polity, we estimate series of imports and exports at current and constant prices at current and constant (1913) borders.Footnote 1 In principle, we would have liked to have estimated series for all polities since 1800, because we prefer a very tentative figure to the implicit assumption that trade did not exist if not registered by official statistics. We have nevertheless been forced to compromise. Polity series start at different dates from 1800 to 1850, import series are missing for some polities before 1850 and during World War One, and we have omitted altogether some very minor polities.
We have already used our database in a number of papers on the trade of specific areas (Federico and Tena-Junguito, Reference Federico and Tena-Junguito2014, Reference Federico and Tena-Junguito2017a, Reference Federico and Tena-Junguito2018) and in a paper comparing the two globalisations (Federico and Tena-Junguito, Reference Federico and Tena-Junguito2017b). This paper outlines the sources and methods used in the construction of our series, describes the main trend in world trade and provides some basic information on the performance by polities. Section 2 presents our definition of trading polity, specifies the criteria for inclusion in the dataset and estimates the (small) potential bias from the omissions. Section 3 sketches out the sources and methods for estimation, and Section 4 assesses the reliability of our results. Section 5 outlines the evolution of aggregate world trade, while Section 6 delves deeper into trends, grouping polities according to geographical location, level of development, political status and factor endowment. Finally, Section 7 adds a simple analysis of changes in composition of trade as measured by the share of primary products in trade.
2. THE TRADING POLITIES
We define as «trading polity» any political entity, including colonies (hence the use of the word polity rather than country in this paper) that registered its own trade and/or was registered as a separate entry in the trade statistics of other polities. This definition implies a minimum organisational capability for collecting and processing the data and some sort of international recognition.
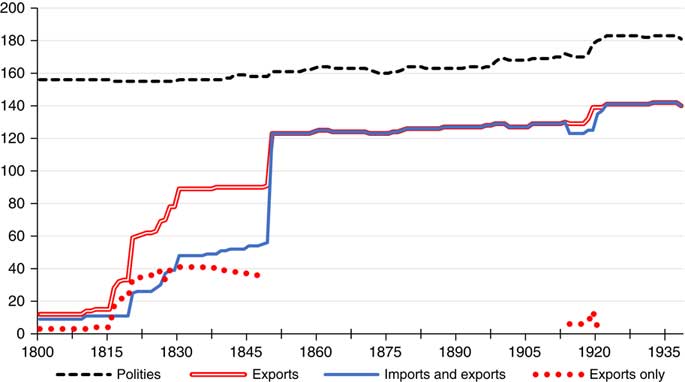
As a first step, we have compiled a list of polities that ought to have been included in our database, using as the main source the Correlates of War Project (v.4), supplemented and corrected by standard reference sources when necessary. The full list includes a total of 241 polities, 36 in Africa, 52 in the Americas, 64 in Asia, 46 in Europe and 43 in Oceania, although some of them were established during the period and others disappeared before 1938. The number of polities existing in each year (Figure 1) rises slowly from 157 in 1800 to 183 on the eve of World War Two.
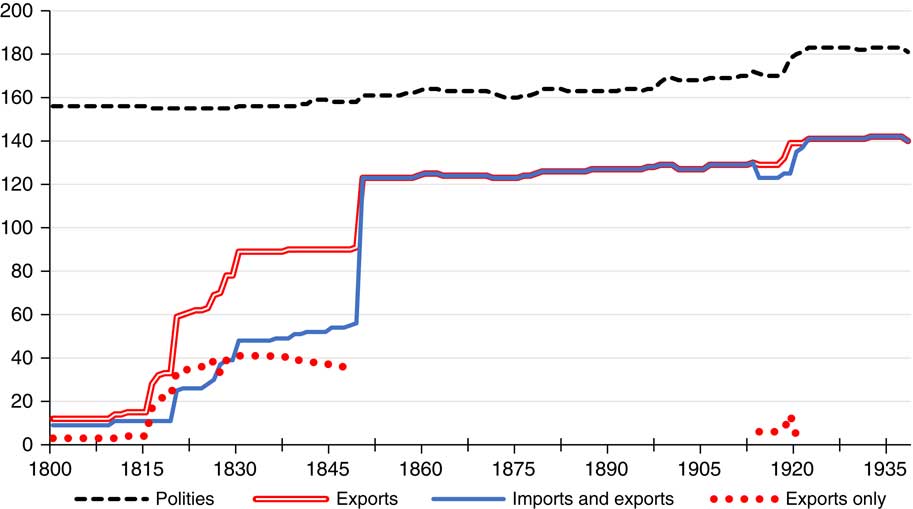
Figure 1 Number of polities and series in the database Sources: Federico and Tena-Junguito (Reference Federico and Tena-Junguito2016b), Appendix D. Table D.3.
As mentioned, as a general rule, the database also includes polities without official trade data, such as most African and Asian areas until the late-19th century. However, there are exceptions to this rule (Figure 1). First and foremost, not all polity series cover the whole period. Twelve export series begin in 1800, and three more in 1813, but then the number jumps to 28 in 1816, rises to 62 in 1823 and to 89 in 1830. The number of import series grows as well, but remains lower in the first half of the 19th century – 9 in 1800, 23 in 1823 and 50 in 1830. After 1850, the dataset by polity is complete (it includes all eight series), with few exceptions for European countries during World War One but on the import side only. The number of polities in the database varies only as a consequence of changes in political boundaries, ranging between 125 and 130 until 1918 and jumping to around 140 after the war. The number falls short of the total listed polities because we have jointly estimated some minor polities (e.g. all European colonies in Oceania) and have decided not to estimate trade for the major independent port cities, such as Aden, and for some very small polities. We omit the former because it is too difficult to distinguish local trade from transit, which is excluded from our definition of trade (cf. Section 3). We define as «very small» any polity which accounted for less than 0.1 per cent of world total population in 1913 (i.e. about 1.8 million) and we exclude them from the database, unless we have good data (as for Iceland).Footnote 2
The dataset includes series for 149 polities, with 13,075 yearly observations for imports and 14,399 for exports (corresponding to an average length of 96.3 years for each series out of a maximum of 139), and a total of 109,896 observations. The coverage by polity is complete in the Americas from 1820, fairly high (about two thirds of all listed polities) in Europe from 1830, while before 1850 it is low for Africa (about one third of polities) and very low for Asia (no more than a fifth). The coverage of Asia also remains incomplete after 1850: in 1913, it features three-fifths of the missing polities (25 out of 42), while accounting for only a quarter of world polities (45 out of 172). However, most of these missing polities were small traditional sheikdoms in the Arabian Peninsula and in Central Asia.
By definition, the omission of any polity is bound to bias downward our estimate of world trade, unless the polity did not trade at all. We can measure the size of this bias with two different proxies, the share of the omitted polities in world population before 1938 (Federico and Tena-Junguito Reference Federico and Tena-Junguito2016a) or in world trade in the 1950s from the United Nations Yearbook (1951). Neither source covers all the omitted polities, but jointly they are reassuring. The omitted polities (24 or 22 out of a total of 41, respectively) accounted for 0.32 per cent of the world population in 1938 and for 0.75 per cent of world trade in the 1950s. Twenty-three polities are totally unaccounted for, but they were too small to be relevant (e.g. Faroe Islands, Monaco, St Helena). We thus can conclude that omissions from the database are extremely unlikely to have reduced trade after 1850 by more than 1 per cent. The number of missing polities, and thus the potential effect of omissions, is greater before 1850. Yet, the bias is smaller than one might infer from the sheer number of series. In fact, the series for major trading polities start in 1800, so that the twelve series available throughout the whole period (or «1800 sample») accounted for 62.3 per cent of world exports in 1850. The coverage rises to 81.4 per cent after 1823 («1823 sample», featuring 62 polities) and to 95.7 per cent after 1830 («1830 sample», 89 polities). These figures suggest that our database is fairly representative already before 1823, and fully representative after 1830. We will test more formally this claim in Section 5.
3. THE TRADE SERIES
The historical sources on trade are abundant, but difficult to manage. The United Kingdom started to publish foreign trade statistics in 1696, and it was joined by France and the United States in the late-18th century and by almost all independent countries in the 19th century. Colonial powers developed an interest in the trade potential of their newly acquired colonies quite early: the Board of Trade published the first issue of its Statistical Abstract of British colonies in 1856, providing data on trade for 41 colonies. Unfortunately, trade statistics were compiled with different criteria and need a substantial amount of work to make the data comparable across time and space. The first historical estimate of trade at constant prices, for the United Kingdom, dates back to the 1930s (Schlote Reference Schlote1952), and in more recent times scholars and statistical offices have produced «modern» series of trade for quite a few countries, including all major ones. We have used these series as much as possible, extending them in time when necessary, and we have concentrated on estimating trade for the other polities.
As a first step, we have collected data on imports and exports at current prices from different sources, including national statistical yearbooks, colonial yearbooks, such as the already cited Statistical Abstract of British colonies, and national and international collections of trade data, such as the United States and League of Nations. We have used the secondary literature, most notably Mitchell (Reference Mitchell2007), only as a last resort; it is usually quite accurate, but it does make occasional mistakes and, above all, reproduces data from original sources without any effort to make the figures comparable. In contrast, we have modified the data as much as possible to adhere to the current definition of trade, as set forth by the United Nations in the 1950s.
i) By definition our series exclude smuggling and trade in unlawful goods and slaves, and thus they undervalue total foreign transactions. However, the bias is arguably small. Protection, and thus the incentives for smuggling, was low for most of the period on imports and negligible on exports. Most series for African polities start in 1850, when the slave trade was in terminal decline, and when Africa accounted for a small share of world trade (cf. Section 6).
ii) We exclude transit and entrepôt trade, according to the so called «continental» system of trade statistics (Allen and Ely Reference Allen and Ely1953). Thus, we subtract re-exports from both imports and exports in trade statistics compiled with «Anglo-Saxon» criteria, under the plausible assumption that goods were imported and re-exported in the same calendar year. Many statistics, including the British ones, provide series of re-exports or at least data for a few years, which we use to fill the gaps with plausible hypotheses (e.g. assuming the ratio to exports to have remained constant in time).
iii) We exclude trade in bullion (coins) and also in precious metals, except for the exports of producing countries, such as South Africa.
iv) We express all data in calendar years. When necessary (e.g. for the United States before 1915), we convert data in fiscal years into calendar years by assuming that trade was distributed equally within the year.
v) We value trade at the national boundaries, measuring import c.i.f. (including freights and other costs of transportation) and exports f.o.b. (excluding these costs), adjusting when necessary the data of polities which adopted different criteria, such as the United States from 1883 to 1890 (Simon Reference Simon1960).
Despite our efforts, we have been unable to find trade data for many polities, mostly in Africa before Western colonisation and in the Arabic peninsula after 1918. In these cases, we guesstimate series of trade using (different combinations of) three main methods:
a) We sum imports or exports of main commercial partners, following the method used by Pamuk (Reference Pamuk1987) for the Ottoman Empire.
b) We proxy the missing trade with data for similar, usually neighbouring, polities. We have used this approach extensively for Africa in the pre-colonial and early colonial period. We assume that trade of coastal polities moved in parallel to trade of near-by coastal areas or islands (e.g. we use the series of trade of the Mauritius for several areas or polities of East Africa), while we assume zero trade for inland areas (e.g. Belgian Congo or Rhodesia), hypothesising that inter-African trade flows were very small and that exports to Europe were included in the figures for coastal areas.
c) As a last resort, we rely on population estimates, assuming that trade per capita at constant prices remained constant in the relevant period. We then obtain series at current prices by reflating with an index of prices.
We estimate series of imports and exports at constant (1913) borders with data on bilateral trade from trade statistics or other polity-specific sources. We assume that border changes did not affect the actual flow of goods between two areas, but only its registration as domestic or foreign trade. This assumption contrasts with the well-known border effect (Engel and Rogers Reference Engel and Rogers1996), but unfortunately there is no viable alternative. Any adjustment to take the effect into account would be totally arbitrary given our very limited knowledge on the formal and informal barriers to trade in those years. The estimation method differs according to the situation at time t of the areas affected by border changes. They could belong to polities that existed in 1913 (defined 1913 polities) or to polities which did not exist in 1913 (non-1913 polities). We distinguish four cases.
a) At time t, a 1913 polity existed, but part of its territory belonged to one or more non-1913 polities or, equivalently, in 1913 a non-1913 polity fully belonged to a 1913 polity. This is the case of the unification of six polities into the Kingdom of Italy in 1861 or of the division of Eire from the United Kingdom in 1921. In both cases, at time t (1860 or 1922, respectively) world trade was higher at current borders than at 1913 borders («trade creation») by the amount of bilateral trade.
b) At time t, the territory of a no longer existing 1913 polity, such as Austria-Hungary, was divided into two or more non-1913 polities (in this case, Austria, Hungary and Czechoslovakia). This is a variant of the previous case and thus the change increases total trade.
c) At time t two 1913 polities were united – that is a 1913 polity, such as Romania before 1859, belonged entirely to a different 1913 polity (the Ottoman Empire). This is the opposite of case a).Footnote 3 The boundary change reduces world trade at current relative to 1913 borders («trade destruction») because at time t the flows between the two 1913 polities would appear as domestic trade.
d) A region belonged to a 1913 polity in 1913 and to a non-1913 polity at time t. For instance, until 1914, part of post-war Poland, the so called Grand Duchy of Warsaw, belonged to Imperial Russia. In that case, the effect of a border change on world trade is undetermined.
Our correction does not consider changes in borders affecting two 1913 polities, such as the transfer of Alsace Lorraine from France to Germany in 1870 and back to France in 1918. These changes caused a re-classification of the same flows, which we assume had remained constant. The flow from Paris to Strasbourg would be classified as domestic trade before 1870, as international trade from 1870 to 1918 (and thus included in world trade at 1913 borders) and again as domestic trade after 1919 (and vice-versa a flow from Berlin to Strasbourg). It can be shown that under our hypothesis of invariance of flows, these border changes did not affect total world trade, although they changed the shares of France and Germany. Our method reduces drastically the number and the impact of border adjustments before 1913. The German unification is already factored in the series, which refers to the Zollverein throughout the period and thus the main changes were the political unification of Italy and the custom unification(s) of Canada (1867), Australia (1901) and South Africa (1910). This contrasts with the massive changes after World War One, as the result of the dissolution of Austria-Hungary and of the Ottoman Empire.
Only a minority of «modern» estimates provide series of trade at constant prices. In all other cases, we have obtained them by deflating the series at current prices. Whenever possible we have used price indexes from official sources such as League of Nations (1933-1938) or the literature (e.g. Birnberg and Resnick Reference Birnberg and Resnick1975). Jointly, these «modern» sources provide about a quarter of the observations by polity/year. In about as many cases, we use indexes from similar policies – for example the price indexes for Jamaica for other Caribbean sugar islands. In the remaining cases, about a half of all observations, we have estimated polity-specific «Federico and Tena-Junguito» price indexes for imports and for exports. Following a tradition which harks back to the seminal work by Prebisch (Reference Prebisch1950 and Reference Prebisch1959) and Singer Hans (Reference Singer Hans1950) we use British prices, adjusting for transport costs to obtain local prices by adding an estimate of freights for imports or subtracting for exports.Footnote 4 We have collected 54 series of British prices for the period 1800-1850, mostly from the Appendix to Gayer-Rostow-Schwartz (Reference Gayer, Rostow and Schwartz1953) and 122 for 1850-1938, from Sauerbeck (1886 ff) and the United Kingdom Annual statement (ad annum), and 32 route/specific series for inbound freights into the United Kingdom and 16 for outbound freights, from the recent literature (e.g. Harley Reference Harley1988 and Reference Harley1989; Shah and Williamson Reference Shah and Williamson2003; Klovland Reference Klovland2006; Jacks and Pendakur Reference Jacks and Pendakur2010). We compute polity-specific price indexes by weighting the price series with data on the composition of imports and exports, from national sources and international compilations, such as MacGregor (1849 and 1850) for the first half of the 19th century and the trade yearbooks of the United States of America (1909), and of the United Kingdom for the period after 1850. When possible, we collect data at 5-year intervals, interpolate them linearly to get yearly shares, and compute Fisher price indexes as the geometric average of Laspeyres and Paasche ones. Unfortunately, in about a quarter of total observations, we have only one set of data for imports or exports, and thus we have been forced to compute Laspeyres indexes.
Finally, we convert all series from local currencies, which for colonies usually coincided with that of the colonial power, into U.S. current or 1913 dollars.Footnote 5 Whenever possible we use polity-specific sources or general compilations such as Denzel (Reference Denzel2010) for the period before 1914 or the League of Nations (1933-1938) for the interwar years and the MOXLAD database for Latin American countries. We rely on the handy, but often flawed, data from Global Financial Data only as a last resort. We proxy the exchange rate of silver-based currencies, if no reliable series is available, with the series of gold price of silver (Jastram Reference Jastram1981). The U.S. dollar floated from 1861 to 1879, and during the Civil War it devalued substantially relative to the gold-based currencies. Using the market exchange rate would artificially inflate the series and thus, following Simon (Reference Simon1960: 629), in those years we convert other currencies into dollars at the gold parity.
4. THE RELIABILITY OF OUR SERIES
As a rule, we trust our sources and assume the data to be correct (Federico and Tena-Junguito Reference Federico and Tena-Junguito1991), unless we have independent and strong evidence to the contrary. On the other hand, the description of the previous Section makes it clear that the quality of our series differs a lot between polities and, for each polity, across time. We classify each yearly observation into five categories: (i) high-quality series at current prices, deflated with a «modern» price index (A); (ii) good quality series deflated with high-quality Federico and Tena-Junguito price indexes (B); (iii) average-quality series with some interpolation deflated with an average quality Federico and Tena-Junguito price indexes (C); (iv) poor current price series with low quality polity-specific Federico and Tena-Junguito indexes or proxy (D); (v) purely conjectural estimates (E). In this classification, we define «high quality» as the series at current prices produced by modern scholars or by established statistical offices, with very few or no gaps and consistent treatment of bullion and transit, «good» the official series with small gaps and/or imperfect estimates of transit and bullion trade, «average» the series at current price obtained with substantial interpolation from official data and/or with no adjustment for transit and bullion and «poor» the series pieced together from few observations, supplemented with additional evidence (e.g. trade with partners).Footnote 6
With these criteria, we classify 15 per cent of observations as A, 16.7 per cent as B, 29.1 per cent as C, 22.9 per cent as D and 16.3 per cent as E. The proportion of very good (As) or good (Bs) estimates has increased steadily over time, with few reversals, which reflect the geographical extension of the database outside the core countries of Western Europe and the Western Settlements. In fact, the two top categories estimates accounted only for one eight of the observations in Asian, Latin American and African countries in 1850-1874 and for slightly above a quarter in 1900-1913 and 1930-1938. These continents, however, accounted for a small proportion of world trade. Thus, the percentage of very good or good series is substantially larger if each observation is weighted with the share of the polity on world exports at current prices at current boundaries (Figure 2).
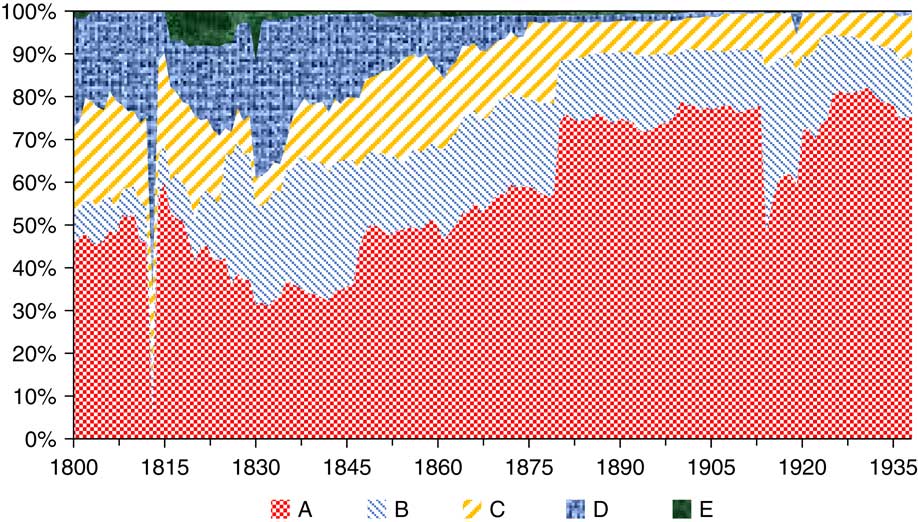
Figure 2 Distribution of trade data by level of reliability, 1800-1938 (per cent) Note: See text. A:high quality; B:good quality; C: average-quality; D: low quality; E:purely conjectural. Sources: Federico and Tena-Junguito (Reference Federico and Tena-Junguito2016b), Appendix E. Table E.
The top-quality estimates (As) account for half of world exports in 1850-1874, rising to over three quarters in 1900-1913 and to four fifths on the eve of World War Two. The collapse in 1813 reflects the substitution of missing British exports (custom records were destroyed by fire) with an average of the 1812 and 1814 figures. The share fell during World War One because Germany suspended the publication of trade statistics, and we rely on an estimate. The low quality estimates (the sum of Ds and Es) accounted at most for a third of world exports in the 1830s, and their share declined below 5 per cent in the 20th century.
We express our assessment of the reliability of the database in a compact way by computing the standard error of our series following Feinstein and Thomas (Reference Feinstein and Thomas2001). They show it to be equal to the square root of the sum of variances if errors of series are independent. In the case of our database, this hypothesis is plausible. There is no reason for errors to be correlated when series are collected independently, although correlation is possible in the (few) cases of using data from a polity as proxy for trade of a missing one. We attach to each category a likely margin of error – less than 5 per cent for the As (i.e. we assume the true value to be in a±2.5 per cent range around the observation), 5-10 per cent for the Bs (±5 per cent), 10-25 per cent for the Cs (±12.5 per cent), 25-40 per cent for the Ds (±20 per cent) and over 40 per cent for the Es (conventionally assumed ±25 per cent). We then compute the ratio of the standard error to the value of exports in any given year.
Neglecting the 1813 spike, the world-wide ratio remains constantly below 10 per cent, because most exports originated in A-rated polities in Europe and in the Americas. The range errors in the initial decades are quite wide for Asia (with peaks around to 30 per cent in the 1820s) and Africa (about 20 per cent in the 1820s) but shrinks below 10 per cent for both continents in the late 19th century. The narrow range of errors implies a correspondingly small bias in the rates of change. One can compute the maximum (minimum) possible increase in trade assuming that at the beginning of the period world trade was at the bottom (top) of the range and that at its end it moved to the top (bottom) of its range. Under these extreme, and thus rather implausible, hypotheses, the increase from the early-1830s to the eve of World War One would range from a minimum of 18.7 times to a maximum of 20.4, vs. 19.5 times for our series. Summing up, we deem our series quite robust to errors in polity data, unless our sanguine assessment of the quality of the series of the largest countries is spectacularly wrong.
5. THE GROWTH OF WORLD TRADE
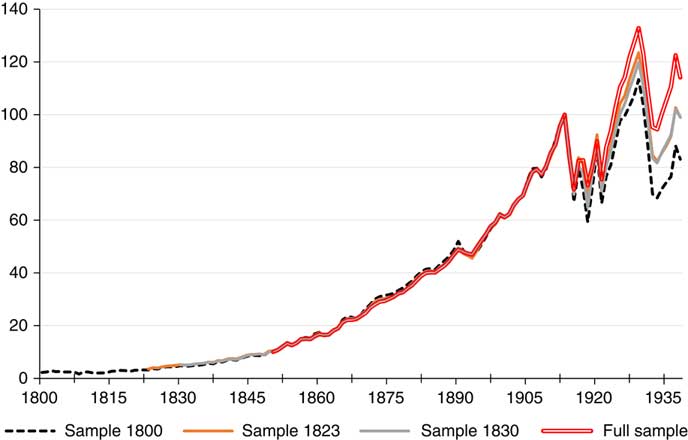
By definition, summing up all available polity series while the database is still being populated would overestimate the growth of trade. In order to have comparable data, the series coverage must be constant in time. This condition is met by definition after 1850, while for the previous period we compute three «sample-specific» time-invariant indexes, starting in 1800, 1823 and 1830 and featuring respectively 12, 62 and 89 polities (Figure 3).
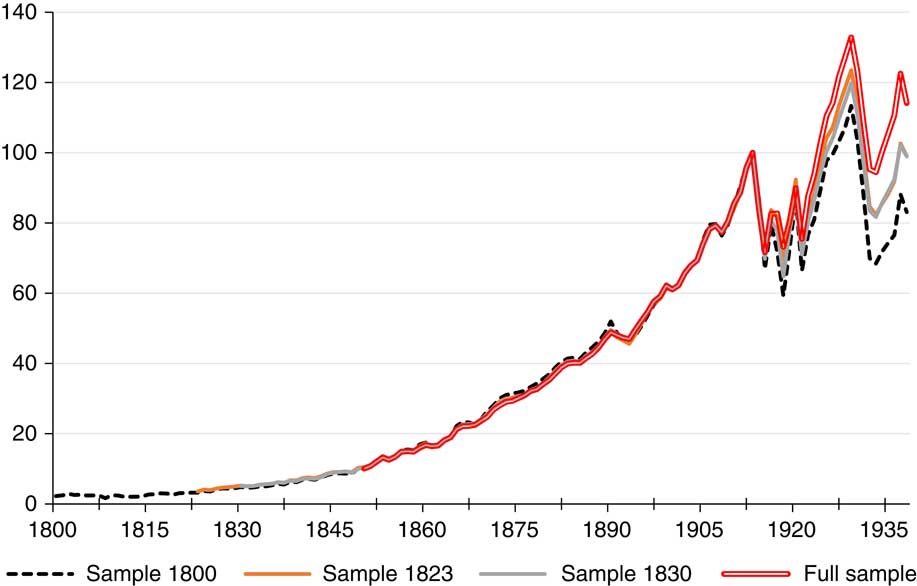
Figure 3 Indexes of world trade (1913=100) Sources: «World Trade Data 1800-1938» http://www.uc3m.es/tradehist_db and text
A visual inspection indicates that trends seem very similar, at least until World War One, but this is not sufficient evidence that the sample-specific series are unbiased estimates of total trade. Movements in exports might differ between the included and the missing polities as much as to cause total trade to diverge from the indexes. We explore this possibility by comparing each «sample specific» series with the «full sample» one from 1850 to 1880. We compute exports of polities missing from each sample (W M) as the difference between total trade (W) and exports of the included polities (W S). We test a «weak» and a «strong» null hypothesis – that is that the rates of growth of trade are equal between each sample and its missing polities (i.e. w St=w Mt) or that rates of growth are equal between each sample and world trade (w St=w).Footnote 7 The test fails to reject the «weak» null hypothesis for all samples, and the «strong» one for the 1,823 sample (Table 1).Footnote 8
Table 1 THE BIASES FROM MISSING POLITIES 1850-80

Sources: «World Trade Data 1800-1938» http://www.uc3m.es/tradehist_db and text
Although reassuring, these results are not conclusive as it is still possible that trends for missing polities differed between 1800-1850 and 1850-1880. In the extreme case that exports for all missing polities had not grown at all before their inclusion in the database (i.e. w Mt=0), our series would overestimate the growth of trade by one third in the whole period 1800-1850 and by a half in 1800-1823.Footnote 9 However, this hypothesis implies that (i) the whole increase in exports of included polities was absorbed by other polities in the sample and (ii) the exports of the missing polities started to grow only as soon as they entered the database. Both conditions are highly implausible: actually, the 47 polities omitted from the «1800 sample» and included in the «1823 sample» grew less than the whole «1800 sample» from 1823 to 1850.Footnote 10
The previous analysis suggests that biases from changing coverage were small enough and that we can use the «sample-specific» indexes as proxies for total exports. We build our «world index» for the whole period 1800-1938 by extrapolating backwards the «full sample» index from 1850 to 1830 with the «1830 sample» index, from 1830 to 1823 with the «1823 sample» index and finally from 1823 to 1800 with the «1800 sample» index.
The resulting index (Figure 4) by and large confirms the conventional wisdom: trade stagnated during the Napoleonic wars, grew very fast until World War One and fluctuated widely thereafter. Bai-Perron (Reference Bai and Perron2003) tests point out to structural breaks in 1815, 1870, 1910 and 1925, but we suspect the two latter dates to be affected by trimming. Thus in Table 2 we estimate rates of change of trade in the 20th century according to a more conventional periodisation, with breaks in 1913 and 1929.
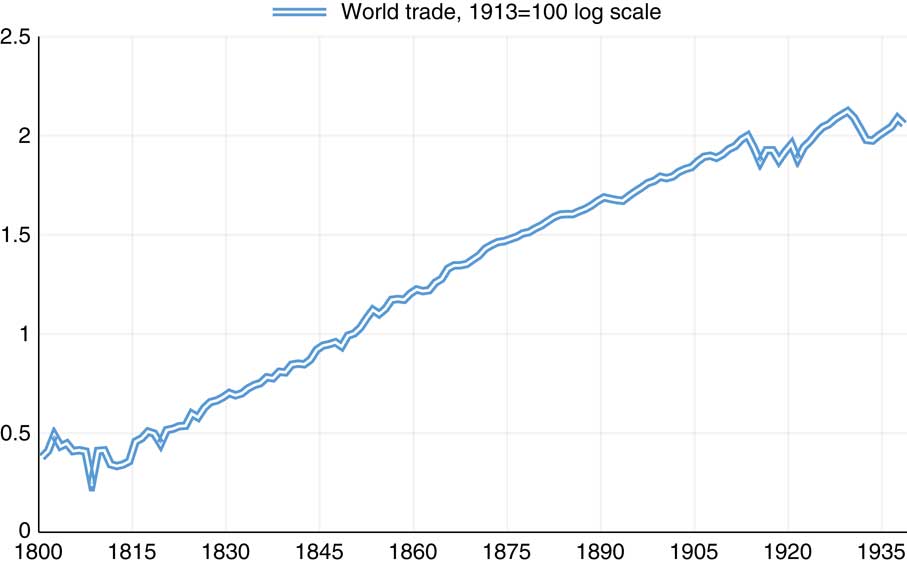
Figure 4 World trade, 1800 to 1938, 1913=100, log scale Sources: «World Trade Data 1800-1938» http://www.uc3m.es/tradehist_db and text
Table 2 RATES OF GROWTH OF WORLD TRADE, 1800-1938

***Significant at 1%.
Sources: «World Trade Data 1800-1938» http://www.uc3m.es/tradehist_db and text
This exercise shows that, contrary to the conventional wisdom, trade grew faster before 1870. The difference between the rates is statistically significant at 1 per cent and yields a quite substantial divergence if cumulated in the long run. If trade had been growing after 1870 as fast as before 1870, in 1913 it would have been 60 per cent greater, or 52 times greater than in 1816, rather than «only» 32 times. Admittedly, the initial growth includes the recovery from the shock of the French wars, but this effect is by no means large enough to account for the difference between the two periods. The estimates by O’rourke (Reference O’rourke2006) imply that the recovery accounted for less than 7 per cent of the increase to 1867 and for less than 2 per cent of the growth to World War One.Footnote 11 The difference between the two periods would be even starker if we considered the ratio of exports to GDP, which can be computed for a sample of 18 polities, including all the major ones except Germany. It doubled from 1830 to 1870 and remained constant from the 1870 to World War One (Federico and Tena-Junguito Reference Federico and Tena-Junguito2017b).
World trade never fully recovered from World War One. Its outbreak caused trade to decline by about a quarter and it remained depressed until 1918, despite a small rebound in 1916 and 1917. The figure is marginally lower than the estimates obtained by Glick and Taylor (Reference Glick and Taylor2010) using a gravity model of bilateral trade, which in principle should measure the impact on trade, net of income effects. The impact of the Great Depression was as serious as the impact of World War One. By 1933, trade was 28 per cent below its 1929 level and 5 per cent below its 1913 level. The recover was only partial: at their pre-war peak, in 1938, world exports were still almost 10 per cent below the peak of 1929.
Our estimate of trade at constant borders strongly downplays the contribution of boundary changes to these movements. The effect was minimal before World War One and small after the War. In 1856-1858, the last 3 years of normal trade before Italian unification, world exports at current borders were 0.30 per cent higher at current than at 1913 borders. In 1863-1865, they were only 0.04 per cent greater. The fragmentation of the Habsburg and Ottoman empires caused a much larger difference: at its peak, in 1924, world exports at current borders exceeded exports at 1913 borders by 3.12 per cent, and European ones by 6.8 per cent. However, the re-adjustment of trade flows to the post-war map reduced the gap to 1.37 per cent in 1938 (2.70 per cent for Europe only). Note that this effect implies that the baseline series underestimates the growth of trade in interwar years: from 1924 to 1938 trade increased by 11.1 per cent if measured at current borders but by 12.9 per cent if estimated at 1913 borders.
How does our series change the conventional wisdom of the growth of world trade after 1850, as based on the available series? Table 3 reports the rates of change of our (full sample) series and all other available series.
Table 3 RATE OF GROWTH OF WORLD TRADE, ALTERNATIVE ESTIMATES, 1800-1938
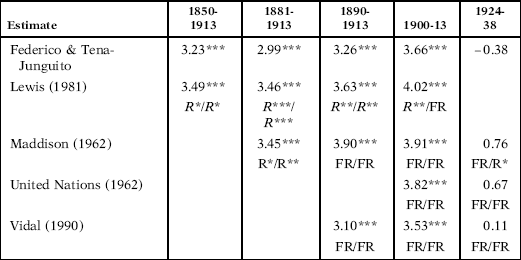
FR, failed to reject; R, rejected at *10%, **5%, ***10%.
Sources: «World Trade Data 1800-1938» http://www.uc3m.es/tradehist_db see also text, and Federico and Tena-Junguito (Reference Federico and Tena-Junguito2016b).
All alternative series except Vidal (Reference Vidal1990) grow faster than the current one, and a Wald test rejects the null of equal rates in most cases. The cumulated difference was substantial; for instance, trade in 1913 was 20 per cent higher according to Lewis than according to our series. All these series use largely the same sources for trade at current prices for the core countries, although in many cases we use more recent price series to deflate them. Thus the difference reflects mostly the coverage of less developed countries.Footnote 12 These differences can be highlighted by computing the root mean square error (RMSE) of the ratios between our series and the alternative ones. The RMSE for exports at current prices is 18.3 per cent of the average trade by polity for the database by Lewis Reference Lewis1981 (26 polities, 1850-1913), 22.7 per cent for the data by the League of Nations (113 polities, 1920-1938) and 40.0 per cent, or 30.5 per cent excluding the war years 1914-1918, for the series from the well-known and widely used database by Barbieri and Keschk (2014) (44 polities, 1870-1913). Unfortunately, this comparison is not possible for series at current prices of Maddison (Reference Maddison1962) and Vidal (Reference Vidal1990), nor for series at constant prices of any author, as the sources do not publish series by polity.
6. PERFORMANCE BY TRADING POLITIES
The growth of trade during the long 19th century benefitted almost all polities, with few exceptions.Footnote 13 Yet, not all polities benefitted to the same extent. The total share of the four major trading countries in world trade declined slightly from 47.9 per cent in 1850-1852 to 46.3 per cent in 1911-1913, an outcome of the decline of the United Kingdom (from 19.6 per cent to 13.6 per cent) and France (from 12.0 per cent to 7.5 per cent) and of the rise of Germany (from 7.4 per cent to 12.4 per cent) and of the United States (from 8.8 per cent to 12.9 per cent). During the interwar years, only the United States managed to increase its exports, by a fifth, and to maintain its pre-war share. All other big countries experienced an absolute decline in exports (France by a fifth, the United Kingdom and Germany by over a third) and thus a steep fall in their share of world exports, down to 4.0 per cent for France, 9.4 per cent for Germany and 10.2 per cent for England on the eve of World War Two. Of course it would be impossible to describe in any detail the performance of over one hundred trading polities, so in this section we group them according to four criteria, geographical location (as defined by continent), level of development, political status and factor endowment.Footnote 14
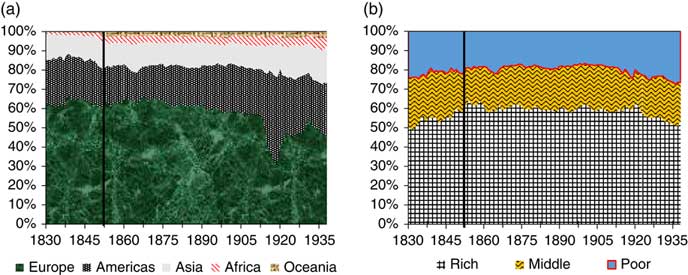
Figure 5a and b plots the shares by continent and level of development on world trade at current prices.Footnote 15 We group polities according to GDP per capita at 1870, the earliest available date for many of them in the Maddison Project database. We distinguish eleven «rich» countries, with a GDP at least half the British one (about 1600 Geary Khamis 1990 dollars) about twenty «poor» polities, with an income above the median (800 dollars), and we label the remainder as «very poor».Footnote 16
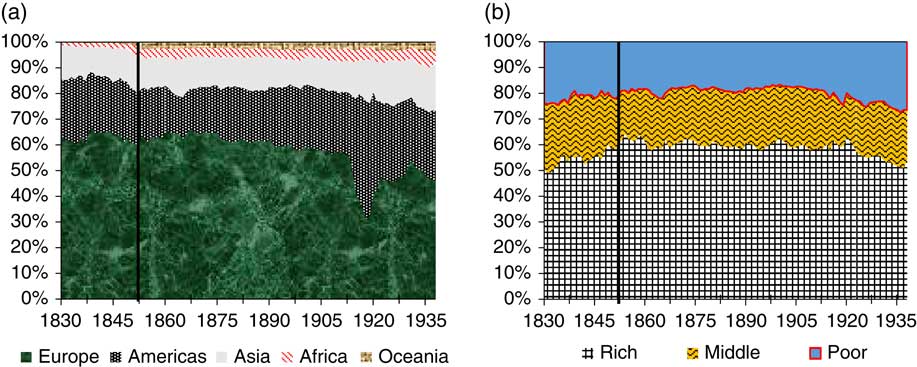
Figure 5 Share of world exports by continent, current prices, 1830-1938 (a) Continents (b) level of development. Sources: «World Trade Data 1800-1938» http://www.uc3m.es/tradehist_db and text.
The distribution of world exports remained pretty stable during the first globalisation. In the early-1830s, Europe accounted for 62 per cent of world exports and the advanced countries for about a half. This latter share increased by ten points in the 1850s and then remained around 60 per cent until 1913, while the share of Europe drifted slightly downwards to 56 per cent.Footnote 17 Indeed, exports from the four («rich») Western Settlement countries increased from about 10 per cent of total exports in 1850 to around 17 per cent on the eve of World War One, the most notable being the spectacular growth of exports from New Zealand, from 0.03 per cent to 0.6 per cent of world trade. The «poor» countries (mostly European periphery, a few South American countries, South Africa and the Ottoman Empire) managed to increase their share to Word War One, while the «very poor», including most of Asia and Africa, experienced a slight decline, from 21.7 per cent to 18.8 per cent of world exports. This latter performance reflects the collapse of the share of Caribbean islands and also the poor performance of India and China. The Indian export share rose from about 5 per cent in the 1850s to almost 7 per cent in the late 1880s (when it was the fifth largest world exporter) but declined to less than 4 per cent at the turn of the century. Chinese exports collapsed during the Tai’Ping War and, despite a modest recovery in the 1870s and 1880s, its share was barely a half of the pre-rebellion one (1.6 per cent vs. 3.2 per cent) on the eve of World War One.
The War and the Russian Revolution accelerated these trends. In 1929, European exports exceeded the pre-war level by 11 per cent, and only by 5 per cent at constant boundaries, and Soviet exports were a third of the Russian ones in 1913. European exports fell by a third until 1933 and remained low until the War.Footnote 18 The share of the «rich» countries remained broadly constant, with a peak close to a quarter in the 1920s, thanks to the rise of exports from the United States and other Western Settlement countries. The most important feature of the interwar years was however the impressive increase of the share of the «very poor» countries. They accounted for 21.7 per cent of world exports before the war, 23.3 per cent in 1929 and 27 per cent in 1936-1938. This increase was fuelled by the meteoric rise of Japan, which accounted for 0.12 per cent of world exports (and less than 1 per cent of exports of «very poor» polities) in 1859, 1.8 per cent (about a tenth) 3.7 per cent (a sixth) in 1929 and 5.2 per cent (a fifth) in 1938. However, all other «very poor» countries managed to increase their share by a few points. Most notably, exports from Sub-Saharan Africa (excluding South Africa) in 1938 were 40 per cent higher than in 1929 and almost three times higher than in 1913 in real terms, rising from 1.30 per cent of world total in 1911-1913 to 1.98 per cent in 1929 and finally to 2.78 per cent in 1936-1938. This increase reflected the fast rise of exports of tropical products from Western Africa and by the boom in mineral exports from Southern Africa, while other areas of the continent underperformed (Federico and Tena-Junguito Reference Federico and Tena-Junguito2017a).
These results show that the conventional wisdom regarding the «rich» countries is fairly accurate and thus a further analysis is unlikely to add much to the already extensive literature on their trade performance. Thus, in what follows we will focus on the «poor» and «very poor» polities, which have been so far largely neglected due to the paucity of comprehensive data. The geographical location would hardly be informative, as it largely overlaps with the level of development. «Poor» and «very poor» countries accounted for all exports from Asia, Africa and (South) America. It will suffice to add that «very poor» polities accounted for a negligible share of exports from Oceania and Europe, and that «poor» countries (Italy, Austria-Hungary, Russia) for about a quarter of European exports, with a slowly growing share. Thus we will focus on the two other criteria, political status (independent country or colony) and factor endowment. We extract the information on the political status in each year from the Correlates of War database, supplemented and corrected with other sources (Federico and Tena-Junguito Reference Federico and Tena-Junguito2016b), distinguishing old colonies (established before 1850) from new ones (established after 1850).Footnote 19 We proxy factor endowments with population density in 1913 as a crude measure of the land/labour ratio.Footnote 20 We measure the trade performance of each group of polities by averaging indexes of shares on world trade at current prices. We prefer this measure to the more conventional cumulated share of the group because the latter depends heavily on the performance of a few large polities.Footnote 21
The division according to political status (Figure 6a) highlights a clear divergence between the (underperforming) old colonies and all other «poor» and «very poor» polities. The average share of the old colonies halved from the 1850s to the early-1890s and then declined by a further fifth to the late 1930s. Their total share declined from 13.3 per cent to 11.1 per cent of world trade and then remained broadly stable until World War Two. The difference between average and total shares implies that large old colonies (most notably India and Indonesia) outperformed small ones. Most of the decline is explained by the exceptionally poor performance of sugar exporters in Africa (Reunion, Sao Tome) and in the Caribbean (Federico and Tena-Junguito Reference Federico and Tena-Junguito2018). The overall index for all colonies mirrors the trend for «old» colonies until the 1890s, but then rebounds sharply, increasing by over a third until World War One and by further ten points until the late 1930s (with the cumulated share growing from 12.6 per cent to 12.9 per cent and then jumping to 16.8 per cent in 1936-1938). This performance reflects the fast relative rise of exports from African colonies, while Asian ones were losing ground (Federico and Tena-Junguito Reference Federico and Tena-Junguito2017a). The overall stability of the indexes for independent countries from the 1850s to World War One is the net outcome of a massive divergence between relatively few good performers and the majority of countries: only six countries out of 34 (including Sweden and Argentina, plus Japan) managed to increase their share on the world market. The relative performance of independent countries improved during the interwar years, as almost half of them (15 out of 39) increased their exports by more than the total from 1911-1913 to 1936-1938.

Figure 6 Export performance by political status and factor endowments relative to the World (1850=100) (a) Political status. (b) Factor endowments Note: Quartile of population density in 1913. D1: first; D2: second; D3: third; D4: fourth. Sources: See criteria for the division of groups in text. Data: http://www.uc3m.es/tradehist_db
Grouping polities by quartile of population density in 1913 (Figure 6b) also yields a complex picture. Exports of polities from the second and third quartile (population density between 4 and 60 inhabitants per square kilometre) grew roughly as much as world trade, while land-scarce polities (fourth quartile, with population density above 60 inhabitants per square kilometre) underperformed, and land-abundant ones (first quartile, population less than 4 inhabitants per square kilometre) experienced a decline in the 19th century followed by a rebound in the 20th. This group includes mostly South American and African countries, while land-scarce polities were mostly located in the Caribbean, Asia and the European periphery.
This analysis suggests that no simple classification can explain the performance of the poor periphery. Aggregate shares are heavily affected by movements of large polities, such as India, Russia or Japan, while a look at unweighted averages unveils some fairly homogeneous clusters such as the former slave colonies of the Caribbean or Western and Southern Africa. However, all groups include a wide variety of polities, which cause averages export shares to converge towards the mean.
7. THE COMPOSITION OF TRADE
Data on the composition of trade are very abundant but extremely difficult to manage. The classification of products in trade statistics differed across polities and often changed in time. In principle, it would be possible to re-classify all data according to some standard international trade classification, such as the SITC, but this mammoth task is clearly beyond the scope of this paper. Thus, in this section we will focus on the basic division between primary products (SITC 0 to 4) and manufactures (SITC 5 to 8).Footnote 22 This division is available for all major countries in historical statistics or in the «modern» studies on trade, while we have collected data for most other polities to estimate our price indexes (cf. Section 3). Unfortunately, we have not been able to find data for some polities and the data for quite a few polities are incomplete. They cover only part of exports, with a clear bias against manufactures, and/or refer only to a few benchmark years. In about 5 per cent of the cases, we have to assume that the composition of trade remained constant and to rely on interpolations or extrapolations for a sizeable number of polity/year observations, which accounted for a fairly small percentage of trade (Table 4).
Table 4 TRADING POLITIES INCLUDED IN THE ESTIMATION OF PRIMARY PRODUCT SHARES

Sources: See text.
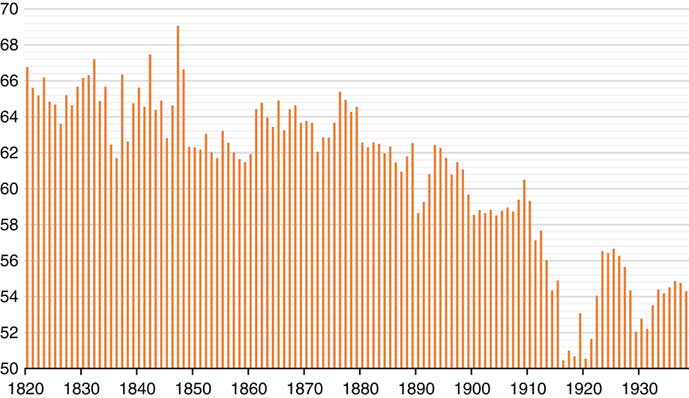
We compute our baseline series of primary product shares by weighting individual polity series with the share of the polity in the exports of all available polities. We deal with changes in polity coverage with the procedure we have employed for total trade. First, we build series for three different time-invariant samples, starting in 1820 («1820 sample», with 23 polities), 1830 («1830 sample», 32 polities) and 1850 («full sample», with 90-110 polities, depending on the year), and then we link them to obtain our «baseline» series from 1820 to 1938 (Figure 7) (Figure 8).
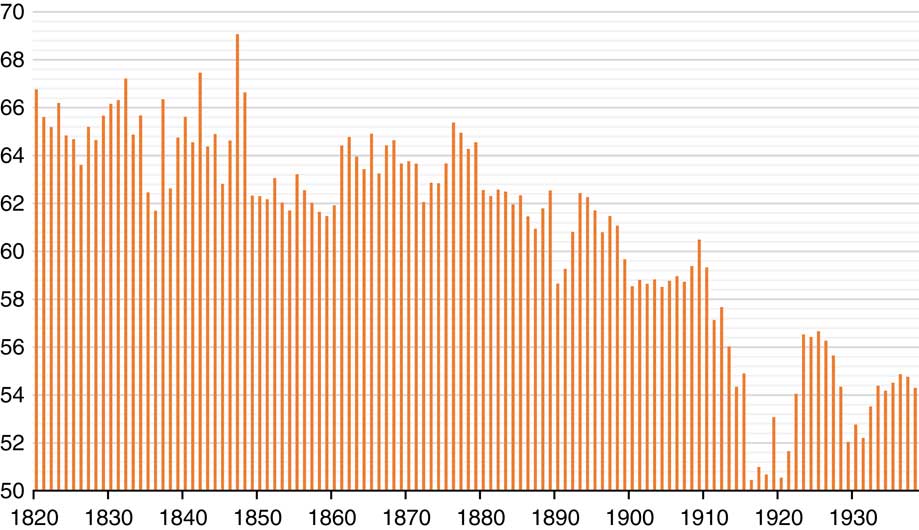
Figure 7 Share of primary products in exports, baseline series, 1820-1938 Sources: «product composition» http://www.uc3m.es/tradehist_db and text.
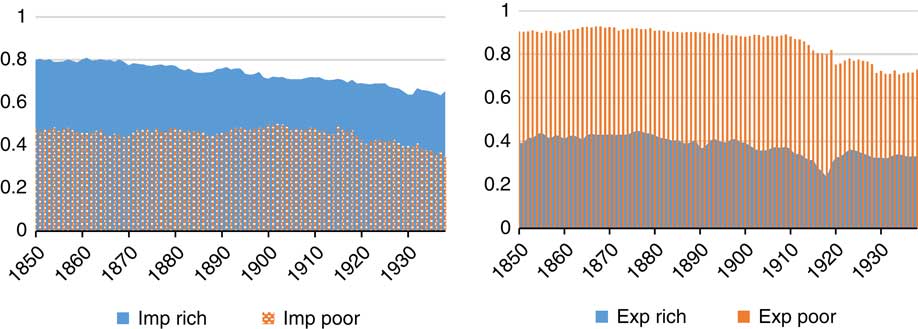
Figure 8 Share of primary products in exports and imports in rich and poor countries Sources: «product composition» http://www.uc3m.es/tradehist_db and text.
The series declines gradually from about 65 per cent in the 1820s to slightly above 55 per cent on the eve of World War One. The yearly rate of change during the «long 19th century» (−0.12 per cent yearly) corresponds to a decline by 11 per cent or about 7.5 percentage points. In contrast, the series, after a dip during World War One, shows no significant trend in the 1920s and 1930s. A Bai-Perron (Reference Bai and Perron2003) test on the full series adds two important qualifications – showing breaks in 1860 and 1929, as well as 1913 and 1922. The 1860 break corresponds to a sizeable (and statistically significant) acceleration of the rate of change, from −0.13 to −0.23.Footnote 23 The 1929 break highlights a change in direction, from a slow and statistically insignificant decline in the 1920s to a minimum of 52 per cent in 1929, to a sharp rise during the Great Depression. On the eve of the War, the share of primary products was back to its pre-War level.
Our series diverges substantially from the conventional wisdom, as inspired by the series by Lewis (Reference Lewis1952 and 1981) and the point estimates by Yates (1959 Tab A.17) for 1913, 1929 and 1937. Both authors suggest that the share of primary products was higher than our estimate (for instance in 1913 61.3 per cent and 64.1 per cent, respectively, vs. 56 per cent), possibly because of the bias against manufactures in the data collection. The series by Lewis (Reference Lewis1952 and 1981) is totally flat, although the lesser known series by Vidal (Reference Vidal1990) does show a decline in the share of primary products from 1890 onwards.Footnote 24
In a nutshell, our data suggest that the change in the composition of world trade started earlier than hitherto assumed. An analysis by continent shows a distinctive regional pattern.Footnote 25 During the «long» 19th century, primary products accounted for about 45 per cent of exports from Europe (with a peak above a half in the 1870s), and for almost all exports from Africa and Oceania. Thus, the world-wide decline reflected the sharp fall in the share of primary products in exports from Asia and, above all, from the Americas. In the early-1850s, they accounted for about 90 per cent of exports from the Americas and for 95 per cent of exports from Asia, while on the eve of World War One they represented less than two-thirds and about 85 per cent (the yearly rates of decrease being −0.71 per cent and −0.38 per cent, respectively). After the War, the decline continued in Asia, but not in the Americas. During the Great Depression, the shares of primary products increased in Europe, America and Asia and remained constant, at a very high level, in Africa and Oceania.
The decline in the share of primary products affected both rich and poor countries, from slightly over 10 per cent to around 7 per cent and from 90 per cent to 70 per cent on the eve of World War Two, respectively. However, a look at the import side highlights a relevant divergence from the conventional wisdom on trade before World War Two as characterised by the vertical exchange of primary products from the periphery for manufactures from the core countries. Primary products accounted for most exports of poor countries (on average 88.7 per cent over the whole period) and of imports of rich countries (71.3 per cent), but, in contrast with the conventional wisdom, they accounted for two-fifths of exports from rich countries (40.0 per cent) and for slightly less than half of the imports of poor countries (47.9 per cent)
The share of primary products in the imports of poor countries exceeded a third in 56 cases out of 100, a half in 33 and two thirds in 13. These data suggest that British exports (average share of primary products 16.6 per cent) are hardly representative of imports of poor countries, and the widespread use of British export prices to deflate series of imports for poor countries (cf. e.g. Frankema et al. Reference Frankema, Williamson and Woltjer2018) might yield biased results.
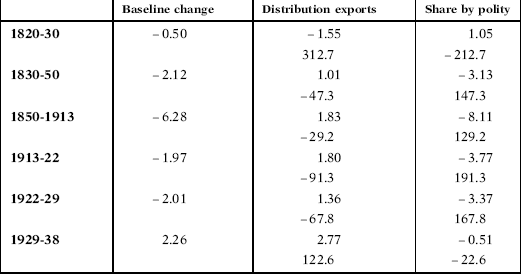
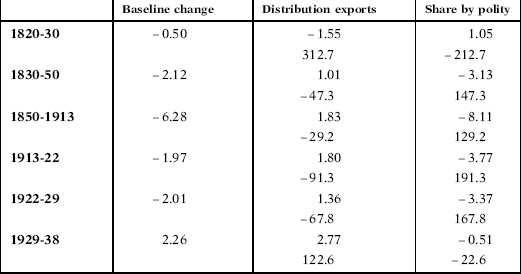
A comprehensive analysis of the causes of the decline of the share of primary products is beyond the scope of this paper. However, one can glean insights from a very simple decomposition of long-run changes between polity-specific trends and changes in the distribution of trade by polity (Table 5). For each period, we report the absolute values (as percentage points) in the first row and in the second (in italics) the corresponding percentages (adding up to one)
Thus, for instance, from 1850 to 1913 (row «1850-1913») the actual share declined by over 6 percentage points, the outcome of a strong decline in polity specific shares, only partially compensated by changes in the distribution of exports by polity. This pattern prevailed in all periods from 1830 to 1929. In contrast, during the Great Depression, the share of primary products continued to decrease in most polities, but its effect was more than compensated by the increase in the share of poor polities in world trade.
An examination of the data by polity shows that the decline in the share of primary products was hardly generalised (Table 6).
Table 6 CHANGE IN THE SHARE OF PRIMARY PRODUCTS, BY POLITY, 1820-1938
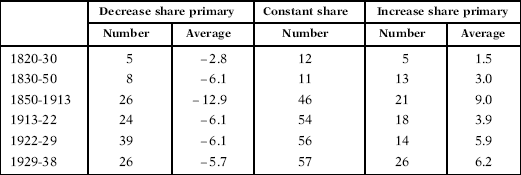
Sources: «Product composition» http://www.uc3m.es/tradehist_db and text.
About a half of polities did not experience any change in the share of primary products. In some cases, shares remain stable by assumption, but, as previously mentioned, they account for a small percentage of total trade (Table 4). More polities experienced a decline than a rise in the share of primary products, and the unweighted average of changes was larger than the trade-weighted one, except during the Great Depression – that is the decline was larger in small polities.
These differences, however, are too small to account for the massive decrease in the world share of primary products. This decrease was driven by several large countries, most notably the United States. Primary products (mostly cotton) accounted for 80 per cent of American exports in 1850 and for less than one-third in 1913, while the share of the United States in the exports of the full sample increased by a third (from 9.3 per cent to 12.8 per cent). If this latter had remained constant, the world share of primary products would have declined by 5.1 percentage points rather than by 6.3. If the share of commodities in American exports had remained constant, the world share would have increased by 0.45. If both shares had remained at their 1850 level, the world share would have marginally decreased by 0.23 points. This simple exercise highlights the impact of the transformation of the United States from an exporter of primary products to an exporter of industrial goods. Other European countries, such as the Netherlands, Sweden, Germany and Italy experienced a similar change in export composition, but their impact on world shares was compensated for by the increase in the share of primary products in exports of France (from 30 per cent to 40 per cent) and, above all, the United Kingdom (from less than a sixth to about a fifth). Likewise, one can explain the decline in the share of primary products in Asian exports in the interwar years with the rise of Japan: if the Japanese share of Asian exports and the composition of its exports had remained at their 1922 level, the share of commodities in Asian exports would have increased, although marginally, rather than decreasing.
As mentioned, the database omits some polities and the coverage of the included ones is partial. The omission of polities is a serious problem before 1850. Polities included in the «1820» and «1830» sample accounted for slightly over a half and for about two thirds of world trade after 1850, respectively. Furthermore, the rates of change in the share of primary products from 1850 to 1913 are not significant and substantially lower than the «full» sample one (−0.09 and −0.04, respectively, vs. −0.18). This is not conclusive evidence, but surely casts some doubt on the representativeness of the two samples and thus on the trends before 1850. (Figure 9)
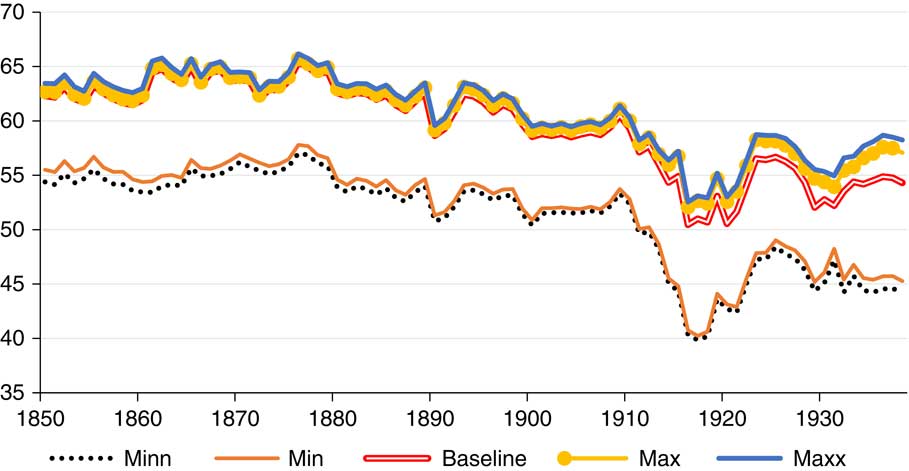
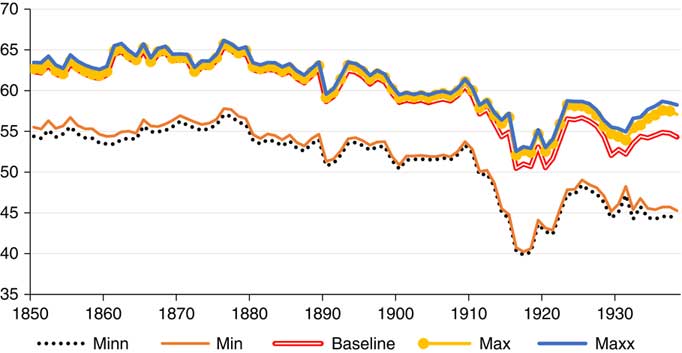
Figure 9 Share of primary products, robustness test, 1800-1938 Sources: «product composition» http://www.uc3m.es/tradehist_db and text.
After 1850, the polity coverage is almost complete (around 98 per cent of world trade) and the product coverage of the included polities is very high (around 90 per cent). These figures are reassuring, but we have nevertheless performed a double robustness test (see Appendix A for the derivation of the formulas).
The lines «Max» and «Min» are upper and lower bounds of the share of commodities in exports for each polity/year, computed under the assumptions that the missing products for covered polities were all commodities or all manufactures, respectively. The high product coverage implies that the «Max» series is much closer to the baseline than the «Min» one.Footnote 26 Even this latter estimation, however, is highly correlated with the baseline series in the long run (0.973) and in 1850-1913 (0.928), although the coefficient falls to 0.571 in the interwar years.Footnote 27 The lines «Maxx» and «Minn» also take into account missing polities, assuming that they all exported primary products. As predicted, the differences between the «Min» and «max» series are negligible and the coefficients of correlation with the baseline remain over 0.95.
8. CONCLUSIONS
This paper outlines the main trends in world trade during the period 1800-1938 using our newly compiled database of series by polity. It improves pre-existing series, most notably the pioneering work of Lewis (Reference Lewis1981), because it covers the first half of the 19th century, takes into account the most recent work and comprehensively covers the peripheral countries, which had been largely neglected in the literature. Overall, our work adds some new stylised facts and suggests relevant qualifications to the conventional wisdom.
World trade grew very fast from the end of Napoleonic Wars to World War One, recovered partially from the War and was hit again by the Great Depression. Thus, our data by and large confirm the conventional wisdom after 1870, but highlight how growth before 1870 was faster. The combination of slow growth of GDP and fast growth in trade single out those years, rather than the pre-war decades as the key period of the first globalisation.
The distribution of world trade by polity changed a lot in the long run, but it is difficult to identify common trends. A simple preliminary analysis of the export performance of the «poor» and «very poor» polities according to political status and factor endowments shows a complex pattern, featuring some notable clusters (most notably the Caribbean sugar producers) but also a wide variance of performance within each group.
World trade was not a simple vertical exchange of primary products from the periphery for manufactures from the core countries. Primary products accounted for about half of the imports of poor countries and for about a third of exports from core countries. Overall, primary products accounted by about half of world trade, but their share started to decline around mid-century and the downward trend continued to the outbreak of the Great Depression. The share decreased in most, but not all polities, and the trends in world shares were affected by declines in some big countries, most notably the United States,
These results are robust given the available data, but are by definition provisional. The work on foreign trade statistics is ongoing and new or revised polity series will be made available in the future. We aim to incorporate them and to correct any errors with a periodic revision of the database. New revisions of peripheral countries participation on World trade open future avenues of research on poor and rich terms of trade and changes in comparative advantage in the long run.
Acknowledgements
Received 19 June 2018. Accepted 7 November 2018.We would like to thank, first of all, the invaluable research assistance of Sara Pecchioli. Second, the competent work and ideas of UC3M Librarians, especially Eva Ortiz Uceta, and Carolina Pere Pedrol, but also Santiago Martínez Gándara y Carlos Romo García for the elaboration of the http://www.uc3m.es/tradehist_db. Giovanni Federico research was funded by a European Research Council Advanced Research grant «Market Integration and the Welfare of Europeans» (n.230484, years 2009-2013) and Antonio Tena-Junguito was funded by the Spanish Ministry of Science and Innovation ECO2011-25713 and ECO2014-58784-P.
Supplementary material
To view supplementary material for this article, please visit https://doi.org/10.1017/S0212610918000216


