1. Introduction
Ogihara et al. (Reference Ogihara, Fujita, Tominaga, Ishigaki, Kashimoto, Takahashi, Toyohara and Uchida2015) demonstrated that the rates of common Chinese characters used in baby names increased but the rates of common readings decreased in Japan between 2004 and 2013. Further, they showed that writing variations of names decreased, but reading variations increased for the period. Taken together, these results were interpreted to indicate that parents came to give unique names by assigning more common Chinese characters but reading them uncommonly. Thus, this research shows an increase in uniqueness-seeking and individualism in Japan. This shift toward greater individualism has also been reported in other cultural aspects in Japan (Hamamura, Reference Hamamura2012; Ogihara, Reference Ogihara2017b; Reference Ogihara2018b; Reference Ogihara2020b; Taras et al., Reference Taras, Steel and Kirkman2012; for reviews, see Ogihara, Reference Ogihara2017a; Reference Ogihara, Uskul and Oishi2018a).
These results may be difficult to understand especially for non-native Japanese speakers because names and naming practices in Japan are different from those in other cultures. In Japan, three types of characteristics can be used for names: hiragana, katakana, and Chinese characters. Hiragana and katakana are phonograms, which are symbols representing speech sounds without reference to meanings (e.g., alphabet). Thus, writings and readings of hiragana and katakana are fixed. In contrast, Chinese characters are ideograms, which are symbols representing concepts without reference to sounds. Thus, writings and readings of Chinese characters are not fixed. Importantly, people can give any readings to a Chinese character used for baby names. For example, a common writing for a boys’ name “大翔” has at least 18 variations of readings (Ogihara, Reference Ogihara2021c). This naming practice makes it possible to give unique names in Japan (for patterns of uncommon names, see Ogihara, Reference Ogihara2015; Reference Ogihara2021b).
Moreover, Ogihara (Reference Ogihara2021a) directly examined whether the rates of unique names, rather than common names, increased by analyzing datasets of baby names that includes both writings and readings. This shows that unique names increased in Japan between 2004 and 2018, consistent with the prior study (Ogihara et al., Reference Ogihara, Fujita, Tominaga, Ishigaki, Kashimoto, Takahashi, Toyohara and Uchida2015).
It is important to empirically confirm whether these prior findings are valid and robust. Indeed, the reproducibility of science is considered valuable (e.g., Open Science Collaboration, 2012; 2015). Therefore, this study analyzed another indicator of names that had not been investigated in Ogihara (Reference Ogihara2021a): temporal changes in the rates of common names. Based on the previous findings that unique names increased in Japan (Ogihara, Reference Ogihara2021a), it was hypothesized that the rates of common names had decreased in Japan.
2. Method
2.1. Data
I analyzed the data that are open to the public (https://doi.org/10.17605/OSF.IO/2WURJ; for details, see Ogihara, Reference Ogihara2020a) and have been used in previous research (Ogihara, Reference Ogihara2021a; Reference Ogihara2021c).
The data were from annual surveys conducted by the Meiji Yasuda Life Insurance Company between 2004 and 2018 (Meiji Yasuda Life Insurance Company, 2020; Ogihara, Reference Ogihara2020a). To be more specific, the data were generated from lists of readings in the top 10 most common writings, which are published by Meiji Yasuda. Although the top 10 writings are common, their readings can differ within each writing. Thus, each name is not necessarily common. For instance, a common writing “大翔” has many readings, such as “Hiroto,” “Haruto,” “Yamato,” and “Tsubasa”, but the name that is written as “大翔” and read “Tsubasa” is uncommon (Ogihara, Reference Ogihara2021c).
Sample sizes for each year are summarized in Table 1. The average annual sample sizes for the raw data were 251 for boys and 268 for girls. The total sample sizes were 3,762 for boys and 4,017 for girls. The average annual sample sizes for the original surveys were 5,242 for boys and 4,958 for girls. The total sample sizes were 78,623 for boys and 74,372 for girls.
Table 1. Sample sizes for each year

2.2. Indicator
The rates of the top 10 most common names were calculated separately for boys and girls because many prior studies used this rate as the main indicator (e.g., Ogihara et al., Reference Ogihara, Fujita, Tominaga, Ishigaki, Kashimoto, Takahashi, Toyohara and Uchida2015; Varnum & Kitayama, Reference Varnum and Kitayama2011). The top 10 most common names were determined by absolute frequencies. For example, they included 大翔 (ひろと: Hiroto) and 蓮 (れん: Ren) for boys’ names and 陽菜 (ひな: Hina) and さくら (Sakura) for girls’ names. Moreover, to confirm whether the results were robust, the rates of the top 5 and 15 most common names were calculated.Footnote 1 If the phenomenon of a decrease in common names was robust, then consistent results should be observed, regardless of these indicators.
2.3. Analysis
First, I computed the percentage of each individual name among the total sample size of the original surveys. Then, I calculated the percentage of the top 5, 10, and 15 most common names in each year. In this calculation, when more than 5, 10, or 15 names were included in the common names, the percentage was adjusted (e.g., 11 names in the top 10 most common names due to a duplicated rank).
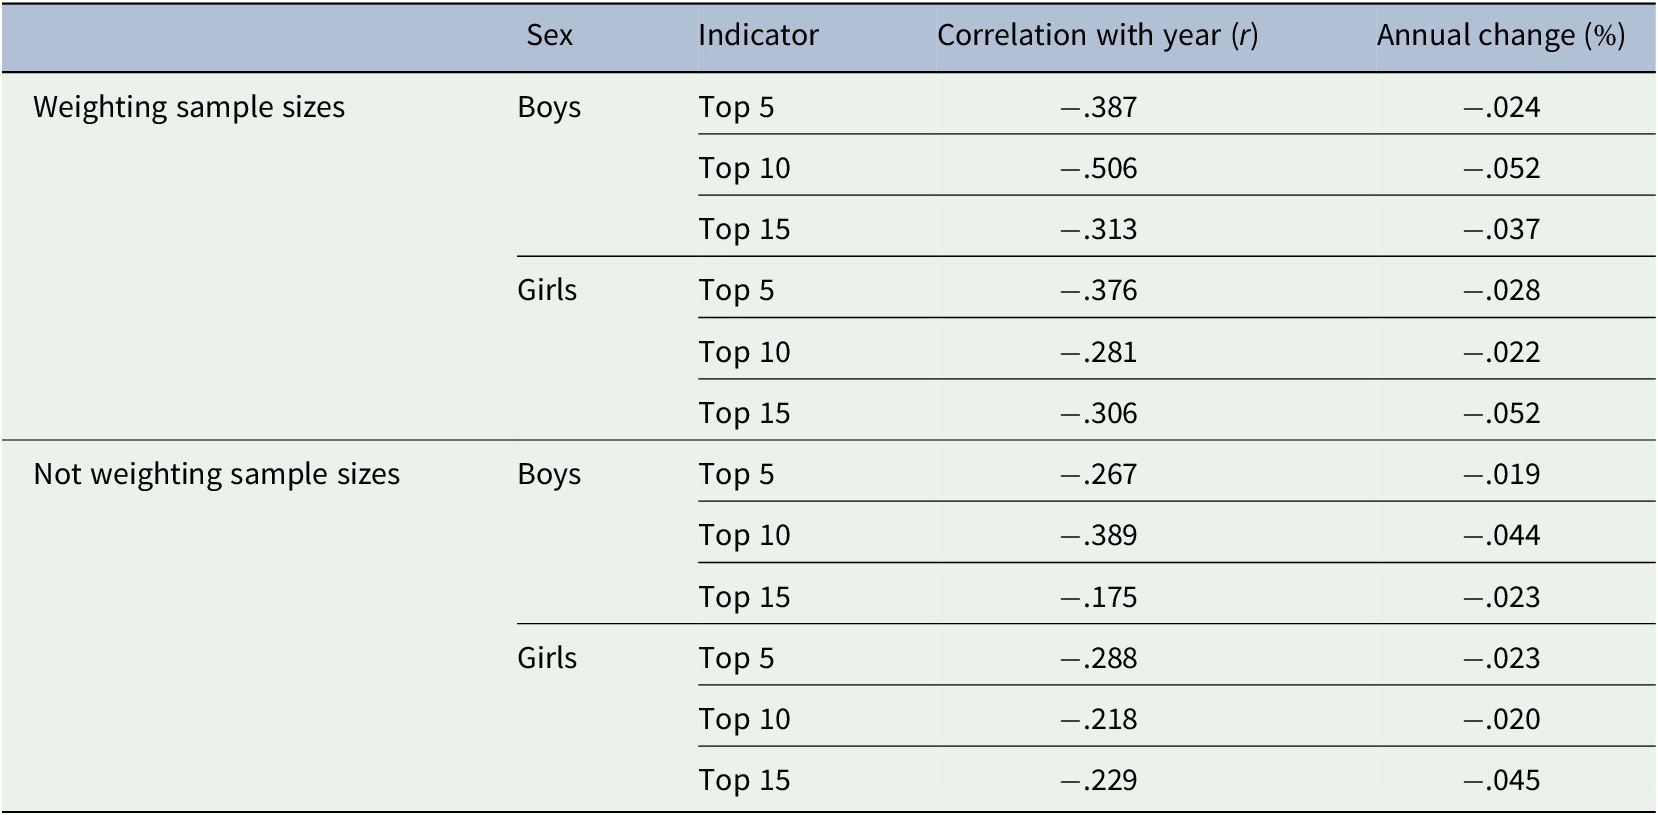
Next, I calculated two indices: correlation with year (r) and annual change (%). Correlation with year indicates how each percentage of common names increased, decreased, or did not change over time. Annual change indicates the extent to which each percentage of common names varied. For this index, I conducted a simple regression analysis in which the year was an independent variable and the percentage of common name was a dependent variable. In this calculation, a significance test was not conducted. This was because the data points were not considered independent, which is necessary to conduct a significance test. Analyses were conducted both weighing and unweighting the sample sizes of individual years (e.g., Clark et al., Reference Clark, Loxton and Tobin2015; Li et al., Reference Li, Li, Mei and Wang2020; Ogihara, Reference Ogihara2019; Reference Ogihara2020c; Ogihara et al., Reference Ogihara, Fujita, Tominaga, Ishigaki, Kashimoto, Takahashi, Toyohara and Uchida2015; Ogihara & Kusumi, Reference Ogihara and Kusumi2020; Park et al., Reference Park, Kim and Park2016).
3. Results
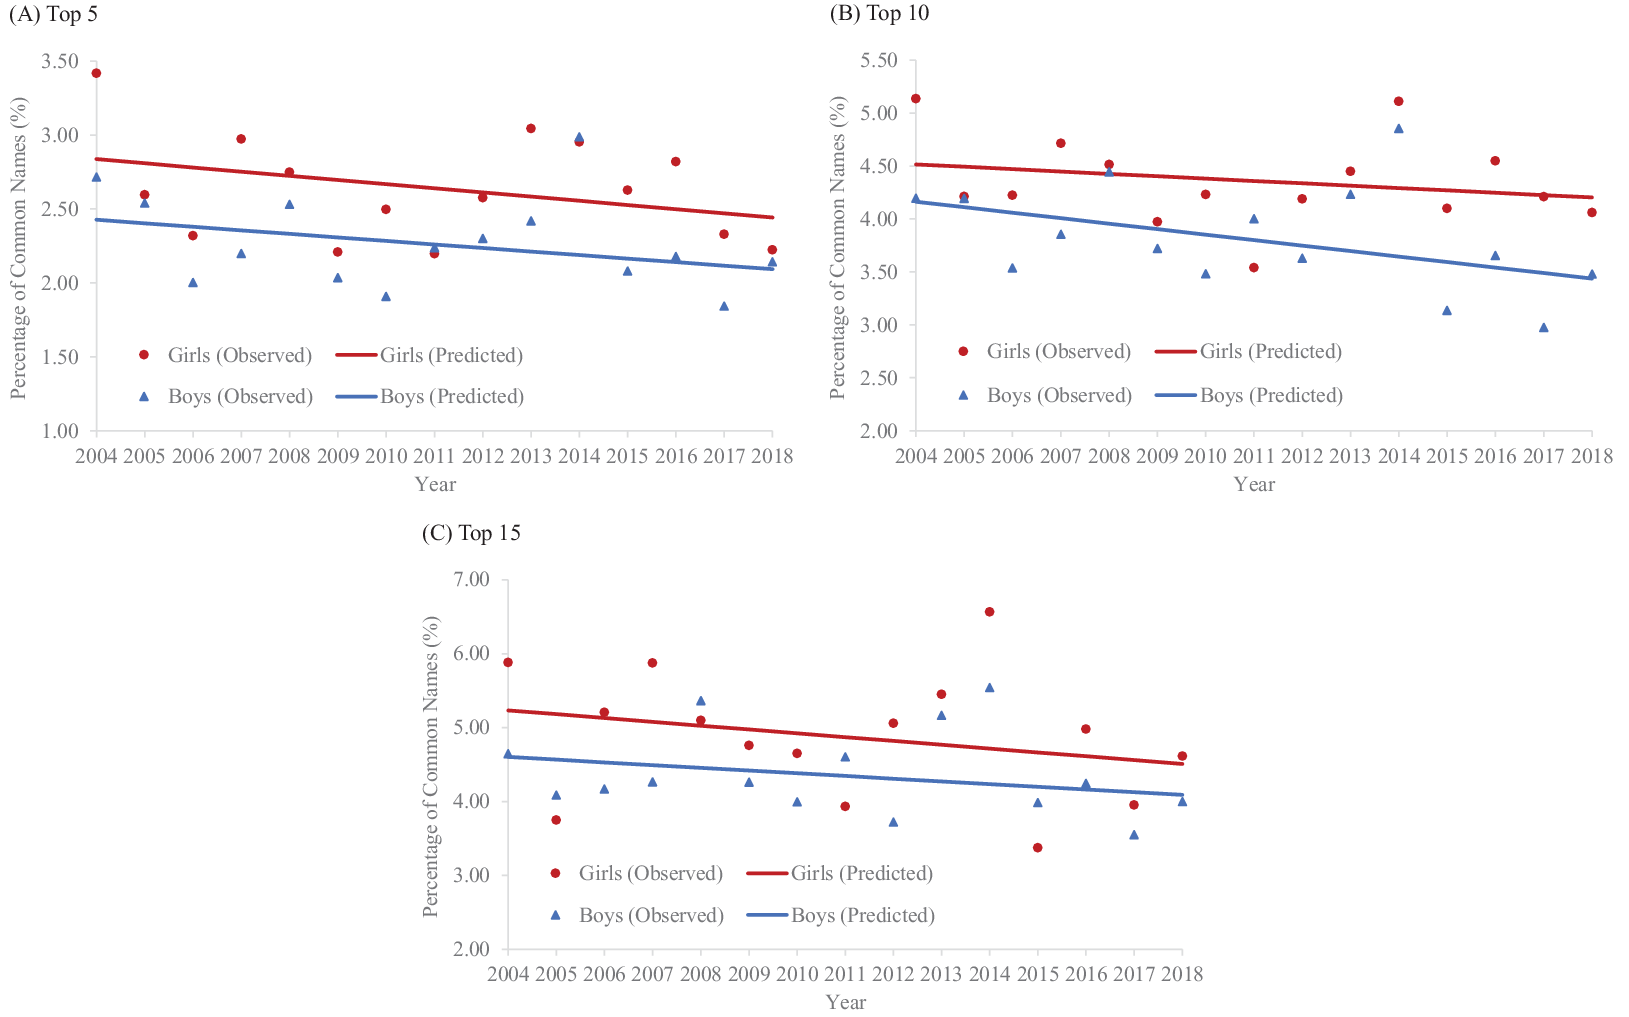
In all the analyses using the three different indicators (top 5, 10, and 15), the rates of common names decreased for both boys and girls between 2004 and 2018 (Table 2 and Figure 1).
Table 2. Historical changes in the percentages of common names


Figure 1. Percentages of common names, 2004–2018 (weighting sample sizes).
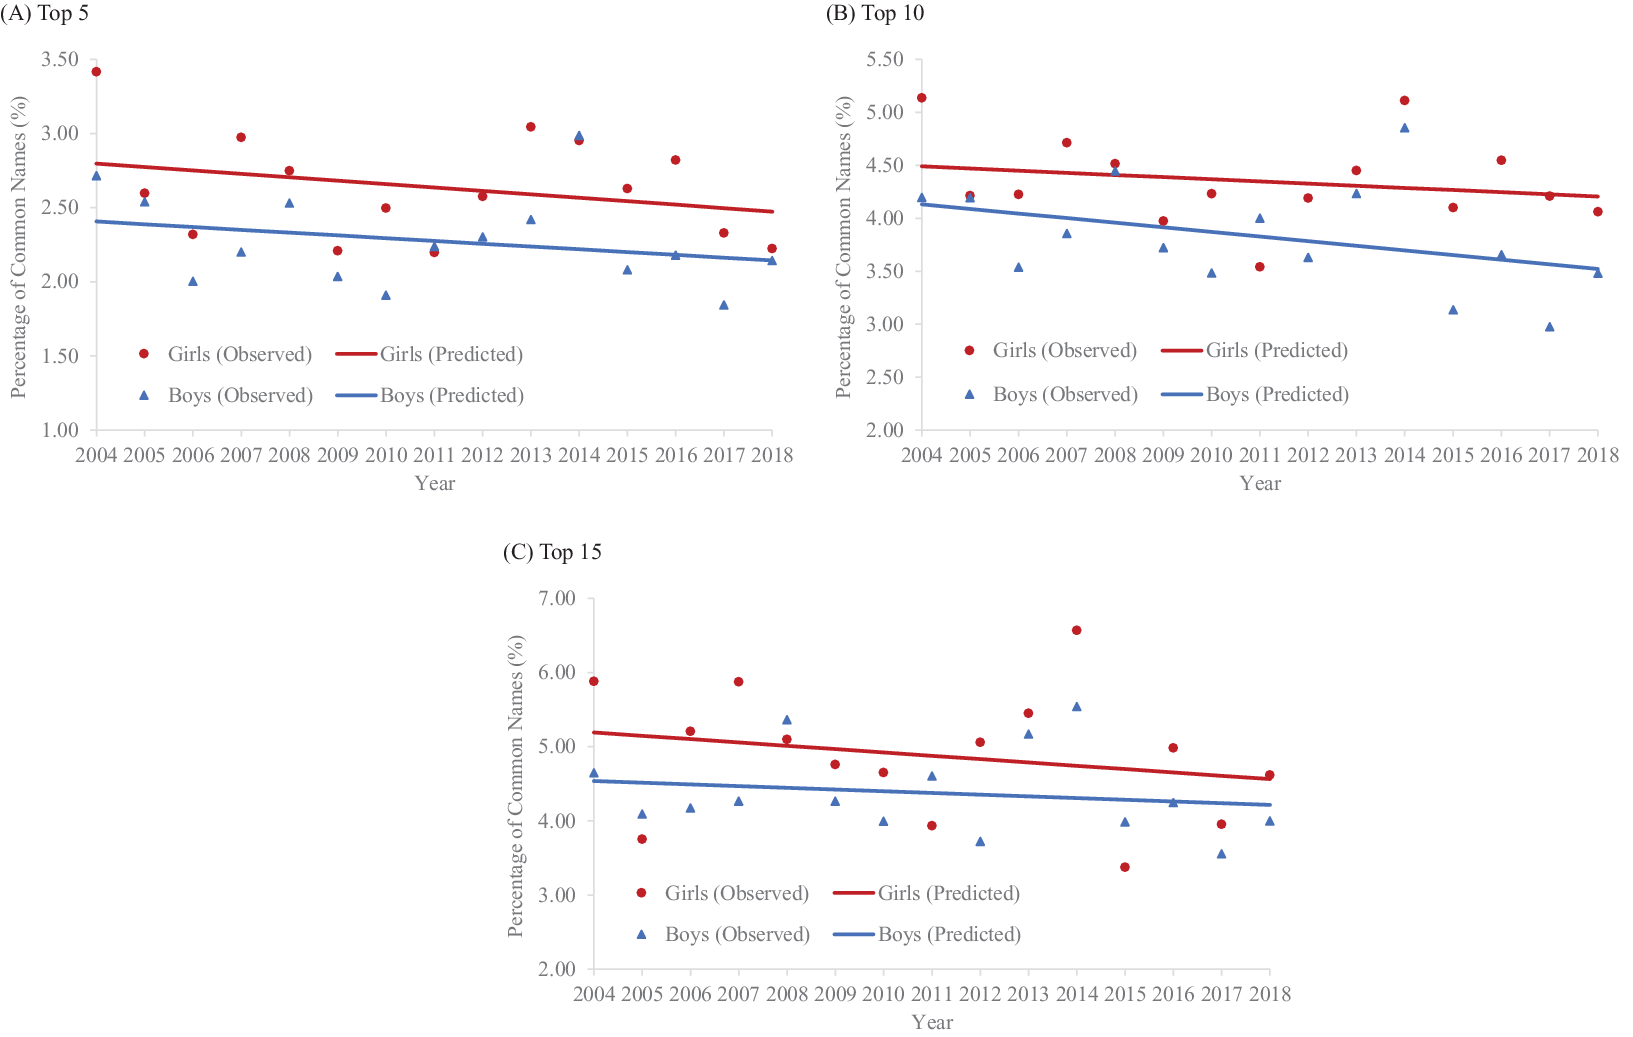
Moreover, these results were consistently found when the sample sizes were not weighted (Table 2 and Figure 2).

Figure 2. Percentages of common names, 2004–2018 (unweighting sample sizes).
4. Discussion
As predicted, the rates of common names decreased for both boys and girls between 2004 and 2018 in Japan, showing an increase in uniqueness-seeking and individualism. These results are consistent with previous research on names (Ogihara, Reference Ogihara2021a; Ogihara et al., Reference Ogihara, Fujita, Tominaga, Ishigaki, Kashimoto, Takahashi, Toyohara and Uchida2015), confirming that the prior findings are valid and robust. Furthermore, these results are also consistent with prior research on other aspects of Japanese culture (Hamamura, Reference Hamamura2012; Ogihara, Reference Ogihara2017b; Reference Ogihara2018b; Taras et al., Reference Taras, Steel and Kirkman2012; for reviews, see Ogihara, Reference Ogihara2017a; Reference Ogihara, Uskul and Oishi2018a). Therefore, this research contributes to the existing literature by providing further evidence of the rise in uniqueness-seeking and individualism in Japan.
The increase in unique names has also been suggested in other nations such as Germany (Gerhards & Hackenbroch, Reference Gerhards and Hackenbroch2000), the United States (Twenge et al., Reference Twenge, Abebe and Campbell2010; Reference Twenge, Dawson and Campbell2016), and China (Cai et al., Reference Cai, Zou, Feng, Liu and Jing2018; but also see Ogihara, Reference Ogihara2020d). Thus, this phenomenon may be found more broadly.
As a limitation, it is unclear why Japanese culture has become more individualistic. There are many factors which influence individualism such as economic affluence (e.g., Grossmann & Varnum, Reference Grossmann and Varnum2015), subsistence style (e.g., Talhelm, Reference Talhelm2020), relational mobility (e.g., Yuki & Schug, Reference Yuki and Schug2020), and residential mobility (e.g., Choi & Oishi, Reference Choi and Oishi2020). Future studies should examine the relationships between these possible factors and the historical changes in individualism in Japan.
Acknowledgment
None.
Authorship contribution
The author confirms being the sole contributor of this work and has approved it for publication.
Funding statement
This research received no specific grant from any funding agency, commercial, or not-for-profit sectors.
Conflict of interest
The author declares no competing interests.
Data availability statement
The datasets analyzed during the current study are available in the Open Science Framework: https://doi.org/10.17605/OSF.IO/2WURJ (for details, see Ogihara, Reference Ogihara2020a).


Comments
Comments to the Author: Doctor Ogihara Y wrote a manuscript about trend of frequency of common names of Japanese people, in relation to individualism. I would like to provide comments to improve the manuscript.
[Major]
1. Figures 1 and 2: Are the coefficients statistically significantly negative? In other words, are the declining trends statistically significant?
2. Methods: I wonder if the researcher disclose how he determined common names. Could it be described briefly?
3. Providing common names of both sexes would assist readers’ understanding.
4. Could the researcher show diversity index to explain that diversity of name has been increased.
5. Discussion could contain more context for publication. Could the researcher compare the results from those of the other study, please?
6. Discussion: Apart from the present results, why the researcher consider that Japanese people have become more individual? Could he provide another evidence for the consideration, please?
7. Why have Japanese people become individual? Is it external pressure, declining economy, collapse of the family system, natural course of development of the nation?
This study may reflect real Japanese appearance. However, I hit upon many questions in reading this manuscript. I believe that answering to my question would widen range of readers.