Overweight and obesity during childhood increase risk for a number of serious health conditions( Reference Bridger 1 – Reference Biro and Wien 5 ). Despite evidence that rates are plateauing, over 30 % of children remain overweight or obese in the USA and several other developed countries( Reference Olds, Maher and Zumin 6 ). To reverse this disturbing trend, Healthy People 2020 objectives include increasing the variety and contribution of fruit and vegetables and reducing the consumption of energy from solid fats and added sugars in the population aged 2 years and older( Reference Bergman and Gordon 7 ). Schools have been identified as a particularly relevant context for nutrition education due to opportunities to integrate nutritional information into existing curricula and the opportunity to reach a large number of children( 8 – Reference Waters, de Silva-Sanigorski and Hall 15 ). However, there is some question as to whether school-based nutrition education programmes can have meaningful impact on dietary patterns in children( Reference De Bourdeaudhuij, Van Cauwenberghe and Spittaels 16 , Reference Van Cauwenberghe, Maes and Spittaels 17 ). In fact, the Community Preventive Services Task Force found insufficient evidence to evaluate the effectiveness of school-based nutrition programmes in increasing fruit and vegetable intakes and decreasing fat and saturated fat intakes( 18 ).
A major limitation of school-based nutrition education programme evaluations is the emphasis on efficacy and effectiveness, with little attention paid to the overall public health impact, which takes into account the dissemination potential of the programme – the extent to which the programme can be delivered to a large number of people and sustained over time( Reference Abrams, Orleans and Niaura 19 , Reference Vogt, Hollis and Lichtenstein 20 ). While a nutrition education programme may be found to result in a statistically significant change in dietary intake behaviour, its ability to have a broad public health impact may be limited by: (i) the cost of the programme; (ii) difficulties experienced by teachers in implementing the lessons; and (iii) the number of children who are capable of being reached by the programme. Only a few studies have evaluated the dissemination or population-based impact of school-based nutrition education programmes to date( Reference Dunton, Lagloire and Robertson 21 , Reference Olson and Devine 22 ).
The RE-AIM model offers a useful framework for assessing the overall public health impact of prevention programmes( Reference Glasgow, Vogt and Boles 23 – Reference Glasgow, Klesges and Dzewaltowski 25 ). The model focuses on five evaluation dimensions: Reach (i.e. proportion of the target population that participated), Efficacy (i.e. success rate at changing desired outcomes), Adoption (i.e. proportion of target settings involved), Implementation (i.e. extent to which the programme was delivered as intended) and Maintenance (i.e. extent to which the programme outcomes (at the individual level) and programme availability (at the setting level) were sustained over time)( Reference Glasgow, Vogt and Boles 23 ). The current study used the RE-AIM framework to evaluate the public health impact of the ‘Shaping Up My Choices’ (SMC) programme, a school-based nutrition curriculum delivered to third-grade students across California. Developmental and formative evaluation testing of the SMC programme showed a positive impact on several psychosocial outcomes, including nutrition self-efficacy and knowledge, and a decrease in intakes of low-nutrient high-energy foods and meat. Building upon these preliminary findings, the current study assessed SMC programme according to all five RE-AIM dimensions (Reach, Efficacy, Adoption, Implementation, Maintenance) using a randomized controlled trial to evaluate the programme and secondary analysis of archival data to describe dissemination.
Experimental methods
Intervention
The SMC programme was developed by the Dairy Council of California to promote healthy eating behaviours and attitudes in schoolchildren (see http://www.healthyeating.org/SMC/). The nutrition education programme consists of ten nutrition lessons delivered by classroom teachers across 10 weeks (one lesson per week). Also included are a student activity workbook and family homework for selected lessons. A teacher's guide that contains lesson plans and instructions are provided. The curriculum was created using an integrated behaviour-change model, which encompasses elements of the Health Belief Model( Reference Rosenstock 26 ) and Social Cognitive Theory( Reference Bandura 27 ). Through interactive activities, simulations and reflections, the SMC lessons teach students about the five food groups, their main nutrients and roles in the body; the importance of eating a balanced breakfast and lunch; how to read a food label; how to estimate appropriate serving sizes; healthy beverage choices; and how to be physically active for 60 min each day. The curriculum aligns with the 2010 Dietary Guidelines for Americans( 28 ). The SMC materials are provided free of charge to California teachers by the Dairy Council of California and educators outside the state can purchase materials. During the spring of 2010, the SMC programme underwent formative testing in twenty-five classrooms using a one-group pre–post design. Results of this formative testing indicated a positive impact of the SMC programme on nutritional outcome expectancies (partial η 2 = 0·24), self-efficacy (partial η 2 = 0·03), knowledge (partial η 2 = 0·18–0·64) and dietary intake (partial η 2 = 0·01–0·05; GF Dunton, Y Liao, R Grana et al., unpublished results).
Design
During the 2010–2011 school year, the efficacy of the SMC programme was evaluated through a randomized controlled trial with pre-, post- and follow-up assessments of primary outcomes (i.e. nutrition knowledge, outcome expectancies, self-efficacy and dietary intake). Post-surveys were completed immediately after the conclusion of the programme (i.e. 10 weeks after the pre-survey). Follow-up surveys were complete 3 months after the conclusion of the programme. Implementation was assessed through teacher surveys and classroom observations in the intervention group of the randomized controlled trial. At the same time, the SMC programme was widely disseminated to third-grade public elementary school classrooms across the entire state of California. To assess programme reach, adoption and maintenance, we conducted a secondary analysis of data for programme orders, which was collected by the Dairy Council of California.
Sample
Two different samples were used in the present study: a programme evaluation sample and a dissemination sample. The programme evaluation sample for the randomized controlled trial was recruited from twenty-two public elementary schools across California. A convenience sample of schools was recruited from schools that had ordered Dairy Council of California nutrition materials in previous years and schools recommended by district-level contacts. Eight schools were located in northern California and fifteen schools in southern California. The racial/ethnic composition of those schools was as follows: 19 % Asian, 36 % Hispanic, 9 % African American, 23 % white/Caucasian, 13 % other. The schools participating in the randomized controlled trial were representative of the demographic and socio-economic composition of third-grade students attending public elementary schools in the state of California with the exception of a higher proportion of Asian students (19 % in sample v. 9 % state-wide), a lower proportion of Hispanic students (35 % in sample v. 51 % state-wide) and a higher proportion of English learner students (25 % in sample v. 10 % state-wide). Within each school, two third-grade classrooms were randomly selected to participate in the evaluation. Classroom teachers were recruited through emails and in-person and telephone contacts from the Dairy Council of California. To be eligible, teachers had to confirm that they (i) did not teach a combination-grade classroom and (ii) did not teach other nutrition information apart from SMC programme. Teachers received $US 200·00 each to compensate for their participation in the evaluation. The study was conducted according to the guidelines laid down in the Declaration of Helsinki and all procedures involving human subjects/patients were approved by Ethical and Independent Review Services, Corte Madera, CA, USA. Written informed assent was obtained from all minors. A passive parental consent procedure was used. If the parent did not decline consent, the minor was approached for consent.
The dissemination sample consisted of 7359 teachers who ordered the SMC materials and their 195 245 students who participated in the SMC programme during the 2010–2011 school year (for which records were maintained in the Dairy Council of California database).
Procedures and measures
Student survey
The student survey measured changes in dietary intake, outcome expectancies, self-efficacy and knowledge. The twenty-two-item dietary intake instrument was modified from the School Physical Activity and Nutrition Questionnaire (SPAN), which has been shown to be reliable and valid in fourth- and eighth-grade students( Reference Penkilo, George and Hoelscher 29 , Reference Thiagarajah, Fly and Hoelscher 30 ). Students reported the number of times they consumed various foods on the previous day. Response options included ‘none’, ‘1 time’, ‘2 times’ and ‘3 or more times’. A total dairy score was computed, which summed the daily intakes of any kind of cheese, cheese spread or cheese sauce (including cheese on pizza or in dishes such as tacos, enchiladas, lasagne, sandwiches, cheeseburgers or macaroni and cheese), cheese alone, milk, milk on cereal and yoghurt. The total low-nutrient high-energy food score summed the daily intakes of French fries, fruit punch, soda (regular or diet), frozen dessert, sweet rolls and candy. A nine-item outcome expectancy scale was designed to measure beliefs in the positive and negative consequences of consuming certain food groups, beverages and snack foods (e.g. ‘I think that I will build strong muscles if I eat more meat’). The items were developed in order to map onto specific content and information presented in the SMC lessons. A 4-point response scale was used (‘yes’, ‘maybe yes’, ‘maybe no’, ‘no’). The outcome expectancy scale had good 7d test–retest reliability (r = 0·75). A seven-item self-efficacy scale assessed students’ confidence in their ability to make healthy nutritional choices. Items also were linked to specific behaviours that were promoted in the SMC lessons (e.g. ‘Every day, I can eat breakfasts that have at least three types of foods’). A 4-point response scale was provided (‘I can’, ‘maybe I can,’ ‘maybe I can't’, ‘I can't’). The self-efficacy scale had acceptable 7d test–retest reliability (r = 0·57). A seventeen-item nutrition knowledge section measured students’ ability to correctly match foods with food groups, identify the major nutrient in foods, name the health benefits of nutrients, create balanced meals and make healthy snack choices. Demographic questions assessed students’ age and gender.
Teacher survey
Teachers participating in the intervention group of the randomized controlled trial completed the teacher programme implementation survey at the conclusion of the programme. Using ‘yes’ or ‘no’ response options, the teacher survey items assessed whether each of the ten lessons was taught, whether each of the ten lessons was added to or changed, and whether they used all of the family homework included in the student workbook. The survey also measured the extent to which lesson material was taught as intended (i.e. ‘How much of the material did you present as written in your teacher guide?’, with a 6-point response scale ranging from ‘none’ to ‘all’).
Classroom observations
SMC lessons for classrooms in the intervention group of the randomized controlled trial were observed by trained research staff during September–November 2010. Observers received formal training on the use of a classroom observation instrument, which included a sample teaching video to rate. The classroom observation instrument was based on items used to evaluate the Midwestern Prevention Project (MPP), a school-based drug abuse prevention programme( Reference Pentz, Trebow and Hansen 31 ). Using ‘yes’ or ‘no’ response options, observers rated whether the lessons were presented in the order suggested in the teacher guide and whether the teacher made changes, adaptations or additions to content or materials in the lesson. For each component of the lesson, raters indicated whether teachers were closely following the lesson plans using a 3-point response scale (‘agree’, ‘neither agree nor disagree’ or ‘disagree’). Observers also rated how accurately the information was presented using a 3-point response scale (‘completely’, ‘somewhat’ or ‘not at all’).
Data analyses
Pre-, post- and follow-up student survey data from the randomized controlled trial were analysed through multilevel modelling (SAS PROC Mixed) to evaluate the efficacy of the SMC programme in changing knowledge, attitudes and behaviour. Multilevel modelling takes into account the fact that data are clustered within classrooms and violate the statistical assumption of independence. The current paper presents results for change (i.e. difference scores) in key outcomes between the pre- and post-survey and between the pre- and the follow-up survey. Analyses tested the effects of group assignment (intervention v. control) in predicting changes in knowledge, outcome expectancies, self-efficacy and dietary intake. All analyses controlled for gender. Since the outcomes represent change scores, it was also necessary to control for pre-survey values. Missing data on any individual item were treated with list-wise deletion for that scale. Pre-survey differences between intervention and control groups were tested using the t test for two independent groups. The χ 2 test and the t test were used to compare students who missed the post-survey or follow-up survey with students who did not miss the post-survey or follow-up survey in terms of their study group, gender, age at the pre-survey, school and dietary intake. Post hoc analyses examined gender×group interactions for each outcome. Descriptive statistics (i.e. counts, means and proportions) were calculated to evaluate the implementation, reach, adoption and maintenance of the programme. All analyses were conducted using the statistical software package SAS version 9·2.
Results
Programme evaluation
Efficacy
Figure 1 shows the flow of classrooms and students through the recruitment, screening and assessment phases of the study. A total of 1147 students in twenty-three elementary schools across California completed the pre-survey (651 in the intervention group and 496 in the control group), 1019 students completed the post-survey (567 in the intervention group and 461 in the control group) and 979 students completed the follow-up survey (549 in the intervention group and 430 in the control group). The pre-, post- and follow-up survey samples differed in size due to absent children on each day and transfers to different schools. Pre- and post-survey data could be matched for 938 students (516 in the intervention group and 422 in the control group). Of these students, 48 % were male and the mean age was 7·96 (sd 0·45) years. Pre- and follow-up survey data could be matched for 809 students (446 in the intervention group and 363 in the control group). Approximately 47 % were male and 53 % were female, and the average age was 7·96 (sd 0·45) years. There were no significant differences in age and gender between the two groups with matched data.
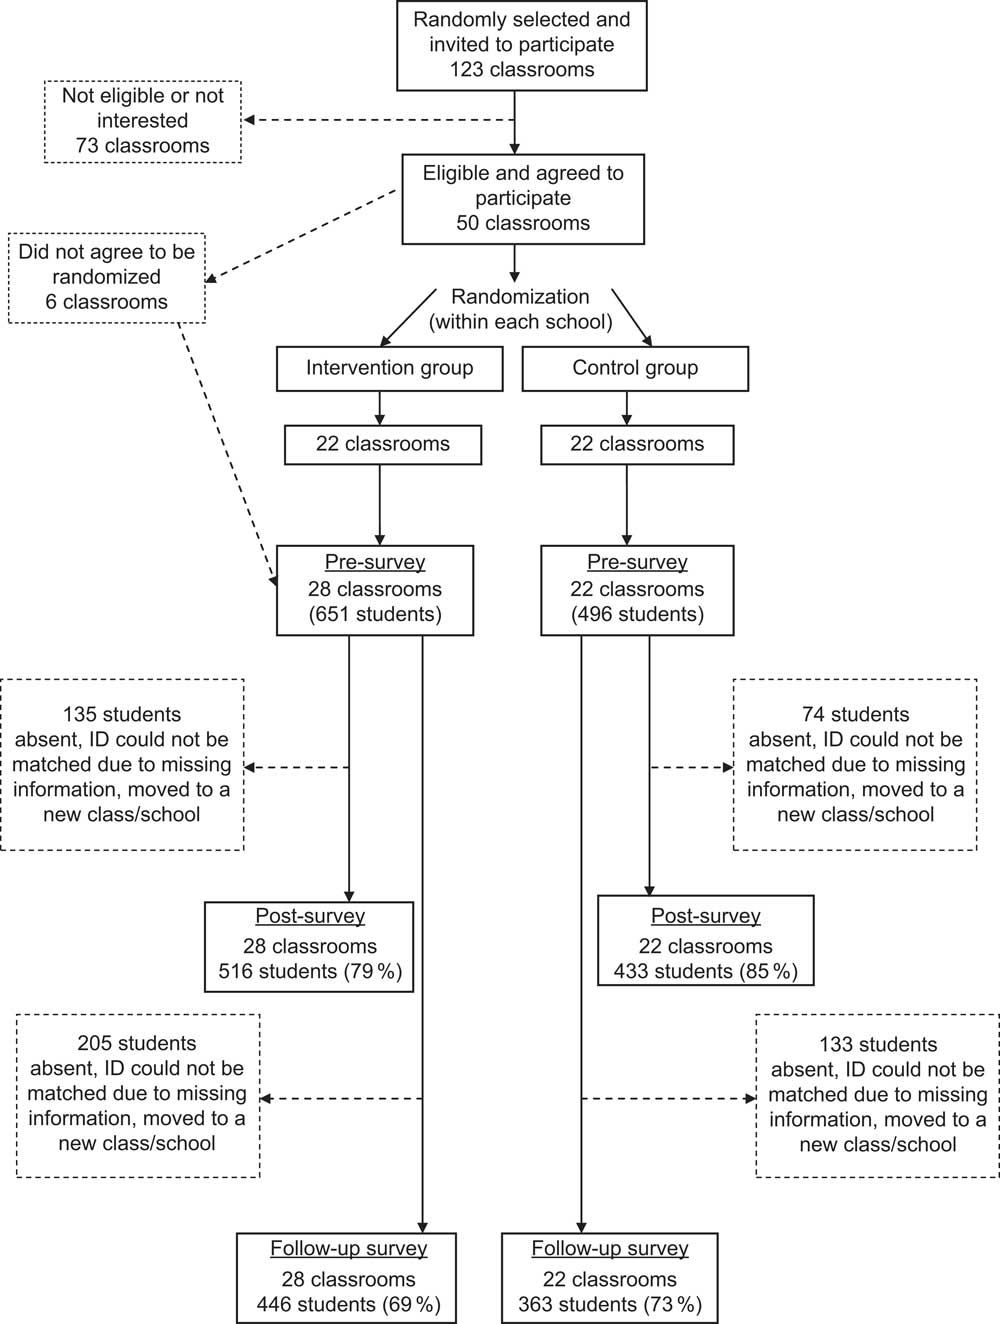
Fig. 1 Flow diagram of classrooms and students through the recruitment, screening and assessment phases of the evaluation study
Pre-survey scores on knowledge, self-efficacy, outcome expectancies and dietary intake were compared between the two groups to determine comparability. Results indicated that there were pre-survey group differences in knowledge about which foods belong to certain food groups (t(1) = 2·03, P < 0·05) and major nutrients in foods (t(1) = 2·10, P < 0·05), with scores on both scales being significantly higher for the intervention v. control group (data not shown). There were no significant group differences in self-efficacy, outcome expectancies or dietary intake in the pre-survey.
Students who remained in the study were compared with students who were missing post- or follow-up survey data. Compared with students who did not miss the post-survey, students who missed the post-survey reported greater consumption of vegetables, fruits, soda and low-nutrient high-energy food on the pre-survey. Also, compared with students who did not miss the follow-up survey, students who missed the follow-up survey were older and consumed more vegetables, juice, soda and low-nutrient high-energy food on the pre-survey. Attrition did not differ by study group or school.
Table 1 shows the pre- to post-survey difference scores by group for the knowledge, self-efficacy, outcome expectancies and dietary intake scales. Students’ knowledge pertaining to correctly matching foods with food groups, identifying the major nutrient in foods, naming the health benefits of nutrients, creating balanced meals and making healthy snack choices significantly improved to a greater extent in the intervention v. control group between the pre- and post-survey (all P < 0·01). Results also indicated that outcome expectancies and self-efficacy significantly improved to a greater extent in the intervention v. control group between the pre- and post-survey (all P < 0·01). There was a marginally significant group difference in the change in vegetable intake from the pre- to post-survey (P < 0·10), indicating that the control group decreased consumption of vegetables whereas the intervention group did not change intake of this food item. A marginally significant difference was also found for change in soda consumption (P < 0·10) with the intervention group decreasing soda consumption to a greater degree than the control group. A statistically significant group difference was also found for consumption of total low-nutrient high-energy food (P < 0·01). The intervention group decreased intake of low-nutrient high-energy food whereas the control group increased intake of this food. Post hoc analyses revealed statistically significant gender×group interactions for changes in fruit (b = −0·421, P < 0·01), soda (b = −0·240, P < 0·05) and low-nutrient high-energy food (b = 1·020, P < 0·05) intake between the pre- and post-survey. The intervention group increased its intake of fruit whereas the control group decreased intake of this food, but this effect occurred only for girls (see Fig. 2). Also, the differential decreases in low-nutrient high-energy food and soda consumption for the intervention v. control group were greater for boys than girls (see Figs 3 and 4).
Table 1 Pre- to post-survey changes in nutrition knowledge, outcome expectancies, self-efficacy and dietary intake: differences by study group. Evaluation of the ‘Shaping Up My Choices’ programme among third-grade children (n 777–929), California, USA, 2010–2011 school year
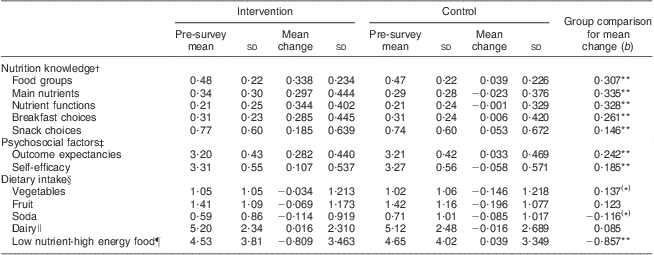
Note: All models controlled for gender and pre-survey values. The time between the pre- and post-surveys was 10 weeks.
(*) P < 0·10, *P < 0·05, **P < 0·01.
†Values represent percentage of correct answers.
‡Values are based on a 4-point scale: 1 = ‘no’, 2 = ‘maybe no’, 3 = ‘maybe yes’, 4 = ‘yes’.
§Values represent average daily food intake frequency for each type of food.
∥Dairy includes any kind of cheese, cheese spread or cheese sauce (including cheese on pizza or in dishes such as tacos, enchiladas, lasagne, sandwiches, cheeseburgers or macaroni and cheese), cheese alone, milk, milk on cereal and yoghurt.
¶Low-nutrient high-energy foods include French fries, fruit punch, soda (regular or diet), frozen dessert, sweet rolls and candy.
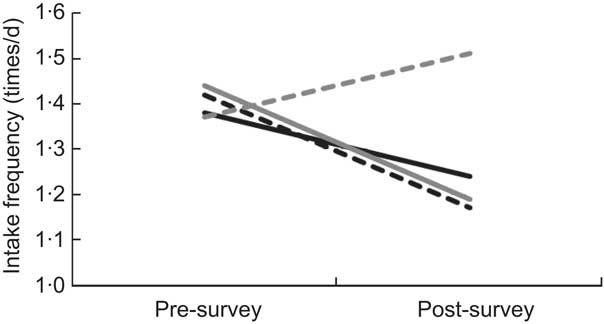
Fig. 2 Average daily intakes of fruit reported at pre- and post-survey by study group and gender (![]() , intervention boys;
, intervention boys; ![]() , intervention girls;
, intervention girls; ![]() , control boys;
, control boys; ![]() , control girls); values indicate food intake frequency per day. Evaluation of the ‘Shaping Up My Choices’ programme among third-grade children, California, USA, 2010–2011 school year
, control girls); values indicate food intake frequency per day. Evaluation of the ‘Shaping Up My Choices’ programme among third-grade children, California, USA, 2010–2011 school year
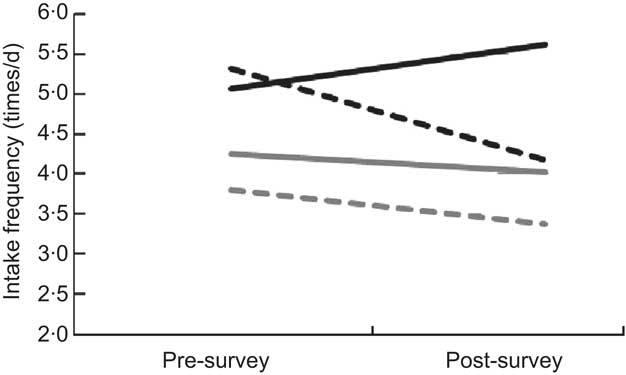
Fig. 3 Average daily intakes of low-nutrient high-energy foods reported at pre- and post-survey by study group and gender (![]() , intervention boys;
, intervention boys; ![]() , intervention girls;
, intervention girls; ![]() , control boys;
, control boys; ![]() , control girls); values indicate food intake frequency per day. Low-nutrient high-energy foods include French fries, fruit punch, soda (regular or diet), frozen dessert, sweet rolls and candy. Evaluation of the ‘Shaping Up My Choices’ programme among third-grade children, California, USA, 2010–2011 school year
, control girls); values indicate food intake frequency per day. Low-nutrient high-energy foods include French fries, fruit punch, soda (regular or diet), frozen dessert, sweet rolls and candy. Evaluation of the ‘Shaping Up My Choices’ programme among third-grade children, California, USA, 2010–2011 school year
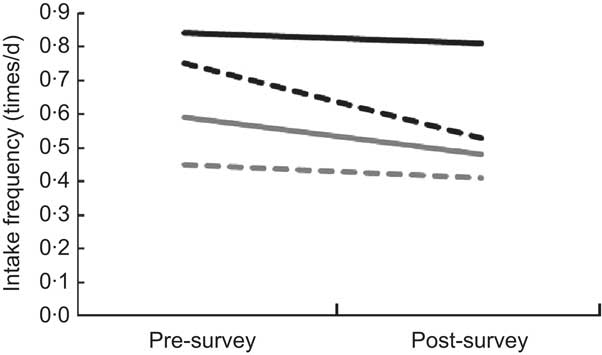
Fig. 4 Average daily intakes of soda (regular or diet) reported at pre- and post-survey by study group and gender (![]() , intervention boys;
, intervention boys; ![]() , intervention girls;
, intervention girls; ![]() , control boys;
, control boys; ![]() , control girls); values indicate food intake frequency per day. Evaluation of the ‘Shaping Up My Choices’ programme among third-grade children, California, USA, 2010–2011 school year
, control girls); values indicate food intake frequency per day. Evaluation of the ‘Shaping Up My Choices’ programme among third-grade children, California, USA, 2010–2011 school year
Pre-survey to follow-up survey difference scores are shown in Table 2. Results showed that there were significant group differences in the change scores for knowledge pertaining to correctly matching foods with food groups, identifying the major nutrient in foods, naming the health benefits of nutrients, creating balanced meals and making healthy snack choices (all P < 0·01). Although scores on these nutrition knowledge items decreased slightly between the post- and follow-up surveys, the overall group differences were sustained. Results also indicated significant group differences in the change score for outcome expectancies between the pre-survey and follow-up (P < 0·01). However, the group difference for change in self-efficacy between the pre- and post-survey was not statistically significant. A marginally significant group difference was observed for change in vegetable consumption (P < 0·10), indicating that the intervention group decreased consumption of vegetables between the pre-survey and follow-up survey to a lesser extent than the control group. Group differences in change in soda and total low-nutrient high-energy food intake were not sustained through the follow-up. There were no significant gender×group interactions for changes in outcomes between the pre- and follow-up survey.
Table 2 Pre- to follow-up survey changes in nutrition knowledge, outcome expectancies, self-efficacy and dietary intake: differences by study group. Evaluation of the ‘Shaping Up My Choices’ programme among third-grade children (n 727–805), California, USA, 2010–2011 school year
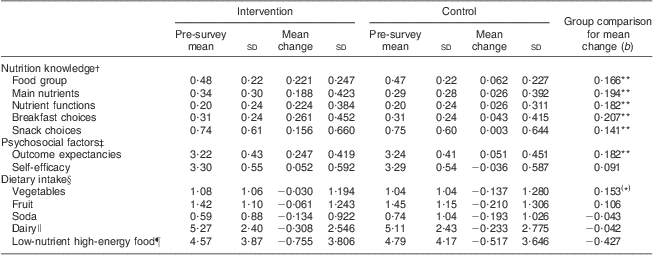
Note: All models controlled for gender and pre-survey values. The time between the pre- and follow-up surveys was ∼5–6 months.
(*) P < 0·10, *P < 0·05, **P < 0·01.
†Values represent percentage of correct answers.
‡Values are based on a 4-point scale: 1 = ‘no’, 2 = ‘maybe no’, 3 = ‘maybe yes’, 4 = ‘yes’.
§Values represent average daily food intake frequency for each type of food.
∥Dairy includes any kind of cheese, cheese spread or cheese sauce (including cheese on pizza or in dishes such as tacos, enchiladas, lasagne, sandwiches, cheeseburgers or macaroni and cheese), cheese alone, milk, milk on cereal and yoghurt.
¶Low-nutrient high-energy foods include French fries, fruit punch, soda (regular or diet), frozen dessert, sweet rolls, and candy.
Implementation
Nineteen of twenty-eight teachers participating in the intervention group completed the teacher survey at the conclusion of the programme. On the teacher survey, 100 % of the teachers reported implementing all ten of the SMC lessons. Approximately 39 % of teachers taught all of the material as written in the teacher guide, and the remainder of the teachers taught more than half the material as written in the teacher guide. Twenty-two per cent of teachers reported that they did not do anything to change the lessons. Seventy-two per cent of teachers assigned the family homework activities.
A total of seventeen observers completed 101 observations across twenty-four of the twenty-eight intervention classrooms. Four lessons were observed in each classroom. Thirteen of these observations were paired (i.e. observed the same lesson simultaneously but completed the observation instrument separately) to calculate inter-rater agreement. The agreement between raters was over 70 % for all items on the observation instrument. In 83 % of the observations, the lessons were presented in the order suggested in the teacher guide. In 37 % of observations, the teacher made changes, adaptations or additions to content/materials in the lesson. In over 70 % of the observations, raters indicated that teachers were closely following the lesson plans. Teachers presented information rated as completely accurate in 75 % of the observations.
Dissemination
Reach
Combined, the programme reached 195 245 third-grade students attending public schools in California during the 2010–2011 school year, which represents about 42 % of third-grade students attending public elementary schools in California during that year (461 974 total students)( 32 ).
Adoption
A total of 7359 third-grade classrooms in California ordered the programme in 2010–2011, which represented ∼39 % of the ∼19 000 third-grade classrooms across all public elementary schools in California that year( 33 ). The total number of orders was comprised of 3164 requests (43 % of total requests) made by teachers who had not previously used any other Dairy Council of California nutrition education materials.
Maintenance
On the teacher survey, 79 % of teachers in the intervention group of the evaluation indicated that they planned to use the SMC curriculum during the next school year. Programme usage reports showed that 37 % of all teachers using the SMC curriculum in 2010–2011 reordered SMC materials during the next school year (2011–2012).
Discussion
The current study used the RE-AIM framework to assess the public health impact and dissemination potential of the SMC programme, a teacher-delivered nutrition education programme for third-grade students in California. A randomized controlled evaluation study in fifty representative classrooms utilizing pre-, post- and 3-month follow-up assessments found that the SMC programme increased nutrition knowledge, outcome expectancies, self-efficacy, the intake of vegetables and the intake of fruit (for girls only); and decreased the intakes of soda and low-nutrient high-energy food (with greater decreases observed for boys). Also, the teachers in the intervention group of the evaluation study implemented all ten of the SMC lessons. Dissemination data suggested that the programme reached over 40 % of third-grade students attending public elementary schools in California during the 2010–2011 school year. When evaluating the adoption of the SMC programme across potential settings, almost half of all third-grade teachers in public elementary schools in California ordered the programme materials. Preliminary evidence for the maintenance of the programme is provided by the substantial percentage of teachers having reordered the SMC programme materials during the following school year. Given the broad reach of this programme, its moderate level of efficacy, the moderate degree to which it was adopted in schools across California, the ease with which teachers are able to implement it, the interest maintaining the programme over time and the relatively low cost per student ($US 2·25 total, which comprised $US 1·39 in direct costs and $US 0·86 in organization overheads), the SMC programme has the potential for a moderate to high public health impact among California third-grade students.
Prior to the present study, few school-based health education programmes had been evaluated in terms of their overall public health or population-based impact across all five RE-AIM dimensions. In fact, a review of the reporting validity of school-based health promotion programmes in nutrition, physical activity or smoking cessation/prevention found that of studies published between 1996 and 2000, 59 % reported reach, 100 % reported efficacy, 15 % reported adoption, 37 % reported implementation and 0 % reported maintenance at the setting level( Reference Estabrooks, Dzewaltowski and Glasgow 34 ). Results on the public health impact of nutrition education programmes, in particular, are even more uncommon. A recent study investigated the dissemination and implementation of a nutrition teaching programme ‘Nutrition For Life’ in secondary schools in New York State. The reach and adoption rates were similar to the current study, with 50 % of junior high school and 33 % of senior high school teachers indicating that they received the programme and three-quarters of these teachers reporting that they taught the lessons( Reference Olson and Devine 22 ). However, that study did not report on efficacy and maintenance of the programme. The current study also builds on the literature in this area by providing evidence of the population-based impact of a nutrition education programme designed specifically for lower elementary students, whereas the other available studies in this area focused on older students.
Limitations
Limitations included the use of a child-reported food frequency instrument to measure dietary intake. Although the instrument had been shown to be reliable and valid in children as young as fourth grade( Reference Bandura 27 ), it is possible that not all third graders have the reading comprehension level required to complete the instrument. The self-report nature of the dietary intake instrument may also make it vulnerable to reporting errors and biases( Reference Collins, Watson and Burrows 35 , Reference Livingstone, Robson and Wallace 36 ). The instrument assessed only 1 d of dietary intake, which may not be representative of the child's typical intake patterns( Reference Dodd, Guenther and Freedman 37 ). Another limitation was the 32 % of evaluation teachers delivering the intervention who did not return the teacher survey. Other weaknesses included pre-survey differences in nutrition knowledge and greater attrition among students with a greater intake of some healthy and unhealthy foods reported on the pre-survey. Another limitation was the modest level of success that the programme demonstrated in maintaining the behaviour change effects on the follow-up survey, which was conducted 3 months after the conclusion of the programme. Changes in the SMC curriculum are currently underway to boost long-term maintenance, including family homework targeting changes in the home food environment and extension activities to provide teachers the opportunity to reinforce concepts throughout the year. A final limitation was the inability to examine long-term maintenance of the programme at the setting level because the SMC was new in 2009.
Conclusions
Assessing the SMC programme across the five dimensions of the RE-AIM model suggested that it has potential for moderate to high public health impact. Reach and adoption are areas that could be further improved with school-based nutrition programmes such as this one. Restraints in the amount of classroom time allotted to nutrition education and the increasing focus on preparation for standardized testing are barriers to overcome. The RE-AIM framework is intended to improve the efficiency and speed of efforts to translate research into practice. Therefore, future research should seek to apply the RE-AIM assessment framework across a wider range of school-based nutrition programmes and populations.
Acknowledgements
Sources of funding: This work was supported by the Dairy Council of California and the National Institutes of Health (grant number R01 DA027226). Conflicts of interest: The nutrition education programme was developed by the Dairy Council of California, who funded the study evaluation. Authors’ contribution: G.F.D. produced the first draft of the manuscript; Y.L. and R.G. conducted data analyses and provided feedback on all drafts of the manuscript; N.R., R.L., C.-P.C. and T.R. provided feedback on all drafts of the manuscript and contributed to the ideas presented. Acknowledgements: The authors thank Crystal Coker for assistance with data collection.


