Maternal anthropometry is positively related to fetal growth and weight at birth. Birth weight itself is associated with the risk of developing diabetes and CVD in adulthood(Reference Whincup, Kaye and Owen1, Reference Huxley, Owen and Whincup2). Birth weight and anthropometry are markers for altered organ structure and function, and these structural and functional set points and capacities may underlie the increased susceptibility to disease(Reference McMillen and Robinson3, Reference Gluckman, Hanson and Cooper4). Reduced infant growth and rapid weight gain through childhood are further independent risk factors for diabetes and CVD(Reference Barker, Osmond and Forsen5, Reference Bhargava, Sachdev and Fall6).
CVD patterns and rates vary widely among ethnic groups, in part due to exposure to classical risk factors, but also to susceptibility to these risk factors(Reference Cappuccio7–Reference Misra and Vikram9). An example is the difference in the BMI associated with minimum risk of diabetes and CVD in different populations(Reference Misra and Vikram9, Reference Alberti, Zimmet and Shaw10). Very little information on markers and mechanisms of underlying susceptibility is available for African-origin populations. The ‘Vulnerable Windows Cohort Study’ was established in the Tropical Metabolism Research Unit, University of the West Indies in 1993 as an observational study to describe such susceptibility to cardiovascular risk in black Jamaicans(Reference Thame, Osmond and Wilks11).
We hypothesised that small maternal size, small birth size and increased growth rates during early childhood are associated with increased cardiovascular risk in later childhood. Thus, in this cohort of Jamaican children aged 12 years, we describe the maternal, placental, fetal, birth, infant and childhood determinants of cardiovascular risk, specifically waist circumference, blood glucose, serum insulin, serum lipids and blood pressure.
Experimental methods
Study design and subjects
As previously described(Reference Thame, Osmond and Wilks11), in 1992–3, 712 women attending the antenatal clinic at the University Hospital of the West Indies, Kingston, Jamaica, were invited to participate in the Vulnerable Windows Cohort Study. Women who were aged between 15 and 40 years, were 7–10 weeks pregnant, sure of their last menstrual period (which was confirmed by a 14-week ultrasound), and without systemic illnesses (for example, pre-eclampsia and diabetes), or genetic abnormality (for example, sickle cell disease) were included. After eighty-two pregnancy losses, fifty-six withdrawals for reasons such as work constraints and migration, and five sets of twins were excluded, 569 babies were included in the study. All women were offered transport to and from the hospital to enhance participation. For the present report, data analysis was confined to 296 women and their offspring who were seen within 2 years of every scheduled visit between birth and age 12 years. Each mother gave written informed consent. The present study was conducted according to the guidelines laid down in the Declaration of Helsinki and all procedures involving human subjects were approved by the Ethics Committee of the University of the West Indies.
Measurements
Weight was measured to the nearest 0·01 kg using a Weylux beam balance (CMS Weighing Equipment Ltd, London, UK). Height was measured to the nearest 0·1 cm with a stadiometer (CMS Weighing Equipment Ltd)(Reference Thame, Osmond and Wilks11).
Abdominal ultrasound was performed at 14, 17, 20, 25, 30 and 35 weeks of gestation using a linear probe (ATL Ultramark IV; Philips Medical Systems North America, Bothell, WA, USA). Fetal measurements including abdominal circumference were estimated sonographically at all visits. The average of three measurements was used. Placental volume was measured sonographically at 14, 17 and 20 weeks(Reference Howe, Wheeler and Perring12).
Anthropometric measurements of the infant were obtained within 24 h of delivery. We measured birth weight with a Health o Meter® 459 scale (Pelstar LLC, Bridgeview, IL, USA), placental weight with an electronic balance (Digimail 800100; Soehnle, Murrhardt, Germany), crown–heel length with a length board (Holtain Ltd, Crymych, Dyfed, UK) and head circumference with a fibreglass tape. We measured offspring anthropometry at birth, at 6 weeks, every 3 months to 2 years and then every 6 months. BMI was calculated by dividing body mass (kg) by the square of height (m2). Blood pressure was measured every 6 months from the age of 1 year using an oscillometric sphygmomanometer(Reference Thame, Osmond and Wilks11). Inter- and intra-observer variability was measured every 3 months, followed by training and recertification for any observer whose scores were not acceptable. Staging of the pubic hair and breast development was done according to the method of Marshall & Tanner(Reference Marshall and Tanner13, Reference Marshall and Tanner14). Testicular volume was measured with a Prader orchidometer with volumes ranging from 1 to 25 ml. At clinic at age 11·5 (sd 1·3) years we sampled fasting blood using EMLA® cream as a local anaesthetic. At that time, total body water was estimated by bioelectrical impedance analysis using a single frequency (50 kHz model 101Q; RJC Systems, Clinton Township, MI, USA) with the subjects wearing light clothing. The analysers were calibrated using a 500 Ω resistor before all measurements. Fat-free mass was determined using the manufacturer's equations and fat mass by difference from body weight.
Assays
Plasma glucose was measured by the glucose oxidase system. Total cholesterol, HDL-cholesterol and TAG were measured by enzymic techniques using a VP biochromatic analyser (Abbott, Irving, TX, USA). Plasma insulin was measured with an immunometric assay (Immulite Insulin; Diagnostic Products Corporation, Los Angeles, CA, USA). The assay had an analytical sensitivity of 2 μIU/ml and the intra-assay CV was < 8·0 %. The homeostasis model assessment of insulin resistance (HOMA-IR) score was calculated as the product of insulin and glucose divided by 22·6(Reference Matthews, Hosker and Rudenski15).
Statistical analysis
Insulin, HOMA-IR and TAG had skewed distributions and were log transformed towards normality for analysis. Growth was measured in three time intervals: birth to 6 months; 6 months to 2 years; and 2 years to age 11 years. It was defined as the amount by which the size at the end of a time interval exceeded that which would have been predicted by linear regression using the measurements available at the beginning of the interval(Reference Kajantie, Barker and Osmond16). This approach ensures that the growth indices are uncorrelated. Multiple regression analyses including age and sex were used to measure the associations of cardiovascular risk factors with maternal factors, placental, fetal and neonatal size, and infant and childhood growth. We used outcomes and predictors in standardised form (i.e. for a standardised score, a value of 0 corresponds to the mean and a value of 1 corresponds to 1 sd above the mean and so on). To test for similarity of effects between boys and girls we used product terms of sex with anthropometric variables. We always adjusted risk factors for age at the clinic visit. P < 0·05 was considered statistically significant. SPSS 15.0 for Windows (SPSS, Inc., Chicago, IL, USA) was used for the statistical analyses.
Results
The 296 subjects studied were similar to the other members of the cohort in maternal age, height, weight, BMI and socio-economic status. They were not different in birth length, head circumference or placental weight, but were 129 g heavier in weight (P = 0·004) and 3·2 d older in gestational age at birth (P = 0·006).
Mean values for maternal, placental, fetal, newborn and postnatal measurements and anthropometric and biochemical measurements are shown in Table 1. As expected, males tended to be larger until age 11 years, at which stage more girls had started their pubertal growth spurt and had a higher BMI, fat mass and percentage body fat. Including measurements made subsequent to venepuncture, the median age at reaching Tanner stage 3 for pubic hair development was 11·1 years in girls and 12·8 years in boys.
Table 1 Maternal, placental, fetal, neonatal, infant and childhood measurements
(Mean values and standard deviations)

HOMA-IR, homeostasis model assessment of insulin resistance.
* Values for fasting insulin, HOMA-IR and TAG are geometric mean and standard deviation.
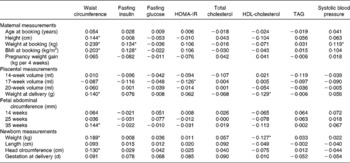
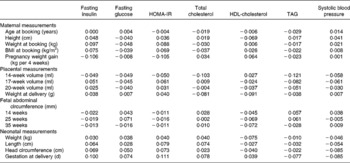
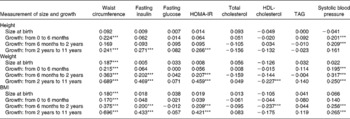
Tables 2 and 3 show the associations of the eight outcomes measured with maternal, placental, fetal and newborn size. Table 4 extends this to include infant and childhood growth. We describe the outcomes in sequence.
Table 2 Regression coefficients between maternal, placental, fetal and neonatal measurements of 296 Afro-Jamaican children and their measurements made at clinic†

HOMA-IR, homeostasis model assessment of insulin resistance.
* P < 0·05.
† Analyses are adjusted for sex and age at clinic visit. All measurements are in standardised form, i.e. for a standardised score, a value of 0 corresponds to the mean and a value of 1 corresponds to 1 sd above the mean and so on.
Table 3 Regression coefficients of maternal, placental, fetal and neonatal measurements of 296 Afro-Jamaican children and their measurements made at clinic*

HOMA-IR, homeostasis model assessment of insulin resistance.
* Analyses are adjusted for sex, age at clinic visit and subject's waist circumference. All measurements are in standardised form, i.e. for a standardised score, a value of 0 corresponds to the mean and a value of 1 corresponds to 1 sd above the mean and so on. No coefficient corresponded to a P value < 0·05.
Table 4 Regression coefficients of size at birth and childhood growth of 296 Afro-Jamaican children and their measurements made at clinic†

HOMA-IR, homeostasis model assessment of insulin resistance.
*** P < 0·001.
† Analyses are adjusted for sex and age at clinic visit. All measurements are in standardised form, i.e. for a standardised score, a value of 0 corresponds to the mean and a value of 1 corresponds to 1 sd above the mean and so on.
Waist circumference
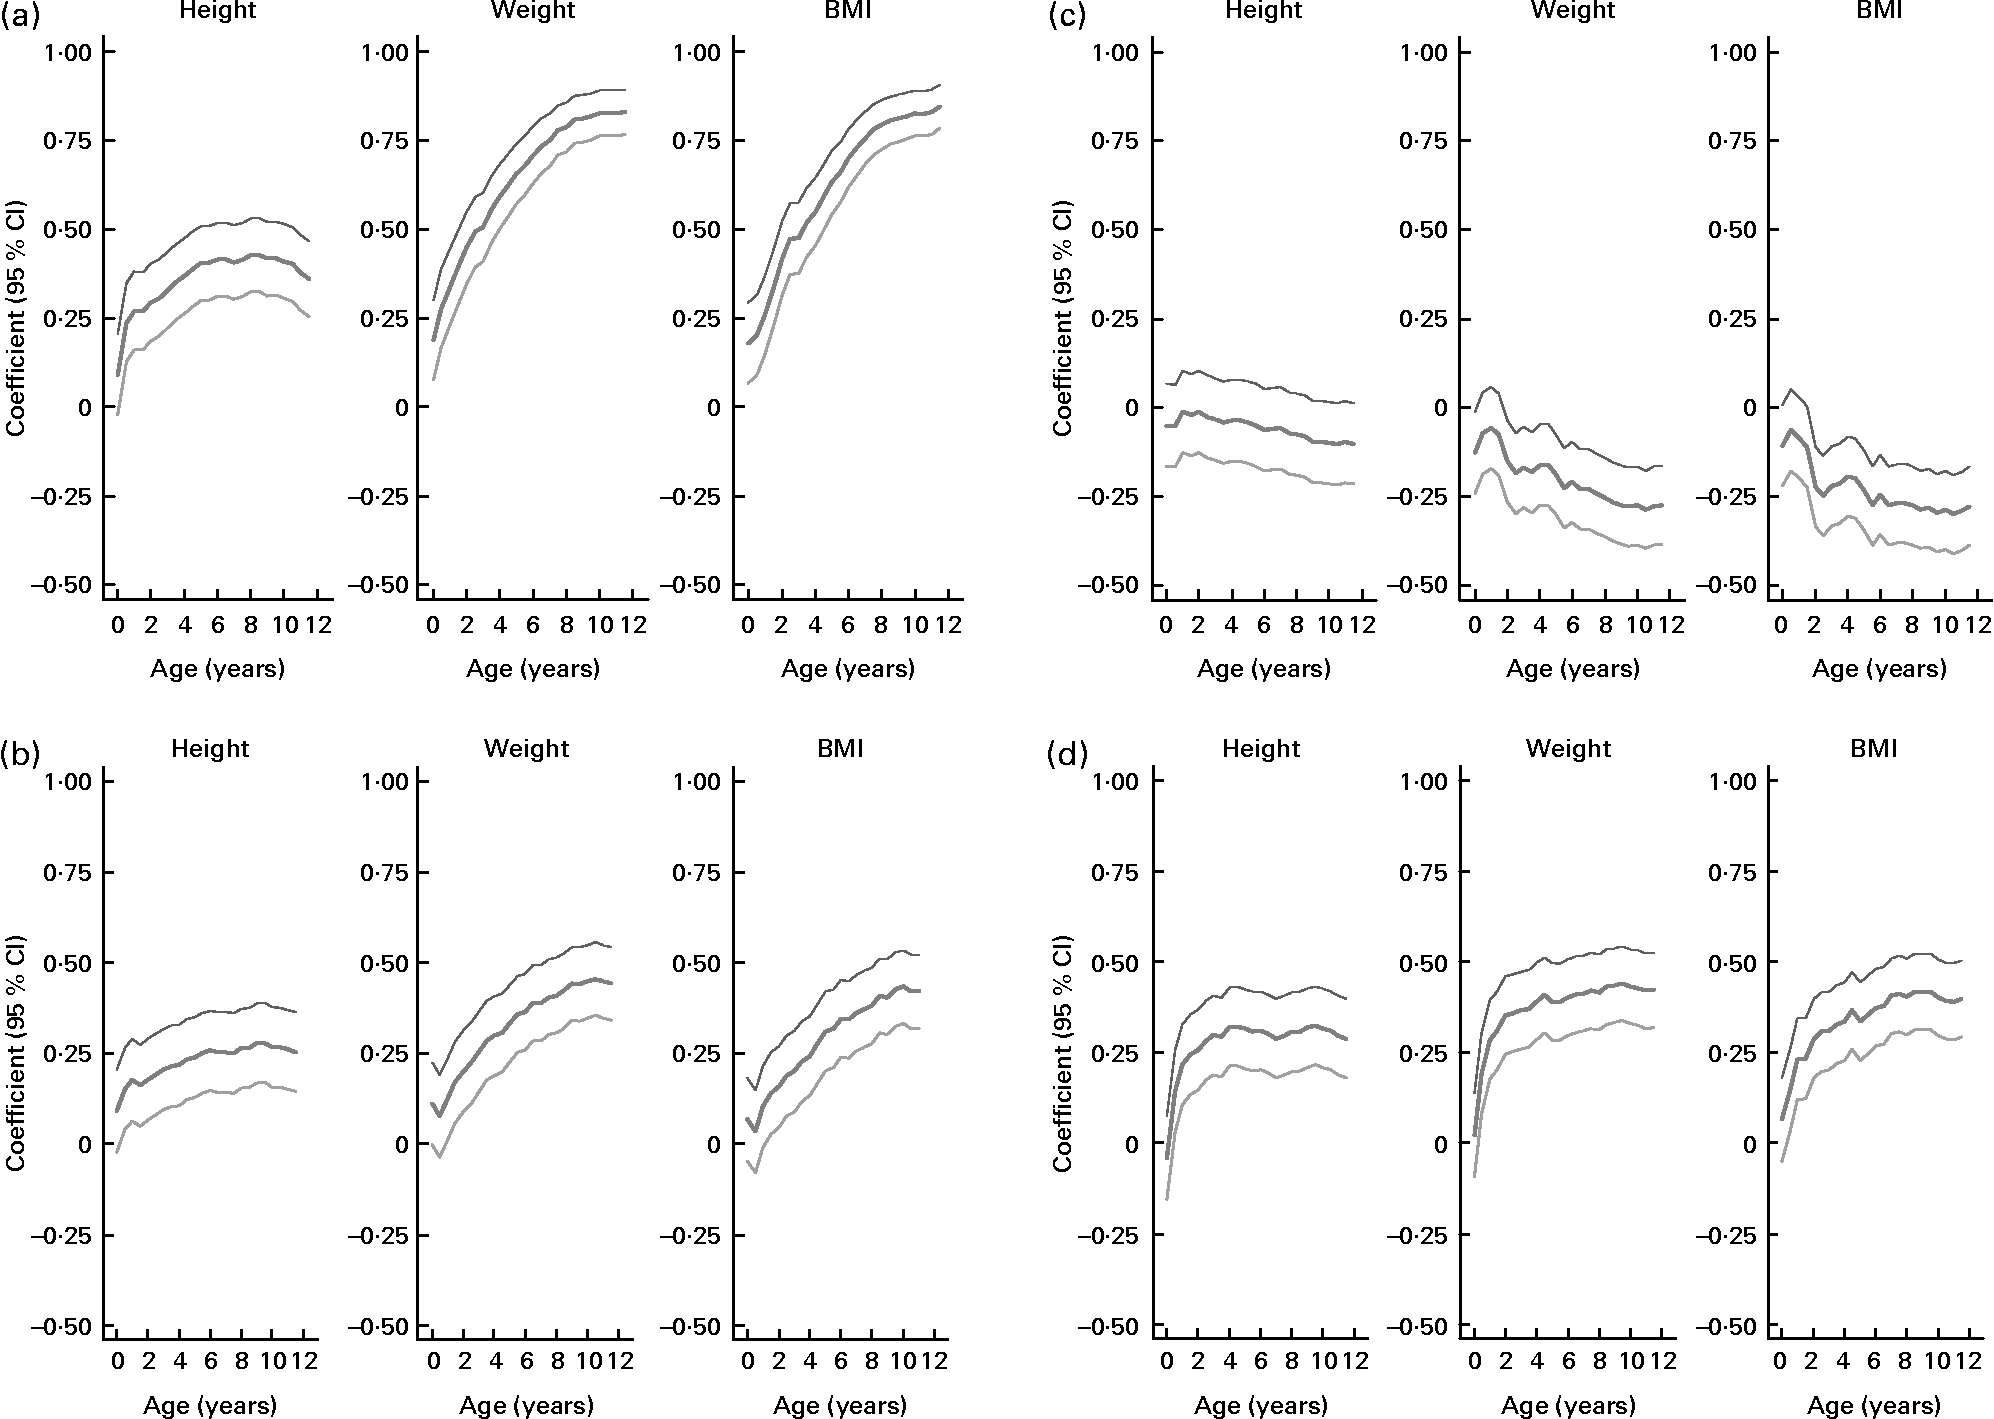
Waist circumference in the children was positively correlated with maternal size in the first trimester, placental weight, size of the fetus in the third trimester and with the length and weight of the infant at birth (Table 2). Faster rate of growth of children also predicted waist circumference (Table 4; Fig. 1(a)). Thus, waist size in children was positively related to maternal size, placental size, fetal size and birth size, as well as growth rate in infancy and childhood.

Fig. 1 Regression coefficients (![]() ) and their 95 % CI (
) and their 95 % CI (![]() ) of (a) waist circumference, (b) homeostasis model assessment of insulin resistance (HOMA-IR), (c) HDL-cholesterol and (d) systolic blood pressure with height, weight and BMI of 296 Afro-Jamaican children from birth to age 11·5 years. Analyses are adjusted for sex.
) of (a) waist circumference, (b) homeostasis model assessment of insulin resistance (HOMA-IR), (c) HDL-cholesterol and (d) systolic blood pressure with height, weight and BMI of 296 Afro-Jamaican children from birth to age 11·5 years. Analyses are adjusted for sex.
Fasting plasma insulin and homeostasis model assessment of insulin resistance
Fasting insulin was directly related to maternal weight and BMI in the first trimester (Table 2). However, these associations were no longer statistically significant following adjustment for waist circumference measured at clinic (Table 3). Fasting insulin was positively related to rate of postnatal growth in height, weight and BMI (Table 4). Thus, fasting insulin was directly related to maternal size in early pregnancy and growth in childhood.
HOMA-IR followed closely the associations seen with fasting insulin (Tables 2 and 4). The association of HOMA-IR with height, weight and BMI through childhood is illustrated in Fig. 1(b).
Fasting plasma glucose
The highest observed fasting glucose concentration was 6·0 mmol/l, which occurred in one subject only. Fasting glucose was unrelated to maternal, placental, fetal and childhood measurements (Table 2). Growth in children was not associated with any influence on fasting glucose (Table 4).
Serum lipids
Total cholesterol concentration was unrelated to maternal, placental, fetal, newborn and childhood measurements (Table 2), or rate of growth during infancy and childhood (Table 4).
HDL-cholesterol concentration was inversely related to placental and birth weight (Table 2), but these associations were no longer statistically significant following adjustment for waist circumference measured at clinic (Table 3). It was also inversely related to weight and BMI in childhood (Table 4). The relationships of HDL-cholesterol and childhood height, weight and BMI are illustrated in Fig. 1(c).
Serum TAG concentrations were not predicted by any maternal, placental, fetal, newborn or childhood variables (Tables 2 and 4).
Blood pressure
Systolic and diastolic blood pressure analyses revealed similar findings, but relationships were stronger with systolic blood pressure which is presented here. Systolic blood pressure in children was directly related to first trimester maternal weight (Table 2). This association of systolic blood pressure with maternal weight was no longer statistically significant following adjustment for waist circumference measured at clinic (Table 3). It was strongly associated with height, weight and BMI during childhood (Table 4, Fig. 1(d)).
Comparison of effects in boys and girls
The results for birth weight on blood glucose and systolic blood pressure are shown in Table 5. Systolic blood pressure was inversely related to birth weight in boys, but directly associated in girls. Similar directions of association occurred for glucose concentration.
Table 5 Multivariate regression analyses showing the systolic blood pressure and fasting blood glucose of 296 Afro-Jamaican children according to birth weight and sex
(Mean values and standard deviations)

* Adjusted for age at clinic visit.
† Adjusted for age at clinic visit and waist circumference.
Discussion
These data suggest that there is a developmental contribution to cardiovascular risk factors in these peri-pubertal children. They add new detail about the influence of maternal anthropometry in pregnancy and fetal and childhood growth on risk factors for CVD. Our data are unique in having multiple sequential measures of maternal anthropometry and blood pressure, placental and fetal growth, and infant and child growth through to adolescence. Most published data come from cross-sectional studies or from cohorts that cover a subset of these phases(Reference Barker17–Reference Strauss and Dietz19).
The girls were larger than the boys as they had progressed further through puberty at the clinic visit. These differential rates of sexual maturation may explain some of the differences in anatomy and physiology, as puberty is associated with insulin resistance due to increases in growth hormone, cortisol and insulin-like growth factor-I levels(Reference Guercio, Rivarola and Chaler20–Reference Roemmich, Clark and Lusk23). The metabolic syndrome is associated with greater waist circumference, higher blood pressure, lower HDL-cholesterol and reduced insulin sensitivity(Reference Alberti, Zimmet and Shaw10).
We used waist circumference as the measure of current size because it is the most consistent anthropometric marker of insulin resistance even in children(Reference Klein, Allison and Heymsfield24, Reference McCarthy25). Waist circumference in children was positively correlated with the size of the mother, fetus and newborn. This might simply be a consequence of the size of the child. On the other hand, more rapid growth in childhood could be associated with central adiposity. Unfortunately, we do not have measurements of segmental body composition using either MRI or dual-energy X-ray absorptiometry, so this question remains unresolved.
Glucose tolerance was maintained. There was an inverse association of glucose concentration with birth weight in boys, but a positive association in girls (Table 5). Because more of the girls had advanced into puberty, the expected fetal programming effect, present in the boys, may have been obscured in the girls. Fasting plasma insulin was higher in girls, even allowing for their BMI and body composition. This might also be explained on the basis of earlier puberty (an insulin-resistant state), or conversely that girls may be intrinsically more insulin resistant(Reference Murphy, Hosking and Metcalf26).
We had expected HDL-cholesterol concentration to be directly related to placental and birth weight. However, the association was inverse (Table 2). This seems to be explained by their common link with high child waist circumference.
The major determinant of systolic blood pressure was size in childhood, which was itself linked to maternal size. Again, girls and boys behaved differently (Table 5). There were positive associations in girls with maternal, placental and birth size, counterbalanced by negative associations in boys. These differences in the directions of associations might also be explained on the basis of earlier puberty in girls.
Our data are consistent with the concept that the nutritional status of mothers (as reflected by their anthropometry during pregnancy) influences the risk in their offspring of increased visceral fat (as reflected by the waist circumference). This increased visceral adiposity might directly result in insulin resistance and higher blood pressure, since the associations disappear when the data are adjusted for waist circumference. Visceral adipocytes secrete many inflammatory cytokines (for example, TNF, IL-6), NEFA, as well as induce hypoadiponectinaemia, and all these factors can increase insulin resistance(Reference Tchernof27). It is not clear how visceral adiposity can increase systolic blood pressure, but increased production of leptin, angiotensinogen, NEFA, reactive oxygen species and adipocytokines could be causes(Reference Mathieu, Poirier and Pibarot28).
Maternal size and body composition could influence the offspring's visceral adiposity in two ways. First, maternal size may be related to the maternal hypothalamic–pituitary–adrenal axis activity(Reference Phillips, Bennett and Wilks29–Reference Boyne, Woollard and Phillips31). In a thin, undernourished woman, the relatively hypercortisolaemic intra-uterine environment that the fetus is exposed to results in a resetting of the fetal hypothalamic–pituitary–adrenal axis, leading to increased ambient cortisol levels ex utero. Second, larger mothers may have increased nutrient flux, as they are known to have higher insulin-like growth factor-I levels in late pregnancy(Reference Boyne, Thame and Bennett32). Insulin-like growth factor-I can induce greater trans-placental NEFA, glucose and lactate transfer and thus increase the number of adipocyte cells in the offspring. Subsequent exposure to a high-fat energy-dense diet would increase the risk of adiposity, insulin resistance and systolic blood pressure(Reference Vickers, Reddy and Ikenasio33). Alternatively, our data cannot exclude the possibility that genetic factors influencing attainment of body size and cardiovascular risk factors may also be contributing to the variance of the observed associations(Reference Hattersley and Tooke34, Reference Freathy, Bennett and Ring35). At present, these risk alleles are thought to only contribute a small amount to the variance.
It is well recognised that the major determinant of newborn size is maternal nutritional status, as measured by height, weight, weight gain, BMI and dietary intake(Reference Kramer36, Reference Kramer37). We therefore infer that maternal anthropometry contributes not only to fetal and newborn size but also to childhood size, and thus to the physiological correlates of insulin sensitivity, lipids and blood pressure. Thus, the maternal nutritional influence on fetal, neonatal and childhood growth, as well as the sexual maturation difference in boys and girls, are the major determinants of size, body composition and the physiological correlates. While it is not clear if traditional cardiovascular risk factors in children have the same weight or effect size as one would expect in adults, it is clear that these risk factors can track throughout life and may therefore have some impact in later life. Our data provide evidence for this biologically plausible possibility, although we cannot quantify the magnitude of the effect.
The fundamental mechanism underlying the developmental determination of risk is thought to be epigenetic modification of the fetal genome, due mainly to the effects of the maternal environment during pregnancy(Reference Gluckman, Hanson and Cooper4, Reference Reik, Dean and Walter38, Reference Waterland and Michels39). Such modifications are induced by maternal nutritional and hormonal environments during peri-conception and gestation. Modification may also occur during infancy when the baby remains developmentally plastic(Reference Gluckman, Hanson and Cooper4). These functional epigenomic changes have the capacity to modify cellular, organ and whole-body metabolism, whole-body physiology and, ultimately, anatomy(Reference McMillen and Robinson3). Individuals whose phenotype fits them to their environments have greater likelihood of reproductive fitness, longevity and good health(Reference Gluckman, Cutfield and Hofman40). In the event of a mismatch between the individual and his environment, the risk of adiposity and CVD would be the product of epigenetically induced susceptibility and exposure.
In summary, in this cohort of Afro-Caribbean children, maternal anthropometry during pregnancy, fetal size, and childhood growth rate, contribute independently to cardiovascular risk factors in childhood.
Acknowledgements
We are grateful to all the staff of the Vulnerable Windows Cohort Study for their role in data collection over the years, as well as all the children and their mothers for participating in the study.
This research was supported by a grant from the Wellcome Trust, 183 Euston Road, London, UK and funding from the University of the West Indies.
T. E. F. contributed to all stages of the study (study design, data collection, analysis and interpretation of the data, and writing of the manuscript) and developed the first draft of the manuscript. M. S. B. contributed to the study design, data collection, interpretation of the data and the writing of the manuscript. C. O., R. A. F. and M. R. contributed to the data analysis and the writing of the manuscript. C. T.-B. and S. S.-W. contributed to data collection and writing of the manuscript.
None of the authors has any conflict of interest.


