


Introduction
The migration of elements during the evolution of clay minerals plays a critical role in controlling the chemical compositions of surface water and soils and in forming secondary minerals because clay minerals are ubiquitous in various environments on the Earth. Studies have focused more on the transformation mechanisms of clay minerals over the past decades but less on the migration of elements in these transformation processes (Dudek et al., Reference Dudek, Cuadros and Fiore2006; Hong et al., Reference Hong, Churchman, Gu, Yin and Wang2012, Reference Hong, Cheng, Yin, Churchman and Wang2015; Ryan & Huertas, Reference Ryan and Huertas2013; Li et al., Reference Li, He, Tao, Zhu, Tan, Ji, Yang and Zhang2020). One of the most common evolutions of clay minerals, kaolinization of smectites (e.g. montmorillonite and beidellite), generally occurs in weathering environments on the Earth’s surface, with the interstratified kaolinite-smectite (K-S) minerals acting as intermediate phases during these processes (Dudek et al., Reference Dudek, Cuadros and Fiore2006; Hong et al., Reference Hong, Churchman, Gu, Yin and Wang2012; Oliveira et al., Reference Oliveira, Sartor, Souza, Correa, Romero, Andrade and Ferreira2018; Li et al., Reference Li, He, Tao, Zhu, Tan, Ji, Yang and Zhang2020).
In smectites, the isomorphous substitutions of Mg2+, Fe2+, and Fe3+ for Al3+ in the octahedral sheets and/or the substitutions of Al3+ and Fe3+ for Si4+ in the tetrahedral sheets are common, and produce a net negative layer charge (Sainz-Diaz et al., Reference Sainz-Diaz, Timon, Botella and Hernandez-Laguna2000; He et al., Reference He, Li, Tao, Chen, Zhang, Zhu, Yuan and Zhu2014; Baron et al., Reference Baron, Petit, Tertre and Decarreau2016; Ilgen et al., Reference Ilgen, Kukkadapu, Dunphy, Artyushkova, Cerrato, Kruichak, Janish, Sun, Argo and Washington2017). However, the octahedral and tetrahedral cations of kaolinite are almost all Al3+ and Si4+, respectively, indicating that isomorphous substitution rarely happens in kaolinite (Aparicio & Galan, Reference Aparicio and Galan1999; He et al., Reference He, Guo, Zhu and Hu2003). The kaolinization of smectites could result, therefore, in the release of Mg and Fe from the octahedral sheets of smectites into the surrounding environments (Hong et al., Reference Hong, Cheng, Yin, Churchman and Wang2015).
The kaolinization of smectites occurs generally in acidic environments (Dudek et al., Reference Dudek, Cuadros and Fiore2006, Reference Dudek, Cuadros and Huertas2007; Ryan & Huertas, Reference Ryan and Huertas2013; Hong et al., Reference Hong, Cheng, Yin, Churchman and Wang2015). These settings benefit the dissolution of smectites and the release of Mg and Fe (Dudek et al., Reference Dudek, Cuadros and Fiore2006; Rozalén et al., Reference Rozalén, Huertas, Brady, Cama, García-Palma and Linares2008). A previous study indicated that kaolinite domains contained less Mg than smectite domains and illite domains, which suggested that Mg was released from precursor minerals when smectites and illite transformed into kaolinite (Hong et al., Reference Hong, Cheng, Yin, Churchman and Wang2015). In addition, the release of elements from precursor minerals could give rise to the precipitation of secondary minerals such as brucite and goethite (Rozalén et al., Reference Rozalén, Huertas and Brady2009; Ryan & Huertas, Reference Ryan and Huertas2013). Nevertheless, a tiny proportion of Mg and Fe in kaolinite could be inherited from the precursor octahedral sheets after the structural transformation (Ryan & Huertas, Reference Ryan and Huertas2013). Doubt remains as to the relationship between Mg and Fe released from the octahedral sheets into the surrounding environments throughout the kaolinization of montmorillonite under acidic conditions.
The objective of the present study, therefore, was to investigate the release relationship between Mg and Fe in the process of kaolinization of montmorillonite under hydrothermal conditions. The starting material and solid phases obtained were characterized comprehensively with X-ray diffraction (XRD), Fourier-transform infrared spectroscopy (FTIR), Mössbauer spectroscopy, 27Al magic angle spinning nuclear magnetic resonance spectroscopy (27Al MAS NMR), high-resolution transmission electron microscopy (HRTEM), and energy-dispersive X-ray spectroscopy (EDS). The concentrations of Mg and Fe in the supernatant solutions corresponding to the hydrothermal products were measured with inductively coupled plasma atomic emission spectroscopy (ICP-AES). The hypothesis was that the Mg and Fe ions are distributed randomly within the octahedral sheets of the montmorillonite and exhibit a similar tendency to be released progressively during the transformation to kaolinite.
Materials and Methods
Starting Material and Hydrothermal Experiments
Montmorillonite (Mnt) as the precursor mineral to be transformed into kaolinite (Li et al., Reference Li, He, Tao, Zhu, Tan, Ji, Yang and Zhang2020) was obtained from a mineral deposit near Chifeng, Inner Mongolia Autonomous Region, China, which consisted mainly of Mnt. The chemical composition was determined using X-ray fluorescence spectroscopy (XRF), and the results were shown in a previous study (Li et al., Reference Li, He, Tao, Zhu, Tan, Ji, Yang and Zhang2020). The cation-exchange capacity (CEC) of Mnt was 110.73 mmol/100 g, determined with UV-Vis spectrophotometry of using [Co(NH3)6]3+ (Alfa Aesar, A15470) as the exchanging cation (Hu et al., Reference Hu, Lu and Yang2000; He et al., Reference He, Li, Tao, Chen, Zhang, Zhu, Yuan and Zhu2014). The Mnt was not treated chemically before the hydrothermal experiments. The detailed procedures of hydrothermal experiments were described previously (Li et al., Reference Li, He, Tao, Zhu, Tan, Ji, Yang and Zhang2020). In brief, the sample containing Mnt was placed in a solution containing AlCl3 (Guangzhou Chemical Reagent Factory, China). The resulting pH value of suspension was adjusted to 3 and then treated hydrothermally at 250°C under autogenous water pressure for various times (from 1 to 8 days). The suspension obtained was centrifuged at 4000 rpm (3000×g) for 10 min, and the supernatant solution was collected to determine the concentrations of Mg and Fe. The solid product was washed several times to remove redundant ions and dried at 80°C for 24 h and finally marked as Mnt-X, where X stands for hydrothermal duration time (e.g. 1d = 1 day).
Methods
XRD
XRD analyses were performed on a Bruker D8 Advance diffractometer (Karlsruhe, Germany) with Ni-filtered CuKα radiation (λ = 0.154 nm, 40 kV, and 40 mA) at Guangzhou Institute of Geochemistry (GIG), Chinese Academy of Sciences (CAS) (Guangzhou, China). All of the XRD patterns of Mnt and its hydrothermal products were collected between 3 and 70°2θ at a scanning rate of 3°2θ/min.
FTIR
FTIR spectra were recorded on a Bruker Vertex-70 Fourier-transform infrared spectrometer (Ettlingen, Germany) using the KBr pressed-disk technique at GIG, CAS (Guangzhou, China). Each KBr pellet was prepared by mixing 0.9 mg of the sample with 80 mg of spectroscopic-grade KBr powder which was then well ground in an agate mortar for 15 min. Then the specimen was pressed for 5 min at 10 kbar. Finally, the mixture was heated under a lamp for 3 min to reduce adsorbed water before the FTIR measurement. All of the spectra were collected in the 4000–400 cm–1 range with 64 scans and a resolution of 4 cm–1 (He et al., Reference He, Ji, Tao, Zhu, Chen, Liang, Li and Dong2017).
Mössbauer spectroscopy
The Mössbauer spectrum of Mnt was recorded on a WSS-10 spectrometer (Silver Double Limited, USA) at 298 K at GIG, CAS (Guangzhou, China). The velocity drive transducer operated in a triangular waveform mode over energy ranges of ±15 mm/s, with a 25 mCi 57Co source dispersed as 10 wt.% in a thin Rh foil. Spectral deconvolution of the Mössbauer spectrum obtained was fitted using the doublet having a Lorentzian line shape (Decarreau & Bonnin, Reference Decarreau and Bonnin1986; Baron et al., Reference Baron, Petit, Pentrak, Decarreau and Stucki2017).
27Al MAS NMR
27Al MAS NMR spectra were recorded on a Bruker AVANCE III 600 spectrometer (Rheinstetten, Germany) at the resonance frequencies of 156.4 MHz at a high magnetic field laboratory, CAS (Hefei, China). A 4 mm HX double-resonance MAS probe was used to measure 27Al MAS NMR at a sample spinning rate of 14 kHz. The spectra were recorded by a small-flip angle technique with a pulse length of 0.5 μs (<π/12) and a 1 s recycle delay. The chemical shift of the 27Al MAS NMR spectrum was referenced to 1 M aqueous Al(NO3)3 (Zhang et al., Reference Zhang, He, Tao, Ji, Li, Ma, Su and Zhu2017).
HRTEM
The oriented samples Mnt, Mnt-4d, and Mnt-8d were embedded in epoxy resin (Dong et al., Reference Dong, Peacor and Murphy1998) and then dried at 100°C for 3 h to observe the lattice fringes of montmorillonite and kaolinite along the [001] direction. Subsequently, ultrathin sections with a thickness of ~75 nm were obtained with a diamond knife operating on a Lecia EM UC7 ultramicrotome (Wetzlar, Germany) at GIG, CAS. The specimen was placed on a carbon-coated copper micro-grid for TEM observation (Ji et al., Reference Ji, Zhu, He, Tao, Zhu, Ma, Chen, Li and Zhou2018; Li et al., Reference Li, He, Tao, Zhu, Tan, Ji, Yang and Zhang2020). TEM was performed on an FEI Talos F200S microscope (Brno, Czech Republic) equipped with an X-ray energy-dispersive detector at GIG, CAS (Guangzhou, China). The instrument was operated at an accelerating voltage of 200 kV.
ICP-AES
Mg and Fe in the starting material were dissolved into solution during the hydrothermal treatment process (Dudek et al., Reference Dudek, Cuadros and Huertas2007). The concentrations of Mg and Fe in the supernatant solutions of hydrothermal products were determined using a Thermo Scientific iCAP 7000 inductively coupled plasma atomic emission spectrometer (Bremen, Germany) at Ji’nan University (Guangzhou, China). Each supernatant solution was diluted 10 times to reduce the concentrations of the ions before ICP-AES analysis.
Results and Discussion
Characteristics of Starting Materials and their Hydrothermal Products
XRD patterns
The powder XRD patterns of Mnt and hydrothermal products are shown in Fig. 1a. Before the hydrothermal treatment, the d 001 value of montmorillonite was 1.229 nm, suggesting that Na+ was the dominant cation in the interlayers on the basis of XRF results (Li et al., Reference Li, He, Tao, Zhu, Tan, Ji, Yang and Zhang2020). Thus, the precursor mineral that was used in the present study was Na-montmorillonite. The basal spacing value of montmorillonite increased to 1.512 nm after a 1-day treatment (Mnt-1d), implying that Al3+ in the acidic solution entered into the interlayer space (Li et al., Reference Li, He, Tao, Zhu, Tan, Ji, Yang and Zhang2020). For the hydrothermal products from Mnt-4d to Mnt-8d, one newly appeared reflection with a d value of 0.719 nm was the characteristic 001 reflection of kaolinite (Dudek et al., Reference Dudek, Cuadros and Fiore2006). With an extended duration of hydrothermal treatment, the intensities of the reflections related to montmorillonite decreased dramatically and almost disappeared after the 8-day hydrothermal treatment (Mnt-8d), whereas those of kaolinite increased. This indicated that the transformation from montmorillonite into kaolinite was virtually complete during the hydrothermal processes. It is noteworthy that the d 060 value of clay minerals slightly decreased from 0.149 (in Mnt) to 0.148 nm (in Mnt-8d) with the increase in hydrothermal reaction time (Fig. 1b), indicating that some ions larger than Al were removed gradually from the octahedral sheets (Cuadros et al., Reference Cuadros, Nieto and Wing-Dudek2009).
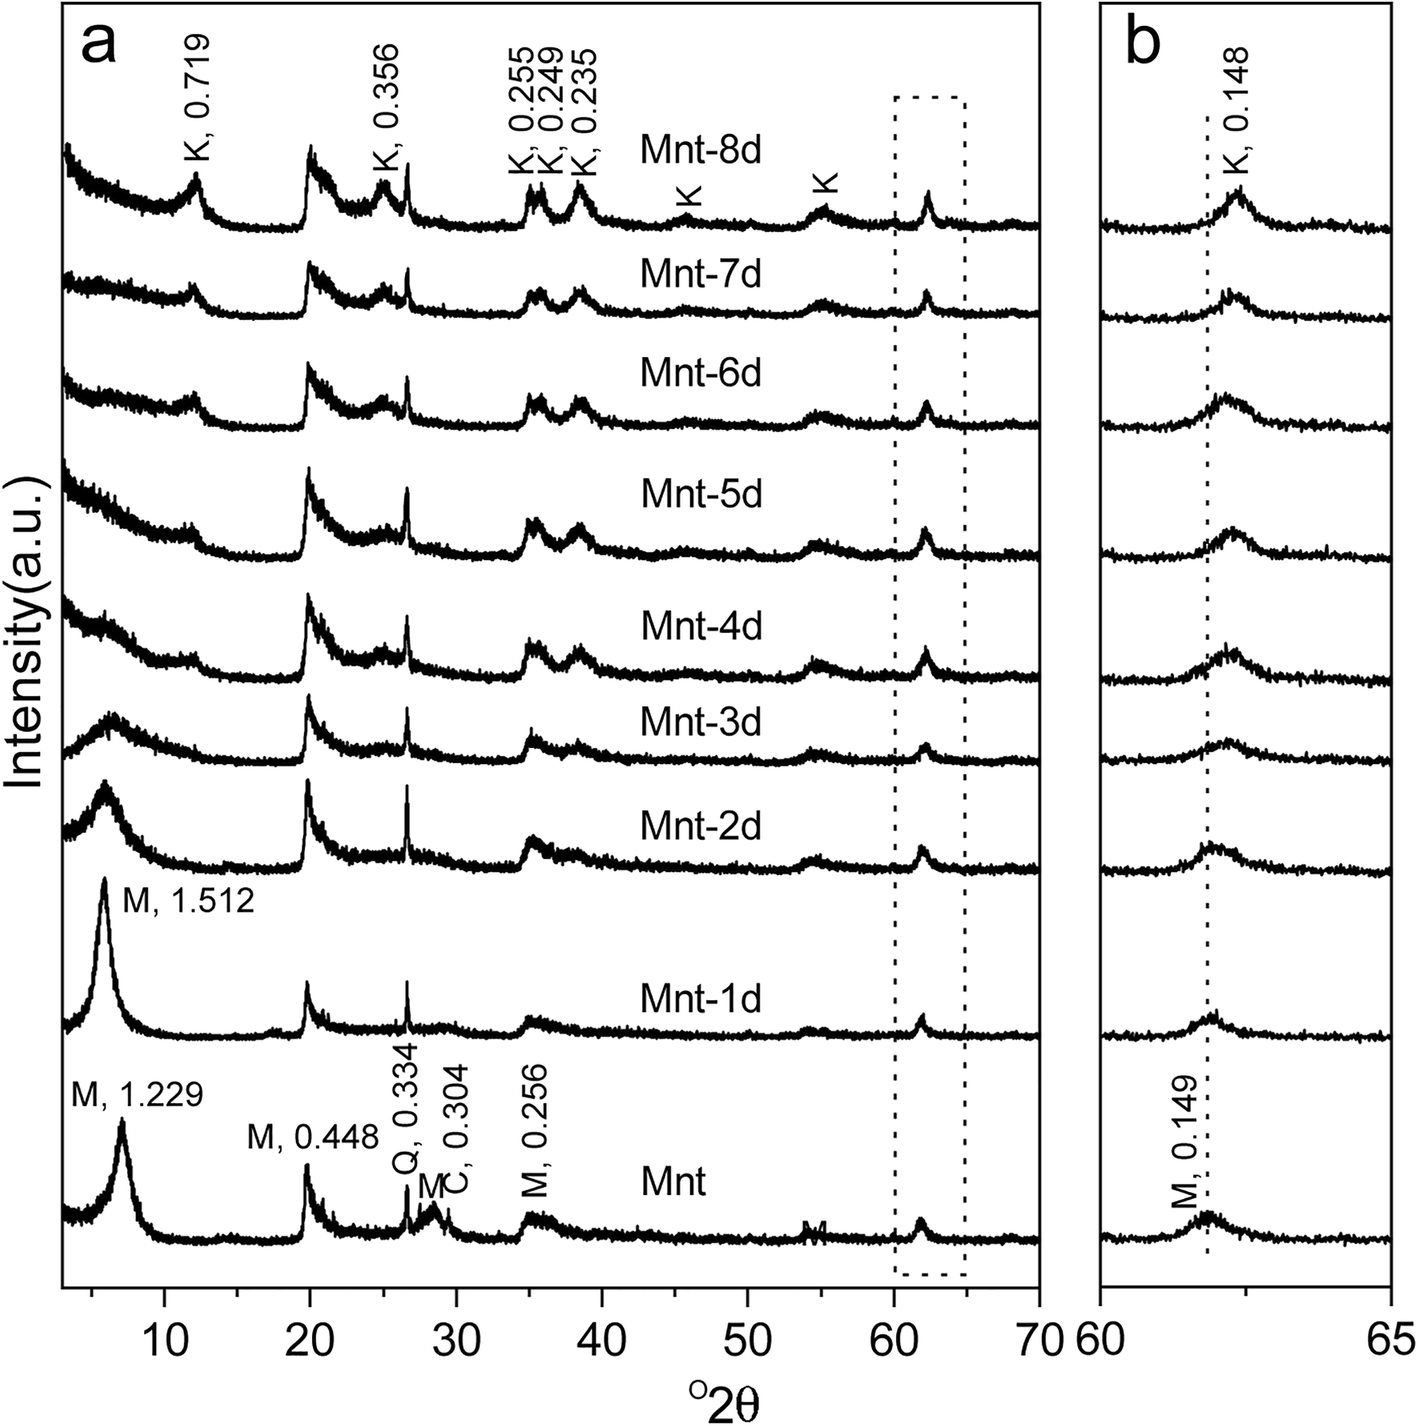
Fig. 1. XRD patterns of sample Mnt and its hydrothermal products after various duration times. The hydrothermal products were obtained from 1 day (Mnt-1d) to 8 days (Mnt-8d). Image b is a magnification of the region surrounded by the dotted rectangle in image a
In all XRD patterns, the reflection with a d value of 0.334 nm was indicative of the existence of quartz (Schelz, Reference Schelz1976), the intensity of which showed no noticeable change, reflecting that quartz was relatively stable throughout the hydrothermal treatment. Hence, it can be used as an internal standard for calibrating the reflection positions of the clay minerals, especially the 060 reflections (Fig. 1b).
FTIR spectra
Kaolinite possesses inner-surface hydroxyls that montmorillonite does not. Such a difference could be distinguished by their FTIR spectra (Fig. 2). The structural –OH stretching vibrations of montmorillonite and/or kaolinite in the starting material and the hydrothermal products were recorded in the 3700 to 3600 cm–1 range. For Mnt, the Al2–OH stretching vibration was relatively broad and located at ~3624 cm–1 (Dudek et al., Reference Dudek, Cuadros and Huertas2007). A similar band also appeared in the FTIR spectra of hydrothermal products with a sharp shape, which resulted from the overlap with the inner Al2–OH stretching vibration of the kaolinite subgroup minerals (Adazabra et al., Reference Adazabra, Viruthagiri and Shanmugam2017). Two new absorption bands at 3702 and 3660 cm–1 were ascribed to the inner surface Al2–OH stretching vibrations of kaolinite in the hydrothermal products (except Mnt-1d), and their intensities gradually became stronger with the increase in hydrothermal duration time. Note that the band at 3702 cm–1 attributed to the Al2–OH stretching vibration of kaolinite was displayed in the FTIR spectrum of Mnt-2d, indicating strongly the formation of kaolinite layers not detected by the XRD measurement (Ryan & Huertas, Reference Ryan and Huertas2013). The appearance of such an absorption band suggested that FTIR analysis is much more sensitive to the formation of kaolinite layers than the XRD method, because the FTIR is used to detect directly the chemical bonds of minerals, and is much less dependent on the periodicity of a crystal lattice than the XRD method is. Other, not easily observed, features included other structural –OH (e.g. AlMg–OH and AlFe–OH) stretching vibrations in the clay minerals, owing to their low proportions in the octahedral sheets, as well as the overlapping bands of complicated Al2–OH stretching vibrations and/or –OH stretching vibrations in the adsorbed water.
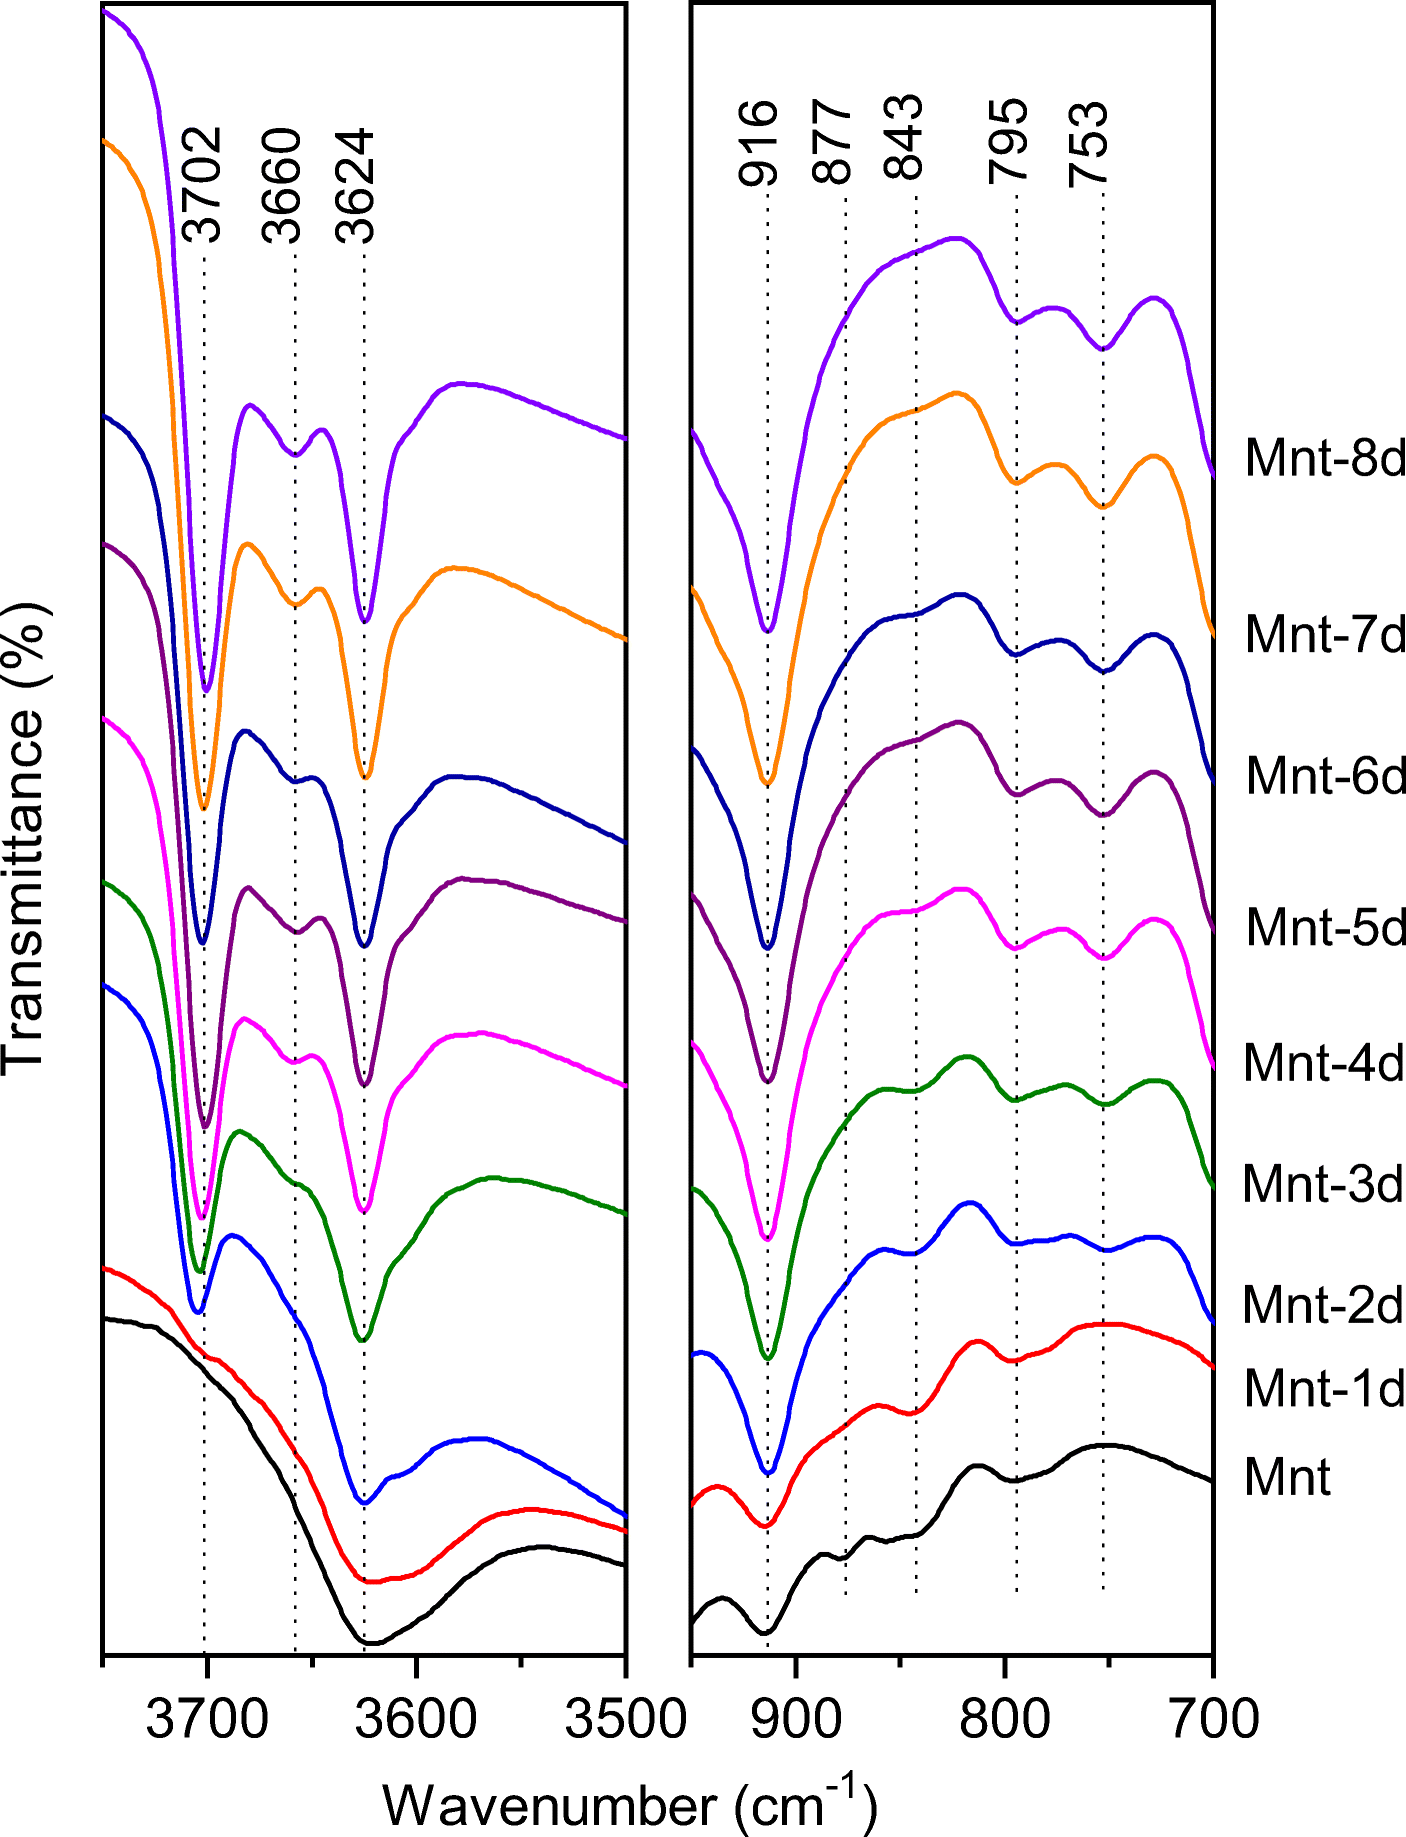
Fig. 2. FTIR spectra of starting material (Mnt) and its hydrothermal products after various duration times. The hydrothermal products were obtained from 1 day (Mnt-1d) to 8 days (Mnt-8d)
FTIR spectra are also powerful for distinguishing kaolinite from halloysite (7 Å). In this study, the FTIR spectra indicated that poorly crystallized kaolinite rather than halloysite (7 Å) formed in the hydrothermal products, because the Al2–OH stretching bands of halloysite (7 Å) always located at ~3700 and 3630 cm–1, and the other visible absorption bands were absent between them (Pansu & Gautheyrou, Reference Pansu and Gautheyrou2006; Zhang et al., Reference Zhang, Fu and Yang2012; He et al., Reference He, Ji, Tao, Zhu, Chen, Liang, Li and Dong2017). Moreover, two bands at 795 and 753 cm–1 were of nearly equal intensity (Fig. 2), also suggesting that the neo-formed product was kaolinite rather than halloysite (7 Å) because the former band is weaker than the latter 1 in halloysite (Pansu & Gautheyrou, Reference Pansu and Gautheyrou2006).
In the low-frequency regions, the Al2–OH bending vibration of montmorillonite and/or kaolinite was located at 916 cm–1 and its intensity also increased with the extension of hydrothermal duration time due to the progressive transformation of montmorillonite into kaolinite. Notice also that weak AlMg–OH and AlFe–OH bending vibrations in precursor montmorillonite appeared at 877 and 843 cm–1, respectively (Fig. 2) (Cuadros & Dudek, Reference Cuadros and Dudek2006; Dudek et al., Reference Dudek, Cuadros and Huertas2007). They gradually weakened even further with the extension of hydrothermal treatment time and nearly disappeared in sample Mnt-8d (Fig. 2).
Mössbauer spectrum
Theoretically, Fe3+ could occupy the sites in the octahedral sheets and the tetrahedral sheets of montmorillonite, and Fe2+ could occupy the sites in the octahedral sheets. Although the Fe content was small, as indicated by the XRF results (Li et al., Reference Li, He, Tao, Zhu, Tan, Ji, Yang and Zhang2020), the valence and occupancy of Fe in either tetrahedral or octahedral sheets of precursor montmorillonite were able to be determined according to the isomer shift and quadrupole splitting values of the deconvolution of the Mössbauer spectrum (Baron et al., Reference Baron, Petit, Pentrak, Decarreau and Stucki2017). In the current study, the Mössbauer spectrum showed one doublet, with isomer shift and quadrupole splitting of 0.33 and 0.61 mm/s, respectively (Fig. 3), indicating that most of the iron occurred as Fe3+ in the octahedral sheets (Decarreau & Bonnin, Reference Decarreau and Bonnin1986; Baron et al., Reference Baron, Petit, Pentrak, Decarreau and Stucki2017). This observation was consistent with the FTIR result of precursor montmorillonite (Fig. 2) and suggested that Fe3+ occupied preferentially the octahedral sheet of montmorillonite.
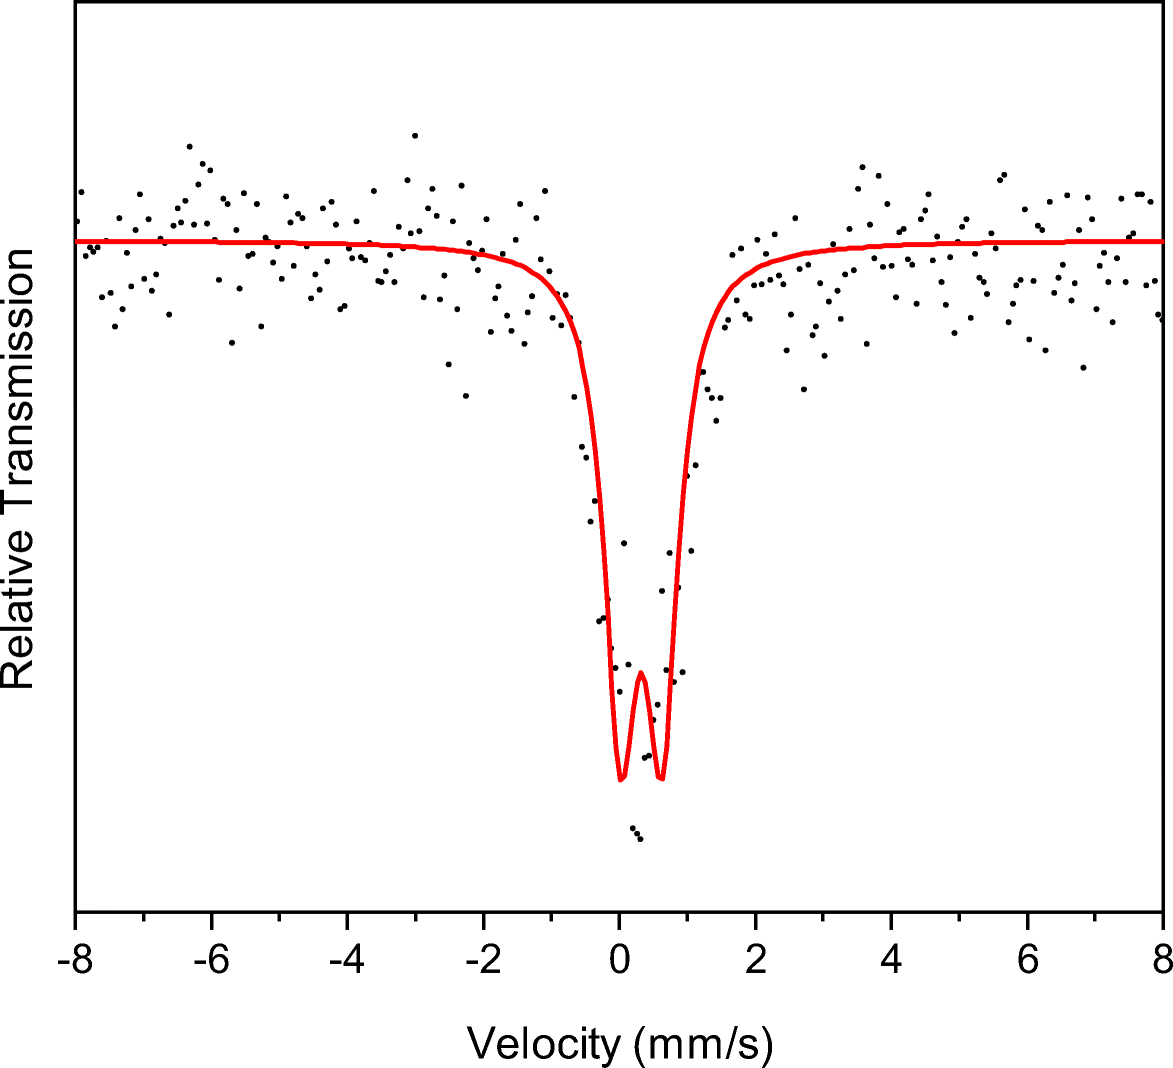
Fig. 3. Mössbauer spectrum at 298 K of starting material (Mnt). The spectral deconvolution was optimal using one doublet
27Al MAS NMR spectrum
The 27Al MAS NMR spectrum of montmorillonite displayed a strong signal of 6-coordinated Al (VIAl) at ~5.01 ppm and a weak one from 4-coordinated Al (IVAl) at ~61.62 ppm (Fig. 4). After one-day of treatment (Mnt-1d), the weak IVAl signal disappeared, which probably resulted from the dissolution of montmorillonite particles containing a small amount of isomorphous substitution of Al3+ for Si4+ in the tetrahedral sheets. Extension of the hydrothermal treatment to eight-days created a sharp signal at ~6.34 ppm (Fig. 4), which was assigned to VIAl in the octahedral sheets of kaolinite (He et al., Reference He, Ji, Tao, Zhu, Chen, Liang, Li and Dong2017).
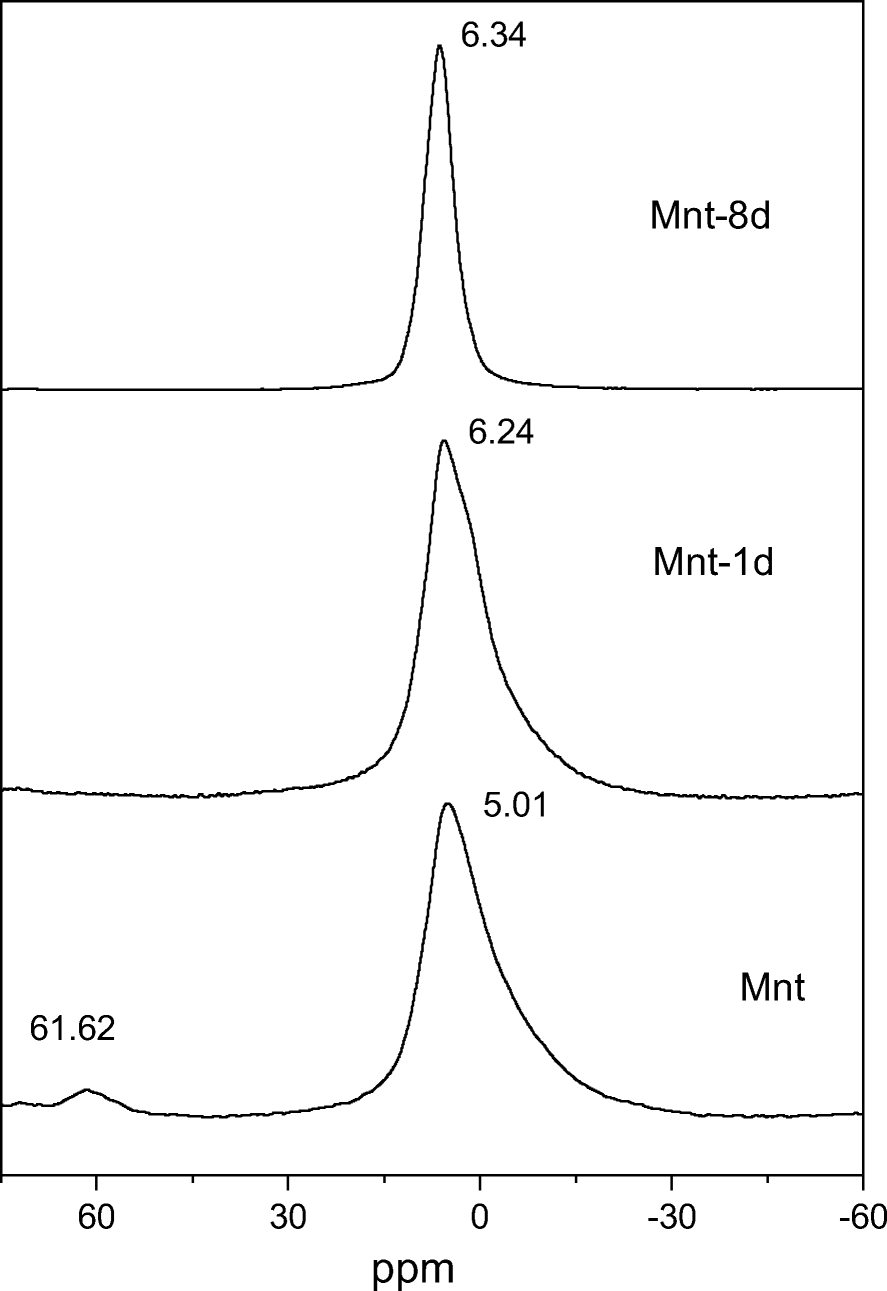
Fig. 4. 27Al MAS NMR spectra of starting material (Mnt) and hydrothermal products after 1 day (Mnt-1d) and 8 days (Mnt-8d)
The combined results of XRF (Li et al., Reference Li, He, Tao, Zhu, Tan, Ji, Yang and Zhang2020), Mössbauer, and 27Al MAS NMR spectra inferred that the chemical formula of montmorillonite was M +0.54(Si3.96Al0.04)(Al1.25Mg0.5Fe0.25)O10(OH)2·nH2O, where both Mg and Fe occupied the octahedral sheets, and the atomic ratio of (Mg+Fe)/Al (major octahedral ions) was ~0.58.
HRTEM observations and EDS analyses
Precursor montmorillonite and product kaolinite were easily identified under HRTEM observations because these two clay minerals exhibited different lattice-fringe thicknesses along their own [001] directions (Fig. 5). The HRTEM image of Mnt showed that montmorillonite particles exhibited lattice fringes with a periodicity of ~1.0 nm due to the escape of interlayer water by electron beam heating (Fig. 5a and e) (Li et al., Reference Li, He, Tao, Zhu, Tan, Ji, Yang and Zhang2020). The EDS analysis of such montmorillonite domains indicated that these particles had significantly greater Si and Al contents as well as minor Mg and Fe (Fig. 6), and the (Mg+Fe)/Al atomic ratio was close to that (0.58) of Mnt by XRF determination. The XRD pattern showed that montmorillonite and kaolinite occurred simultaneously in sample Mnt-4d (Fig. 1a). Correspondingly, these two clay mineral phases were discovered during the HRTEM observations of this sample (Fig. 5b, c, f, and g). Among them, the lattice fringes representing montmorillonite had a periodicity of ~1.3 nm (Fig. 5f), suggesting the formation of hydroxy-Al polymers in the interlayers of montmorillonite (Ryan & Huertas, Reference Ryan and Huertas2009; Li et al., Reference Li, He, Tao, Zhu, Tan, Ji, Yang and Zhang2020), which was consistent with the XRD test (Fig. 1a). Besides, kaolinite domains showed straight lattice fringes with ~0.7 nm thickness (Fig. 5c and g). The EDS analysis of sample Mnt-4d showed that the (Mg+Fe)/Al atomic ratio (0.20) of montmorillonite domains was greater than that (0.08) of kaolinite domains (Fig. 6b and c). In sample Mnt-8d, abundant lattice fringes with a periodicity of ~0.7 nm were observed (Fig. 5d and h), reflecting the large amount of kaolinite formed. The EDS analysis showed that these kaolinite domains contained trace amounts of Mg and Fe, and the (Mg+Fe)/Al atomic ratio (0.05) was also very low (Fig. 6d), which probably resulted from the adsorption of a very small amount of Mg and Fe ions onto the kaolinite particles rather than the preservation of these two ions in the octahedral sheets of newly formed kaolinite, because the pH of the hydrothermal experiments in the present study was very unfavorable to the formation of Mg- and Fe-hydroxide structures (Rozalén et al., Reference Rozalén, Huertas, Brady, Cama, García-Palma and Linares2008; Li et al., Reference Li, He, Tao, Zhu, Tan, Ji, Yang and Zhang2020).
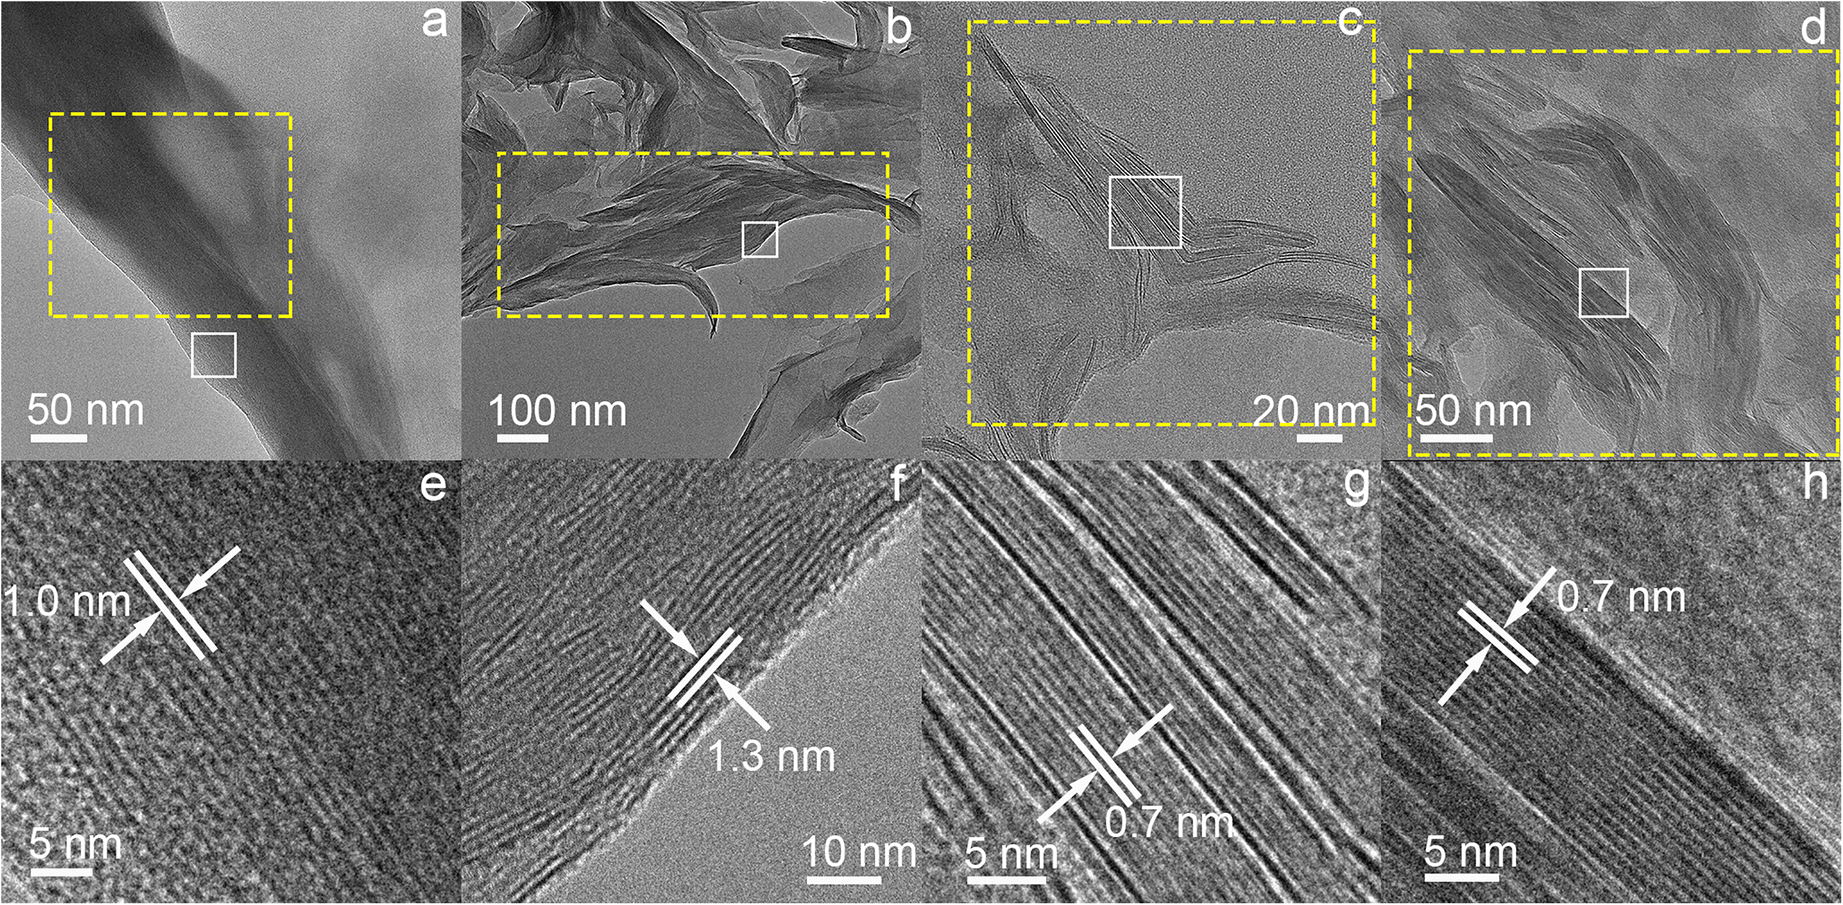
Fig. 5. TEM images of montmorillonite and kaolinite in the starting material (Mnt) and its hydrothermal products: a montmorillonite particle in sample Mnt; b montmorillonite particles in the hydrothermal product obtained from acidic solutions containing Al after 4 days (Mnt-4d); c kaolinite particle in sample Mnt-4d; d kaolinite particles in sample Mnt-8d. Images e, f, g, and h are the HRTEM images of the areas surrounded by the solid white squares in images a, b, c, and d, respectively
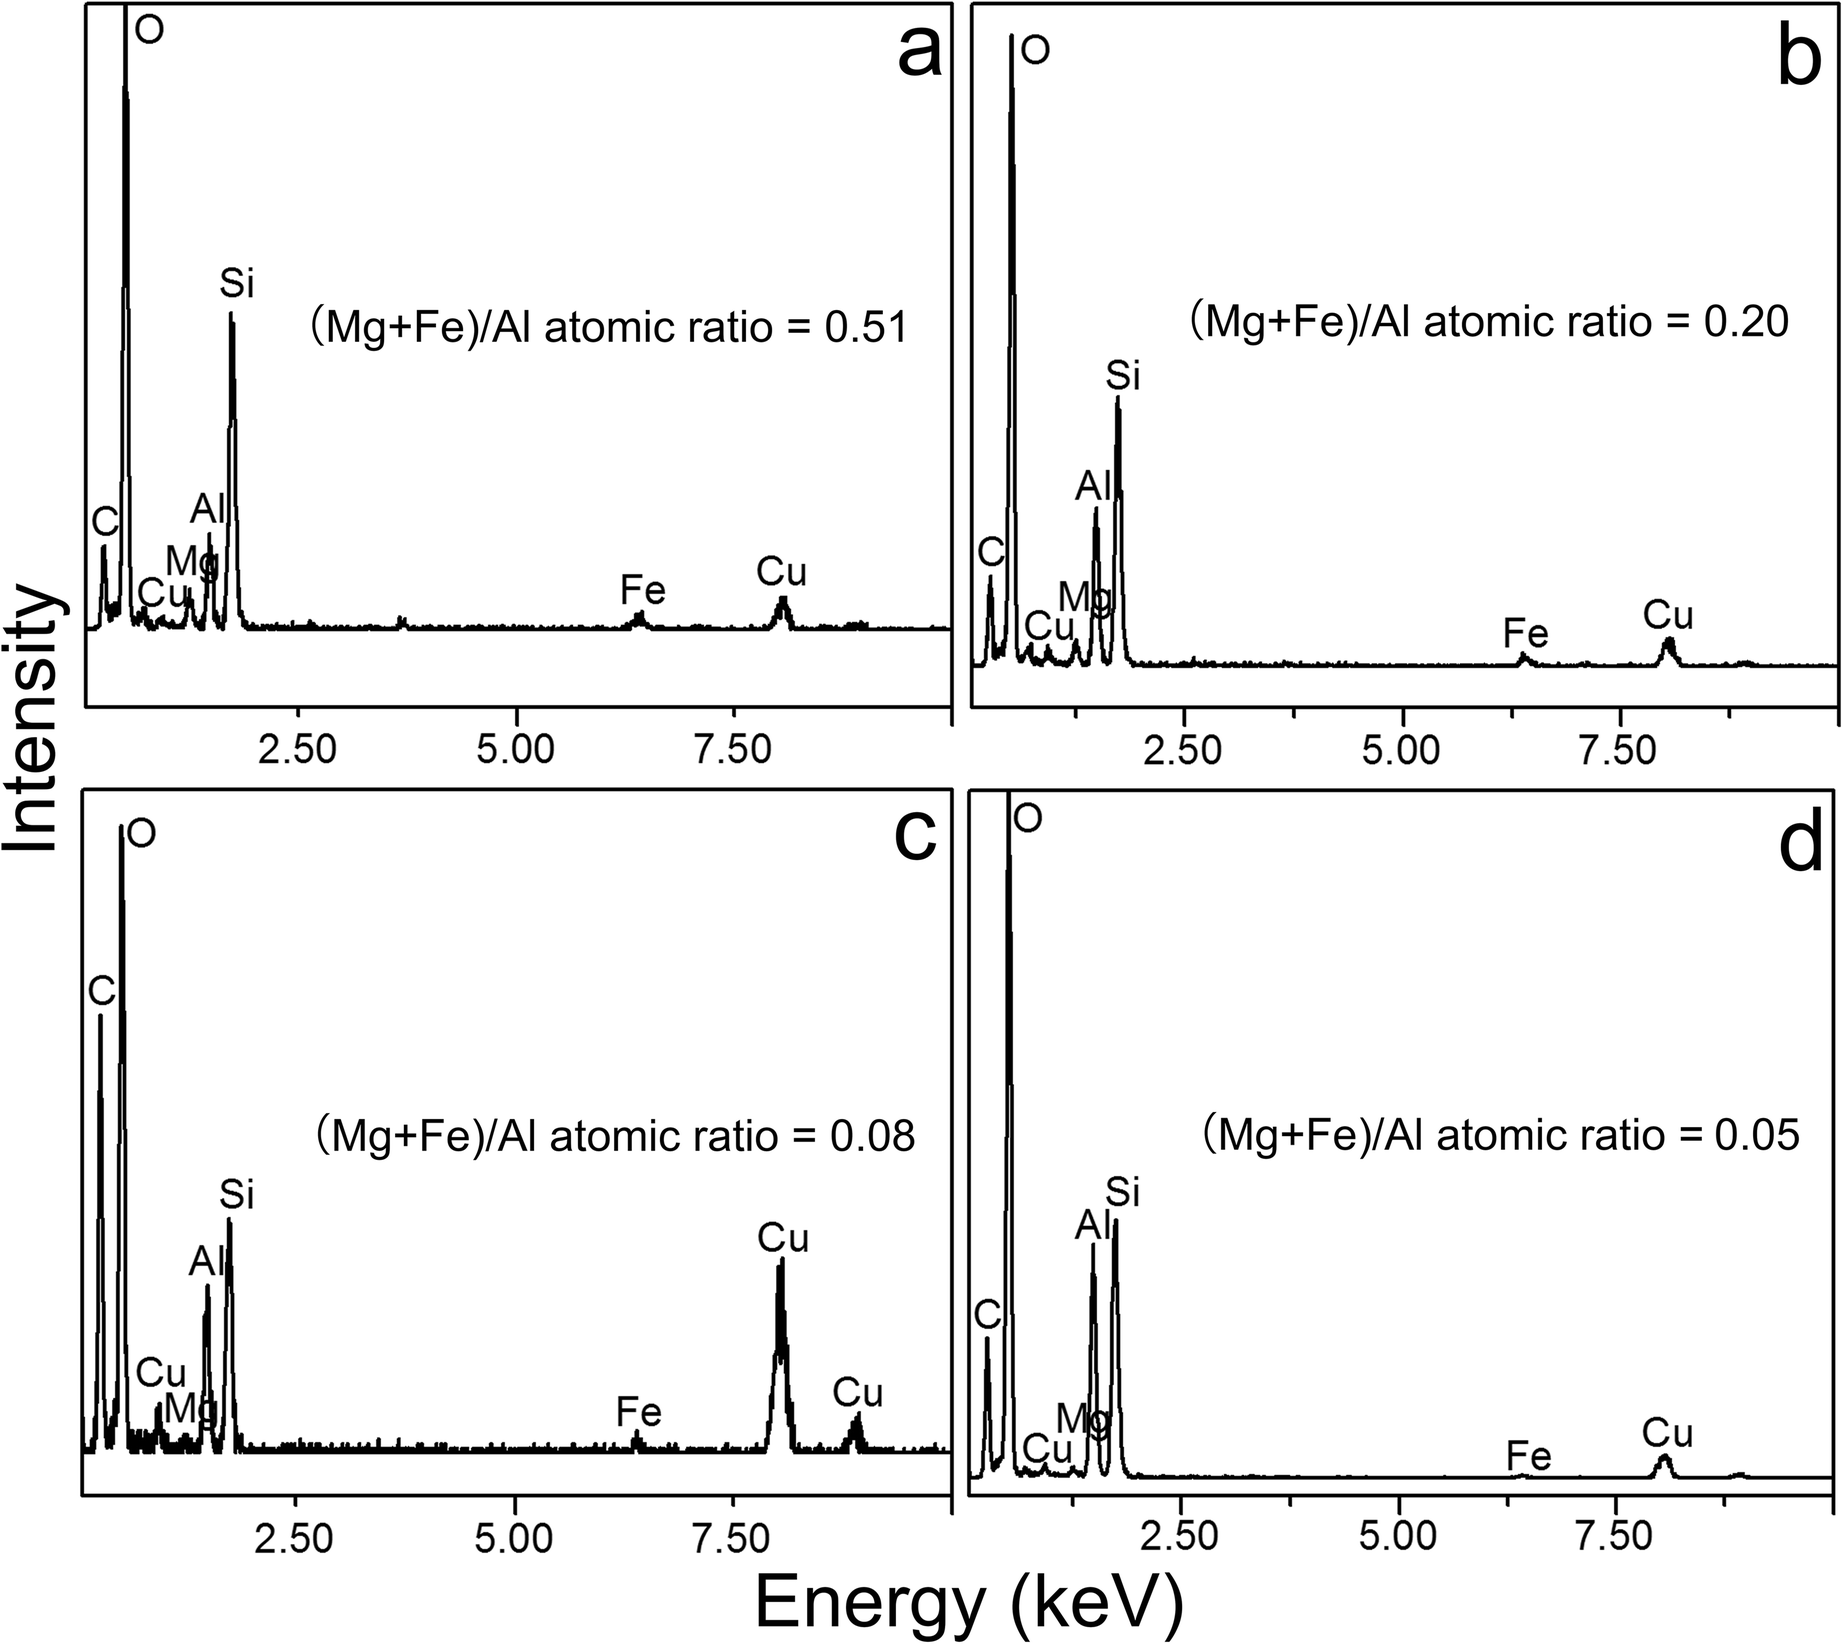
Fig. 6. EDS spectra of montmorillonite and kaolinite particles in the starting material (Mnt) and hydrothermal products. Images a, b, c, and d are EDS spectra of the regions surrounded by yellow dotted rectangles in Fig. 5 a, b, c, and d, respectively
ICP-AES analysis
The concentrations of Mg and Fe for Mnt-1d did not reflect exactly their release from precursor montmorillonite, because a small amount of Mg and Fe might be stored in a few other weakly crystallized or amorphous phases. However, the accumulated concentrations of both ions in the supernatant solution corresponding to each sample reflected their migrations from solid phases into solution, because all of the samples went through a similar initial hydrothermal treatment. Therefore, the release of Mg and Fe was also mirrored by their concentrations in the supernatant solutions after various hydrothermal reactions times (Fig. 7).
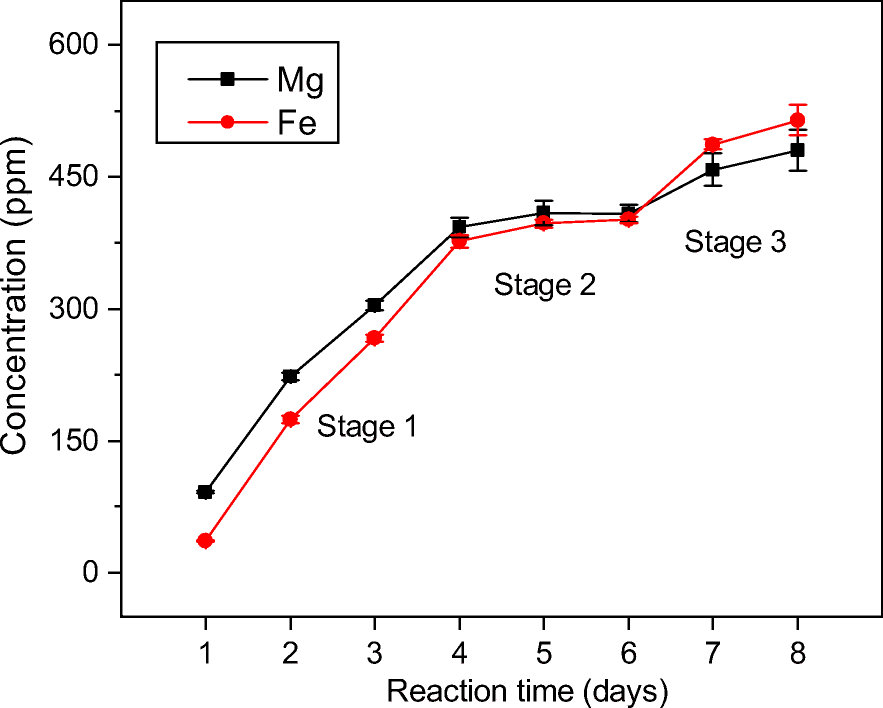
Fig. 7. Concentrations of Mg and Fe in the supernatant solutions of hydrothermal products after various reaction times
The concentrations of Fe and Mg were close and exhibited similar evolutionary tendencies during the montmorillonite kaolinization process. The relative concentrations of Mg and Fe changed, however. In stage 1 (1–4 days), the concentration of Mg was greater than that of Fe, whereas this relationship was reversed in stage 3 (6–8 days). Increased concentrations of Mg and Fe also indicated the gradual release of these two ions from octahedral sheets with changed release rates during montmorillonite kaolinization. The results showed that Mg and Fe started with a fast release from the solid phase (stage 1 in Fig. 7) and followed with a very slow rate indicated by their nearly constant concentrations (stage 2 in Fig. 7). The release ended at another fast rate as reflected by an increase in the concentrations of Mg and Fe during the timescale of the experiments (stage 3 in Fig. 7). Such changed concentrations and release rates of Mg and Fe resulted mainly from the different dissolution rates of montmorillonite with varied particle sizes and edge structures (Bray et al., Reference Bray, Oelkers, Bonneville, Wolff-Boenisch, Potts, Fones and Benning2015; Li et al., Reference Li, He, Tao, Zhu, Tan, Ji, Yang and Zhang2020). In stage 1, the release of Mg and Fe was probably derived from small montmorillonite particles always with a large proportion of rough edges, which exhibited a fast dissolution rate. Later, large montmorillonite particles would dissolve, corresponding to the release of Mg and Fe in stages 2 and 3 (Fig. 7).
Release of Mg and Fe from the Octahedral Sheets of Precursor Montmorillonite
Based on the FTIR result, the absorption bands at 877 and 843 cm–1 corresponding to AlMg–OH and AlFe–OH bending vibrations, respectively, gradually became weak and eventually almost disappeared with the increase in hydrothermal reaction time (Fig. 2), reflecting the progressive release of octahedral Mg and Fe. Moreover, the XRD result showed that the d 060 value of the clay minerals decreased slightly from 0.149 (in Mnt) to 0.148 nm (in Mnt-8d) with the increasing hydrothermal treatment time (Fig. 1b). This slight decrease in d 060 was due to the release of Mg and Fe from the octahedral sheets because the b cell dimension of phyllosilicates is sensitive to the subtle changes in the radius of octahedral cations (cation radii: Fe2+ > Mg2+ > Fe3+ > Al3+) (Cuadros et al., Reference Cuadros, Nieto and Wing-Dudek2009; Cuevas et al., Reference Cuevas, Leguey, Garralon, Rastrero, Procopio, Sevilla, Jimenez, Abad and Garrido2009; Doublier et al., Reference Doublier, Roache and Potel2010). Combined data from the HRTEM images and EDS analyses of sample Mnt-4d indicated that the (Mg+Fe)/Al atomic ratio of neo-formed kaolinite domains was smaller than that of montmorillonite domains (Figs 5 and 6). It also suggested that Mg and Fe were released when montmorillonite transformed into kaolinite. The ICP-AES result showed that the concentrations of Mg and Fe in the supernatant solutions increased with increasing hydrothermal treatment time (Fig. 7), consistent with XRD and FTIR results (Figs 1 and 2).
Results from the present study indicated that Mg and Fe in octahedral sheets were prone to be released from the clay minerals into the surrounding environments under the reaction condition of low pH, consistent with the studies on the natural samples (Dudek et al., Reference Dudek, Cuadros and Fiore2006; Hong et al., Reference Hong, Cheng, Yin, Churchman and Wang2015). Hence, kaolinite with small Mg and Fe contents could be the indicator reflecting the acidic conditions in which kaolinite forms. In the current study, the secondary Mg- and Fe-bearing minerals were not detected because the low pH and Mg and Fe concentrations prevented the precipitation of Mg- and Fe-bearing phases from solution. In addition, water is well known to be absent from the interlayers of kaolinite compared with montmorillonite. Therefore, the kaolinization of montmorillonite could drive some elements (e.g. Mg, Fe, and Si) into geological fluids and promote the release of interlayer water.
Distributions of Mg and Fe in the Octahedral Sheets of Precursor Montmorillonite
The dissolution of 2:1 type phyllosilicates happens mainly at the edges rather than at the basal surfaces under acidic conditions (Rufe & Hochella, Reference Rufe and Hochella1999; Bickmore et al., Reference Bickmore, Bosbach, Hochella, Charlet and Rufe2001). Moreover, a previous study revealed that the transformation mechanism of montmorillonite into kaolinite is probably a local dissolution-recrystallization process which begins mainly at the layer edges, with the complete dissolution of montmorillonite layers occurring within the interstratified kaolinite-montmorillonite (Li et al., Reference Li, He, Tao, Zhu, Tan, Ji, Yang and Zhang2020). Therefore, the relative concentration changes of dissolved Mg and Fe in the supernatant solutions to some extent represented the contents of released Mg and Fe from the completely dissolved montmorillonite layers, and further reflected the distributions of these two ions in the octahedral sheets.
Cations may be distributed either regularly or randomly in the octahedral sheets of montmorillonite (Vantelon et al., Reference Vantelon, Pelletier, Michot, Barres and Thomas2001). Assuming that Mg and Fe are distributed regularly in the original montmorillonite, the relative concentrations of Mg and Fe ions should be fixed during the timescale of the hydrothermal experiments. However, compared with the initial stage of transformation, the relative concentrations of Mg and Fe ions reversed in the final stage. This suggested a random distribution of Mg and/or Fe in the octahedral sheets of the montmorillonite, which was consistent with previous studies (Tsipursky & Drits, Reference Tsipursky and Drits1984; Muller et al., Reference Muller, Besson, Manceau and Drits1997; Vantelon et al., Reference Vantelon, Pelletier, Michot, Barres and Thomas2001).
Conclusions
A batch of hydrothermal experiments of the transformation of montmorillonite into kaolinite under acidic conditions was carried out to investigate the release relationship between Mg and Fe during such processes. The results showed that iron was ferric and occupied mainly the sites in the octahedral sheets of precursor montmorillonite, which was gradually and nearly simultaneously released along with Mg in the octahedral sheets into solution during the transformation. The concentrations of Mg and Fe ions in the supernatant solutions after hydrothermal reactions indicated that the release rates of Mg and Fe were fast in the initial and final stages but very slow in the intermediate stage. The change in relative concentrations of Mg and Fe ions from initial to final stages suggested that Mg and/or Fe were distributed randomly in the octahedral sheets of the montmorillonite. The insights obtained from this study are helpful in understanding better the release relationship between Mg and Fe during clay-mineral evolution, the distributions of these two elements in the octahedral sheets, and the chemical compositions of clay minerals as indicators of the geological environments.
Acknowledgments
The authors sincerely thank the editor-in-chief, associate editor, and the three anonymous reviewers for their valuable comments and suggestions. This work was supported financially by National Key R&D Program of China (Grant No. 2017YFC0602306), National Natural Science Foundation of China (Grant Nos. 41921003, 41825003, and 41772039), Youth Innovation Promotion Association CAS (Grant No. 2018387), the Department of Science and Technology of Guangdong Province (Grant No. 2017GC010128), and Science and Technology Planning Project of Guangdong Province, China (2020B1212060055).
Funding
Funding sources are as stated in the Acknowledgments.
Declarations
Conflict of Interest
The authors declare that they have no conflict of interest.


