Hostname: page-component-cd9895bd7-hc48f Total loading time: 0 Render date: 2024-12-28T16:25:31.046Z Has data issue: false hasContentIssue false

Flow-induced vibration of two tandem square cylinders at low Reynolds number: transitions among vortex-induced vibration, biased oscillation and galloping

Published online by Cambridge University Press:  30 April 2024
Cheng Zhang
Affiliation:
School of Marine Science and Engineering, South China University of Technology, Guangzhou 511442, PR China
Guoqiang Tang*
Affiliation:
State Key Laboratory of Coastal and Offshore Engineering, Dalian University of Technology, Dalian 116024, PR China
Lin Lu
Affiliation:
State Key Laboratory of Coastal and Offshore Engineering, Dalian University of Technology, Dalian 116024, PR China
Yan Jin
Affiliation:
State Key Laboratory of Coastal and Offshore Engineering, Dalian University of Technology, Dalian 116024, PR China
Hongwei An
Affiliation:
School of Engineering, The University of Western Australia, 35 Stirling Highway, Crawley, WA 6009, Australia
Liang Cheng
Affiliation:
School of Marine Science and Engineering, South China University of Technology, Guangzhou 511442, PR China
*
Email address for correspondence: [email protected]

Abstract

The flow-induced vibrations (FIVs) of two identical tandem square cylinders with mass ratio m* = 3.5 at Reynolds number Re = 150 are investigated through two-dimensional direct numerical simulation (DNS) and linear stability analysis over a parameter range of spacing ratio 1.5 ≤ L* ≤ 5 and reduced velocity 3 ≤ Ur ≤ 34. Three kinds of FIV responses, namely vortex-induced vibration (VIV), biased oscillation (BO) and galloping (GA), are identified. The FIVs are then further classified into the branches of initial VIV (IV), resonant VIV (RV and RV′), flutter-induced VIV (FV), desynchronized VIV (DV), VIV developing from GA (GV), transitional state between VIV and GA (TR), BO and GA based on the characteristics of the vibration responses. The transitions among different FIV branches are examined by combining the DNS with linear stability analysis, where the transition boundaries among the VIV, BO and GA branches over the concerned parameters are identified on the branch maps. The transition from IV to RV or RV′ is found to be related to the unstable wake mode, while the FV, transiting from RV or RV′, is induced by the unstable structural factor in the wake-structure mode. The structural instability is considered as the physical origin of GA, whereas the mode competition between unstable wake and structure leads to DV, GV and TR, and thus delays the appearance of GA. The transition from DV to BO with biased equilibrium position, accompanied by the even-order harmonic frequencies, is essentially induced by the symmetry breaking bifurcation.

Type
JFM Papers
Copyright
© The Author(s), 2024. Published by Cambridge University Press

1. Introduction

Flow-induced vibrations (FIVs) of flexibly mounted cylinders, such as vortex-induced vibrations (VIVs), galloping and wave-induced vibrations, have attracted growing research interests due to their relevance in practical engineering applications (Naudascher & Rockwell Reference Naudascher and Rockwell1994; Nepali et al. Reference Nepali, Ping, Han, Zhou, Yang, Tu, Zhao and Bao2020). FIVs can be either hazardous or beneficial. For example, FIVs can induce fatigue damage to flexible slender structures on one hand and they can be used to harvest wave energy on the other. Therefore, a sound understanding of FIVs of various structures is important for engineering applications. Significant research efforts have been devoted to revealing the physics behind various types of FIVs of a single cylinder (Sarpkaya Reference Sarpkaya2004; Williamson & Govardhan Reference Williamson and Govardhan2004; Singh & Mittal Reference Singh and Mittal2005; Sumer Reference Sumer2006; Bearman Reference Bearman2011; Griffith et al. Reference Griffith, Jacono, Sheridan and Leontini2017).

Two particular FIV phenomena, vortex-induced vibration (VIV) and galloping, have received considerable attention for their ubiquity in fluid flows around elastically mounted structures. The VIV is a phenomenon where the vibration is induced by vortex shedding from the structure. The galloping refers to a phenomenon where the structure undergoes vibrations in the direction of hydrodynamic forces acting on it. Galloping vibrations often arise under the conditions where flow asymmetry occurs either due to cross-section shape of the structure or multiple structures in close proximity. Galloping is characterized by significantly larger amplitude and smaller frequency than their VIV counterparts (Blevins Reference Blevins1990; Zhao et al. Reference Zhao, Leontini, Jacono and Sheridan2014). The vibration responses and flow patterns of VIV and galloping of a single cylinder are primarily governed by Reynolds number (Re = UD/ν), mass ratio (m* = ms/mw) and reduced velocity (Ur = U/fnD), where U is the incoming flow velocity, ν is the kinematic viscosity of the fluid, D is the characteristic scale of the cylinder (e.g. the diameter for a circular cylinder or the edge length for a square cylinder), ms is the mass per unit length of the cylinder, mw is the corresponding mass of displaced fluid and fn is the natural frequency of the structure.

Flow around multiple cylinders is more complex than its single-cylinder counterpart, where the wakes of the cylinders interfere with each other and induce abundant FIV responses, such as wake-induced galloping and wake-induced vibration, as well as combined VIV-galloping and biased oscillation with a deflected equilibrium position (Assi et al. Reference Assi, Meneghini, Aranha, Bearman and Casaprima2006; Papaioannou et al. Reference Papaioannou, Yue, Triantafyllou and Karniadakis2008; Carmo et al. Reference Carmo, Sherwin, Bearman and Willden2011; Zhao Reference Zhao2013; Qin, Alam & Zhou Reference Qin, Alam and Zhou2017). The configuration of two tandem cylinders in the flow direction is considered as the simplest configuration of the multiple cylindrical structures. Apart from the governing parameters for FIV of a single cylinder described above, the flow around two tandem cylinders is also dependent on the spacing ratio (L* = L/D), where L is the centre-to-centre spacing between the two cylinders.

Substantial insights into FIVs of two tandem circular cylinders have been achieved, which are helpful to revel the vibration mechanism of tandem square cylinders. Borazjani & Sotiropoulos (Reference Borazjani and Sotiropoulos2009) classified the FIVs of two tandem circular cylinders into two regimes at Re = 200 with a critical Ur value of 5 that separates the two regimes. In Regime 1 (Ur < 5), the front cylinder oscillates with a larger amplitude than that of the rear one, while the opposite is true in Regime 2. Lin, Jiang & Ku (Reference Lin, Jiang and Ku2014) numerically studied the VIV of two elastically mounted circular cylinders in tandem at Re = 5–100, Ur = 4–10, L* = 1.1–4 and m* = 0.5–4. They found a biased and asymmetric oscillation regime with the mean position of the downstream cylinder shifting from zero to either the positive side or negative side randomly, mainly occurring in the region of subcritical Re (Re ≤ 47) and large Ur with a low m*. Such biased oscillation was also reported by Zhao et al. (Reference Zhao, Kaja, Xiang and Cheng2016) in the study on VIV of four rigidly connected cylinders and Lu et al. (Reference Lu, Guo, Tang, Liu, Chen and Xie2016) for the flow-induced rotary oscillation of a circular cylinder with a rigid splitter plate. They attributed the occurrence of the biased oscillation to the symmetry breaking of the wake flow evolution.

Studies on FIVs of two tandem square cylinders have gained momentum in recent years. The existing studies on FIVs of two tandem square cylinders are summarized in table 1. So far, most of the existing studies on FIVs of two tandem cylinders have been concerned with the scenario where the upstream cylinder is fixed (Zhao et al. Reference Zhao, Pillalamarri, Mysa and Jaiman2015; Jaiman, Pillalamarri & Zhao Reference Jaiman, Pillalamarri and Zhao2016; Bhatt & Alam Reference Bhatt and Alam2018; Han et al. Reference Han, Zhou, Malla, Nepali, Kushwaha, Li, Kwok, Tu and Bao2018; Yao & Jaiman Reference Yao and Jaiman2019; Tamimi et al. Reference Tamimi, Esfehani, Zeinoddini, Naeeni, Wu and Shahvaghar-Asl2020). It was found that the wake of the upstream cylinder has a significant effect on the response of the downstream cylinder. For example, Zhao et al. (Reference Zhao, Pillalamarri, Mysa and Jaiman2015) found that the shift of the stagnation point on the downstream cylinder, induced by the vortex shedding from the upstream cylinder, is responsible for the large-amplitude vibration of the downstream cylinder. Bhatt & Alam (Reference Bhatt and Alam2018) affirmed the significant role that the gap flow played in the vibration response of the downstream cylinder. The effect of Re on the wake-induced vibration of downstream square cylinder was examined by Han et al. (Reference Han, Zhou, Malla, Nepali, Kushwaha, Li, Kwok, Tu and Bao2018), who observed that the wake behind an upstream square cylinder induces the dual-resonance phenomenon on the downstream square cylinder, appearing as two amplitude peaks versus Ur, when Re is larger than 120. Yao & Jaiman (Reference Yao and Jaiman2019), through both direct numerical simulation (DNS) and stability analysis, found that the sharp corner of square cylinder has a stabilizing effect on the vibration of downstream cylinder.

Table 1. Summary of the studies on FIV of two tandem square cylinders. Exp., experiment; Num., numerical simulation; SA., stability analysis.

The FIV response of two flexibly mounted tandem square cylinders is expected to be more complex than its counterpart with a fixed upstream square cylinder, due to the coupled interaction of two vibrating cylinders. It has not been studied as extensively as its counterpart with a fixed upstream square cylinder. By considering the vibration of upstream cylinder, Nepali et al. (Reference Nepali, Ping, Han, Zhou, Yang, Tu, Zhao and Bao2020) numerically investigated the effects of Re and Ur on the VIV of two tandem square cylinders. They found that while low-frequency oscillation is a feature response of the downstream cylinder over a wider range of Ur, it only becomes obvious at large values of Re and Ur for the upstream cylinder. Kumar & Sen (Reference Kumar and Sen2021) investigated the response branches and the hysteresis of lock-in response of two vibrating tandem square cylinders in the co-shedding flow regime. They found that the response comprises a desynchronization branch and a lower branch, and the downstream cylinder undergoes high-amplitude vibrations over the entire lower branch due to the excitation of vortex shedding from the upstream cylinder. The vibrations of the two tandem cylinders are observed to be hysteretic at the lower and upper lock-in boundaries, whereas for a single square cylinder, hysteresis is identified only near the onset of lock-in. Notably, depending on the L*, the flow around two cylinders is basically classified into three regimes (Zdravkovich Reference Zdravkovich1987): (i) the overshoot flow regime that occurred at L* = 1.0–1.5, where the shear layers of the upstream cylinder overshoot past the downstream cylinder; (ii) the reattachment flow regime that appeared at L* = 1.5–4.0 with the separated shear layers reattaching on the downstream cylinder; (iii) the co-shedding flow regime at L* > 4.0, where the vortex streets appeared behind both upstream and downstream cylinders. Apart from the work of Kumar & Sen (Reference Kumar and Sen2021) in the co-shedding flow regime, the understanding of the FIV mechanisms and responses of two tandem square cylinders in other flow regimes remains insufficient.

Despite of the considerable insights into the FIV responses of two flexibly mounted tandem square cylinders achieved so far, the topic has not been systematically studied. The studies reported so far were mainly concerned with conditions where Ur is less than 15.0. Based on the knowledge gained through studies on two flexibly mounted tandem circular cylinders, diverse FIV response branches were found at Ur > 15.0. For example, the FIV response at Ur < 15.0 for tandem circular cylinders is mainly dominated by VIV, whereas galloping response dominates at Ur > 15.0. Lin et al. (Reference Lin, Jiang and Ku2014) found a biased oscillation branch at large Ur values within certain Re, L* and m* ranges for two elastically mounted circular cylinders in tandem. It is unclear if our understanding gained through two flexibly mounted tandem circular cylinders is applicable to its square cylinder counterpart. There remain many uncovered issues for two flexibly mounted tandem square cylinders, such as the following. (i) What are the characteristics of FIV responses over a wide range of governing parameters? (ii) Would the biased oscillation occur for tandem square cylinders? (iii) What would be the features of transition between different response branches and their dependence on Ur and L*? (iv) What are the physical mechanisms behind different types of FIV responses?

In addition to the physical experiments and computational fluid dynamics (CFD), stability analysis has been demonstrated to be a powerful method to uncover physics behind complex physical processes. A limited number of studies (Crouch, Garbaruk & Magidov Reference Crouch, Garbaruk and Magidov2007; Leontini, Thompson & Hourigan Reference Leontini, Thompson and Hourigan2010) conducted global linear stability analysis to determine the critical Re for the onset of VIV. More recently, system identification methods have been employed to establish reduced-order models (ROMs) for unsteady flows. When a ROM is coupled with structural motion equations, we can get an efficient flow–structure interaction (FSI) model to investigate fundamental physics behind complex physical systems. For example, Li et al. (Reference Li, Lyu, Kou and Zhang2019) uncovered the unstable flow modes that lead to VIV and galloping responses through ROM-based linear stability analysis. Zhang et al. (Reference Zhang, Li, Ye and Jiang2015) classified the VIV ‘lock-in’ of a circular cylinder into ‘resonance-induced lock-in’ and ‘flutter-induced lock-in’, and explained their physical origins at Re = 60 by discussing the wake mode and structure mode through ROM-based linear stability analysis. Li et al. (Reference Li, Lyu, Kou and Zhang2019) further investigated the mode competition between wake mode and structure mode in the galloping response branch of a square cylinder through ROM-based linear stability analysis and numerical simulations. They found that the instability of the structure mode is the primary cause of galloping phenomenon, and the critical Ur for galloping obtained by linear stability analysis is significantly lower than that obtained through numerical simulations due to the competition between wake mode and structure mode. In terms of the VIV of the downstream cylinder, Yao & Jaiman (Reference Yao and Jaiman2019) compared the stability mechanisms of wake-induced vibration between circular and square cylinders by employing the linear stability analysis based on the ROM and eigensystem realization algorithm. They concluded that a persistently unstable eigenvalue branch sustains wake-induced vibration, which confirms the linear origin of a highly nonlinear wake-induced vibration. The critical Ur to excite the large-amplitude vibration of a downstream square cylinder is found to be larger than its circular cylinder counterpart, and the cross-flow response and force of the square cylinder are smaller than their counterparts of the circular cylinder. The above studies have affirmed that the evolution mechanisms and origins of different types of FIVs could be better examined through the ROM-based linear stability analysis. It would be highly beneficial to the FSI community to explore if ROM-based linear stability analysis would also be a useful quantitative method to uncover physics behind two flexibly mounted tandem square cylinders.

The present study aims to reveal the underlying physics behind FIV responses of two identical tandem square cylinders vibrating in the cross-flow direction at Re = 150 and m* = 3.5 through DNS and ROM-based linear stability analysis. Particularly, a detailed discussion on diversified results involving vibration amplitudes, frequencies, phase differences, eigenvalues etc., over a wide range of Ur = 3.0–34.0 and L* = 1.5–5.0 is performed to provide clear insights on the response branches, transition mechanisms and physical origins of VIV, biased oscillation and galloping. The remainder of the paper is organized as following. The governing equations, problem description and numerical verification are presented in § 2. The ROM-based linear stability analysis and its validation are briefly described in § 3. Results are presented and discussed in § 4, where the FIV responses and branch transitions at L* = 5 and 2.5 are discussed first, followed by discussions on the response distribution and branch map over full parameter space. Finally, major conclusions are drawn in § 5.

2. Numerical method for CFD simulation

2.1. Governing equations

The numerical simulations for two elastically mounted tandem square cylinders are carried out by solving the dimensionless continuity and the Navier–Stokes equations for incompressible flow from the arbitrary Lagrangian–Eulerian (ALE) point of view, which means all of the variables in the present study are in normalized forms. The governing equations for the flow are expressed as

(2.1a)\begin{gather}\frac{{\partial {u_i}}}{{\partial {x_i}}} = 0,\end{gather}
(2.1b)\begin{gather}\frac{{\partial {u_i}}}{{\partial t}} + ({u_j} - u_j^m)\frac{{\partial {u_i}}}{{\partial {x_\textrm{j}}}} ={-} \frac{{\partial p}}{{\partial {x_i}}} + \frac{1}{{Re}}\frac{\partial }{{\partial {x_j}}}\frac{{\partial {u_i}}}{{\partial {x_j}}},\quad (i,j = 1,2),\end{gather}

where xi = (x 1, x 2) = (x, y) are the Cartesian coordinates, ui is the ith velocity component corresponding to the coordinate xi, $u_j^m$ is the advection velocity due to mesh deformation in the ALE method, p is the pressure and t is the time. The Navier–Stokes equations are discretized and solved by the characteristic-based-split (CBS) finite-element method (Zienkiewicz & Codina Reference Zienkiewicz and Codina1995),

(2.2)\begin{equation}\begin{array}{r@{\ }c@{\ }l} u_i^{n + 1} - u_i^n & =& \varDelta t{\left( { - {c_j}\dfrac{{\partial {u_i}}}{{\partial {x_\textrm{j}}}} + \dfrac{1}{{Re}}\dfrac{{{\partial^2}{u_i}}}{{\partial {x_j}^2}}} \right)^n} - \varDelta t\dfrac{{\partial {p^{n + {\theta _2}}}}}{{\partial {x_i}}} + \dfrac{{\varDelta {t^2}}}{2}c_k^n\dfrac{\partial }{{\partial {x_k}}}{\left( {{c_j}\dfrac{{\partial {u_i}}}{{\partial {x_\textrm{j}}}} - \dfrac{1}{{Re}}\dfrac{{{\partial^2}{u_i}}}{{\partial {x_j}^2}}} \right)^n}\\[10pt] &&+ \dfrac{{\varDelta {t^2}}}{2}u_k^n\dfrac{\partial }{{\partial {x_k}}}\left( {\dfrac{{\partial {p^{n + {\theta_2}}}}}{{\partial {x_i}}}} \right), \end{array}\end{equation}

where Δt = tn +1 − tn is the time increment, n denotes the step number, ${c_j} = {u_j} - u_j^m$ and the subscript k denotes the Einstein notation. The pressure is calculated by

(2.3)\begin{equation}\frac{{\partial {p^{n + {\theta _2}}}}}{{\partial {x_i}}} = (1 - {\theta _2})\frac{{\partial {p^n}}}{{\partial {x_i}}} + {\theta _2}\frac{{\partial {p^{n + 1}}}}{{\partial {x_i}}},\end{equation}

where 0 ≤ θ 2 ≤ 1 is the control factor for the explicit and implicit algorithms. Equation (2.2) is processed separately by Zienkiewicz et al. (Reference Zienkiewicz, Nithiarasu, Codina, Vazquez and Ortiz1999):

(2.4a)\begin{gather}\Delta u_i^\ast= u_i^\ast- u_i^n = \Delta t{\left( { - {c_j}\frac{{\partial {u_i}}}{{\partial {x_j}}} + \frac{1}{{Re}}\frac{{{\partial^2}{u_i}}}{{\partial {x_j}^2}}} \right)^n} + \frac{{\Delta {t^2}}}{2}c_k^n\frac{\partial }{{\partial {x_k}}}{\left( {{c_j}\frac{{\partial {u_i}}}{{\partial {x_j}}}} \right)^n},\end{gather}
(2.4b)\begin{gather}{\theta _1}\left[ {(1 - {\theta_2})\frac{{\partial {p^n}}}{{\partial {x_i}}} + {\theta_2}\frac{{\partial {p^{n + 1}}}}{{\partial {x_i}}}} \right] ={-} \frac{1}{{\varDelta t}}\left( {\frac{{\partial u_i^n}}{{\partial {x_i}}} + {\theta_1}\frac{{\partial \varDelta u_i^\ast }}{{\partial {x_i}}}} \right),\end{gather}
(2.4c)\begin{gather}\varDelta u_i^{{\ast}{\ast} } ={-} \varDelta t\frac{{\partial {p^{n + {\theta _2}}}}}{{\partial {x_i}}} + \frac{{\varDelta {t^2}}}{2}u_k^n\frac{{{\partial ^2}{p^n}}}{{\partial {x_k}\partial {x_i}}},\end{gather}

where $u_i^\ast $ and $u_i^{{\ast}{\ast} }$ are the intermediate velocities, and θ 1 is the stability factor with a range of 0.5–1 (Zienkiewicz et al. Reference Zienkiewicz, Nithiarasu, Codina, Vazquez and Ortiz1999). The fluid velocity at the (n + 1)th time step can be obtained

(2.5)\begin{equation}u_i^{n + 1} = u_i^n + \varDelta u_i^\ast+ \varDelta u_i^{{\ast}{\ast} }.\end{equation}

The spatial discretization for (2.1) is performed by using the standard Galerkin finite-element method, and the details can be found from Sun et al. (Reference Sun, Zhang and Ren2012).

The horizontal and vertical fluid forces on a square cylinder, denoted by Fx(t) and Fy(t), are obtained by integrating the instantaneous pressure and shear stress along the surface of the square cylinder. The corresponding drag and lift coefficients, represented by CD(t) and CL(t), respectively, for each square cylinder are defined as

(2.6a,b)\begin{equation}{C_D}(t) = \frac{{2{F_x}(t)}}{{\rho D{U^2}}}\quad \textrm{and}\quad {C_L}(t) = \frac{{2{F_y}(t)}}{{\rho D{U^2}}},\end{equation}

where ρ is the fluid density.

The tandem square cylinders are allowed to oscillate independently and only in the cross-flow direction. The governing equation for each oscillating square cylinder is described by

(2.7)\begin{equation}\ddot{Y} + \frac{{4{\rm \pi} \xi }}{{{U_r}}}\dot{Y} + {\left( {\frac{{2{\rm \pi} }}{{{U_r}}}} \right)^2}Y = \frac{{2{C_L}}}{{{\rm \pi} {m^\ast }}},\end{equation}

where Y, and Ÿ are the dimensionless displacement, velocity and acceleration of the square cylinder, respectively, and ξ = 0.5cs/(ksms)1/2 is the structural damping ratio, where cs and ks denote damping coefficient and spring stiffness, respectively. The natural frequency for each square cylinder is defined as fn = (ks/ms)1/2/(2${\rm \pi}$), which is related to the reduced velocity Ur. The governing equation for the motion of each square cylinder is solved by the Newmark-β method.

Under the ALE description, the nodal coordinates inside the computational domain are updated to reflect the vibrations of the square cylinders after each computational time step. The mesh update in the present study is achieved by employing the edge spring method introduced by Hwang et al. (Reference Hwang, Yang and Sun2003), which has been applied and validated in our previous study (Lu et al. Reference Lu, Guo, Tang, Liu, Chen and Xie2016). In the computations, the displacements and velocities of the grids on the surface of the square cylinders are obtained from the solutions of (2.7) while the grids are kept fixed on the outer boundaries of the computational domain.

2.2. Problem description, mesh dependency check and numerical validation

2.2.1. Problem description

The computational domain and the setup of the tandem square cylinders, together with the boundary conditions, are shown in figure 1. In the following discussion, UC and DC are used to denote the upstream and downstream square cylinders, respectively. The computational domain, whose coordinate origin locates at the centre of UC, is 90D in the in-line direction and 60D in the cross-flow direction. This leads to a blockage ratio of 0.017, defined as the ratio of the side length of the square cylinder to the width of the computational domain. Prasanth & Mittal (Reference Prasanth and Mittal2008) suggested that the effects of the side boundary on the numerical results are notable only if the blockage ratio is larger than 0.05. Hence, the present blockage ratio is believed to be small enough to ensure a weak influence on the numerical results, which will be demonstrated quantitively in the further mesh dependency study. On the inlet boundary, the velocity is set to (u, v) = (U, 0). A no-slip boundary condition is specified on the surface of the square cylinders. At the outlet, the pressure is set to zero and the gradient of the velocity in the flow direction is zero. The gradient of the pressure and the velocity in the transverse direction are zero for the two lateral boundaries. All the computations are initiated with u = v = 0 and p = 0.

Figure 1. A sketch of computational domain and boundary conditions.

The range of spacing ratio L* is set to be 1.5–5 in the present study, mainly covering the reattachment and co-shedding flow branches reported by Zdravkovich (Reference Zdravkovich1987). The Re is fixed at 150 since the galloping for a square cylinder in the two-dimensional laminar flow could be excited in this scenario (Sen & Mittal Reference Sen and Mittal2015). The m* and ξ for both the square cylinders are 3.5 and 0, respectively, to obtain notable vibrations. The reduced velocity Ur ranges from 3 to 34.

2.2.2. Mesh dependency check

The mesh convergence tests were carried out for the flow over the two tandem square cylinders vibrating in the cross-flow direction at Re = 150, where Ur = 5.5 and 34 are chosen at L* = 5 and 2.5, respectively. The block ratio B* defined as the ratio of D to inlet length of computational domain, the number of nodes around each square cylinder Ns, the height of the first layer of meshes next to the cylinder surface Hf and the time step Δt are set to different values to construct 18 meshes. Figure 2 illustrates a typical medium mesh with B* = 0.017, Ns = 200, Hf = 0.008 D and Δt = 0.001, and a close-up view of the mesh around the square cylinders at L* = 5. The detailed parameters for different mesh schemes and the calculated vibration responses as well as hydrodynamic coefficients at L* = 5 and 2.5 are listed in table 2.

Figure 2. Mesh distribution of the computational domain and a close-up view near two tandem square cylinders at L  = 5.

Table 2. Influence of the mesh parameters on vibration responses and hydrodynamic coefficients of the tandem square cylinders with L* = 5 and 2.5 at Re = 150: Nel represents the element number; Ay 1 and Ay 2, normalized by dividing D, are maximum vibration amplitudes of DC and UC, respectively; fy 1 and fy 2 are the corresponding normalized primary frequencies by U/D; and $C_{L1}^{rms}$ and $C_{L2}^{rms}$ are the corresponding root-mean-square (r.m.s.) lift coefficients.

The results of the mesh-dependence check in table 2 show that the response amplitudes Ay 1 and Ay 2 are the most sensitive physical quantities to the variations of B*, Ns, Hf and Δt. The largest differences of Ay 1 and Ay 2 induced by the variations of B*, Ns, Hf and Δt are 4.49 % and 3.43 %, respectively. The results obtained by employing the medium meshes are very close to those of the finest mesh. The maximum relative difference between the results generated by the medium and fine meshes is 1.5 %. Given the large number of simulations to be performed in the present study, the meshes, shown in bold in table 2, are used for the remaining simulations presented in this study.

2.2.3. Numerical validation

The present DNS model is benchmarked first against available results reported in the literature for a single square cylinder undergoing two-degree-of-freedom VIV with m* = 3 and ξ = 0 at Re = 100 and Ur = 3–16. The calculated results versus Ur, involving the cross-flow amplitude and frequency, are compared with those from Zhao, Cheng & Zhou (Reference Zhao, Cheng and Zhou2013), Jaiman et al. (Reference Jaiman, Pillalamarri and Zhao2016) and Qiu et al. (Reference Qiu, Lin, Du and Zhao2021b), as shown in figure 3.

Figure 3. Comparison of the VIV results of a square cylinder with m* = 3 and ξ = 0 at Re = 100. The upper and lower subgraphs are the dimensionless cross-flow amplitude and frequency, respectively.

The predicted values of Ay and fy by the present DNS are in good agreement with the results reported in the literature, as shown in figure 3, demonstrating the good accuracy of the present DNS. The maximum response amplitude occurs at Ur ≈ 5, where the largest deviation of the response frequency f 0 from the vortex shedding frequency fst occurs. The three response branches labelled in different colours in figure 3, namely initial branch (IB), lower branch (LB) and desynchronized branch (DB), are identified through comparing fst and f 0 with the criteria of fst < f 0 corresponding to IB, fst > f 0 corresponding to LB, and fst ≈ f 0 corresponding to DB. The same classification criteria are used for two tandem cylinders in the present study.

The present DNS model is further validated via the cross-flow and in-line FIVs of two identical tandem circular cylinders with m* = 10, ξ = 0.01, L* = 2.5 and 5, Re = 160, and Ur = 3.3–10. The predicted maximum vibration amplitudes in the cross-flow and in-line directions Ur = 3.3–10 are compared with the results reported by Papaioannou et al. (Reference Papaioannou, Yue, Triantafyllou and Karniadakis2008) in figure 4. Excellent agreements between the present results and those reported by Papaioannou et al. (Reference Papaioannou, Yue, Triantafyllou and Karniadakis2008) are observed, demonstrating the validity of the present DNS model.

Figure 4. Comparison of the cross-flow and in-line maximum vibration amplitudes versus Ur at Re = 160 and L* = 2.5 and 5: (a,b) cross-flow and in-line vibration amplitudes of downstream circular cylinder, respectively; (c,d) counterparts of upstream circular cylinder.

3. Linear stability analysis method based on reduced-order model

3.1. Reduced-order model for the unsteady flow

The ROMs have been demonstrated to be effective and efficient in understanding the physics involved in the FSI system. The ROM for steady approaching flow past two tandem square cylinders under forced vibrations in the cross-flow direction is developed here. A system identification method, applying the autoregressive exogenous model (ARX) to train the transformation matrix for generating the targeted lift coefficient via the input displacement, is adopted for the reduced-order model (Zhang et al. Reference Zhang, Li, Ye and Jiang2015; Li et al. Reference Li, Lyu, Kou and Zhang2019). The ARX based on a linear input-output system is described by

(3.1)\begin{equation}{\boldsymbol{y}_F}(h) = \sum\limits_{i = 1}^{na} {{\boldsymbol{\mathsf{A}}_i}{\boldsymbol{y}_F}(h - i)} + \sum\limits_{i = 0}^{nb - 1} {{\boldsymbol{\mathsf{B}}_i}{\boldsymbol{u}_F}(h - i)} ,\end{equation}

where yF = [CL 1 CL 2]T is the output vector of the system, uF = [Y 1 Y 2]T is the input counterpart, h denotes the number of the discrete time step, $\boldsymbol{\mathsf{A}}_i$ and $\boldsymbol{\mathsf{B}}_i$ are the coefficient matrices to be estimated, and na and nb are the model delay orders, respectively. The subscripts 1 and 2 represent the DC and UC, respectively, in CL 1 and CL 2 as well as Y 1 and Y 2.

A state vector xF(h) with 2(na + nb − 1) dimensions is defined as

(3.2)\begin{equation}{\boldsymbol{x}_F}(h) = {[{\boldsymbol{y}_F}(h - 1), \ldots ,{\boldsymbol{y}_F}(h - na),{\boldsymbol{u}_F}(h - 1), \ldots ,{\boldsymbol{u}_F}(h - nb + 1)]^\textrm{T}}.\end{equation}

By combining (3.2) with (3.1), the state-space equation in the discrete-time form can be written as (Zhang & Ye Reference Zhang and Ye2007; Zhang et al. Reference Zhang, Li, Ye and Jiang2015)

(3.3a)\begin{gather}{\boldsymbol{x}_F}(h + 1) = {\tilde{\boldsymbol{\mathsf{A}}}_F}{\boldsymbol{x}_F}(h) + {\tilde{\boldsymbol{\mathsf{B}}}_F}{\boldsymbol{u}_F}(h),\end{gather}
(3.3b)\begin{gather}{\boldsymbol{y}_F}(h) = {\tilde{\boldsymbol{\mathsf{C}}}_F}{\boldsymbol{x}_F}(h) + {\tilde{\boldsymbol{\mathsf{D}}}_F}{\boldsymbol{u}_F}(h),\end{gather}

where the coefficient matrices read:

(3.4a) \begin{gather}{\tilde{\boldsymbol{\mathsf{A}}}_F} = \left[ {\begin{array}{@{}*{10}{c}@{}} {{\boldsymbol{\mathsf{A}}_1}}&{{\boldsymbol{\mathsf{A}}_2}}& \cdots &{{\boldsymbol{\mathsf{A}}_{na - 1}}}&{{\boldsymbol{\mathsf{A}}_{na}}}&{{\boldsymbol{\mathsf{B}}_1}}&{{\boldsymbol{\mathsf{B}}_2}}& \cdots &{{\boldsymbol{\mathsf{B}}_{nb - 2}}}&{{\boldsymbol{\mathsf{B}}_{nb - 1}}}\\ \boldsymbol{\mathsf{I}}&{\bf 0}& \cdots &{\bf 0}&{\bf 0}&{\bf 0} &{\bf 0}& \cdots &{\bf 0}&{\bf 0}\\ \vdots &\boldsymbol{\mathsf{I}}& \cdots &{\bf 0}&{\bf 0}&{\bf 0}&{\bf 0}& \cdots &{\bf 0}&{\bf 0}\\ \vdots & \vdots & \ddots & \vdots & \vdots & \vdots & \vdots & \ddots & \vdots & \vdots \\ {\bf 0}&{\bf 0}& \cdots &\boldsymbol{\mathsf{I}}&{\bf 0}&{\bf 0} &{\bf 0}& \cdots &{\bf 0}&{\bf 0}\\ {\bf 0}&{\bf 0}& \cdots &{\bf 0}&{\bf 0}&{\bf 0}&{\bf 0}& \cdots &{\bf 0} &{\bf 0}\\ {\bf 0}&{\bf 0}& \cdots &{\bf 0}&{\bf 0}&\boldsymbol{\mathsf{I}}&{\bf 0}& \cdots &{\bf 0}&{\bf 0}\\ {\bf 0}&{\bf 0}& \cdots &{\bf 0}&{\bf 0}&{\bf 0}&\boldsymbol{\mathsf{I}}& \cdots &{\bf 0}&{\bf 0}\\ \vdots & \vdots & \ddots & \vdots & \vdots & \vdots & \vdots & \ddots & \vdots & \vdots \\ {\bf 0}&{\bf 0}& \cdots &{\bf 0}&{\bf 0}&{\bf 0}&{\bf 0}& \cdots &\boldsymbol{\mathsf{I}}&{\bf 0} \end{array}} \right],\end{gather}
(3.4b)\begin{gather}{\tilde{\boldsymbol{\mathsf{B}}}_F} = {[\begin{array}{@{}*{10}{c}@{}} {{{\tilde{\boldsymbol{\mathsf{B}}}}_0}}&{\bf 0}&{\bf 0}& \cdots &{\bf 0}&\boldsymbol{\mathsf{I}}&{\bf 0}&{\bf 0}& \cdots &{\bf 0} \end{array}]^\textrm{T}}\end{gather}
(3.4c)\begin{gather}{\tilde{\boldsymbol{\mathsf{C}}}_F} = [\begin{array}{@{}*{10}{c}@{}} {{\boldsymbol{\mathsf{A}}_1}}&{{\boldsymbol{\mathsf{A}}_2}}& \cdots &{{\boldsymbol{\mathsf{A}}_{na - 1}}}&{{\boldsymbol{\mathsf{A}}_{na}}}&{{\boldsymbol{\mathsf{B}}_1}}&{{\boldsymbol{\mathsf{B}}_2}}& \cdots &{{\boldsymbol{\mathsf{B}}_{nb - 2}}}&{{\boldsymbol{\mathsf{B}}_{nb - 1}}} \end{array}],\end{gather}
(3.4d)\begin{gather}{\tilde{\boldsymbol{\mathsf{D}}}_F} = [{\boldsymbol{\mathsf{B}}_0}].\end{gather}

The sub-coefficient matrices in (3.4) can be obtained by solving (3.3) based on the least square method when the training data of the forced displacements and lift coefficients are provided. Then the discrete-time state-space equation is converted into a continuous-time form:

(3.5a)\begin{gather}{\dot{\boldsymbol{x}}_F}(t) = {\boldsymbol{\mathsf{A}}_F}{\boldsymbol{x}_F}(t) + {\boldsymbol{\mathsf{B}}_F}{\boldsymbol{u}_F}(t),\end{gather}
(3.5b)\begin{gather}{\boldsymbol{y}_F}(t) = {\boldsymbol{\mathsf{C}}_F}{\boldsymbol{x}_F}(t) + {\boldsymbol{\mathsf{D}}_F}{\boldsymbol{u}_F}(t),\end{gather}

where $\boldsymbol{\mathsf{A}}_F$, $\boldsymbol{\mathsf{B}}_F$, $\boldsymbol{\mathsf{C}}_F$ and $\boldsymbol{\mathsf{D}}_F$ are the coefficient matrices in continuous-time forms. The ROM of (3.5) characterizes the variation of the concerned fluid force when the steady base flow is perturbed by a small structural motion. Therefore, the stability characteristics of the flow can be evaluated by analysing the eigenvalues of $\boldsymbol{\mathsf{A}}_F$ in the state-space equation, namely (3.5) (Li et al. Reference Li, Lyu, Kou and Zhang2019).

3.2. Reduced-order model for FSI

To establish the state-space equilibrium equations for the tandem identical square cylinders vibrating in the cross-flow direction, a structure state vector xS = [Y 1, 1, Y 2, 2] is defined and then combined with (2.7), which yields

(3.6a)\begin{gather}{\dot{\boldsymbol{x}}_S}(t) = {\boldsymbol{\mathsf{A}}_S}{\boldsymbol{x}_S}(t) + q{\boldsymbol{\mathsf{B}}_S}{\boldsymbol{y}_F}(t),\end{gather}
(3.6b)\begin{gather}{\boldsymbol{u}_F}(t) = {\boldsymbol{\mathsf{C}}_S}{\boldsymbol{x}_S}(t) + q{\boldsymbol{\mathsf{D}}_S}{\boldsymbol{y}_F}(t),\end{gather}

where $q = 2/{\rm \pi} {m^\ast }$ and the structural coefficient matrices are

(3.7)\begin{equation}\left. {\begin{array}{@{}*{1}{c}@{}} {{\boldsymbol{\mathsf{A}}_S} = \left[ {\begin{array}{@{}*{4}{c}@{}} 0&1&0&0\\ { - \dfrac{{4{{\rm \pi}^2}}}{{U_r^2}}}&{ - \dfrac{{4{\rm \pi} \xi }}{{{U_r}}}}&0&0\\ 0&0&0&1\\ 0&0&{ - \dfrac{{4{{\rm \pi}^2}}}{{U_r^2}}}&{ - \dfrac{{4{\rm \pi} \xi }}{{{U_r}}}} \end{array}} \right],\quad {\boldsymbol{\mathsf{B}}_S} = \left[ {\begin{array}{@{}*{2}{c}@{}} 0&0\\ 1&0\\ 0&0\\ 0&1 \end{array}} \right],}\\[-4pt]\\ {{\boldsymbol{\mathsf{C}}_S} = \left[ {\begin{array}{@{}*{4}{c}@{}} 1&0&0&0\\ 0&0&1&0 \end{array}} \right],\quad {\boldsymbol{\mathsf{D}}_S} = \left[ {\begin{array}{@{}*{2}{c}@{}} 0&0\\ 0&0 \end{array}} \right],} \end{array}} \right\}\end{equation}

By coupling (3.5) and (3.6), the ROM for FSI of the two vibrating tandem square cylinders can be obtained:

(3.8a)\begin{gather}{\dot{\boldsymbol{x}}_{FS}}(t) = \left[ {\begin{array}{@{}*{2}{c}@{}} {{\boldsymbol{\mathsf{A}}_S} + q{\boldsymbol{\mathsf{B}}_S}{\boldsymbol{\mathsf{D}}_F}{\boldsymbol{\mathsf{C}}_S}}&{q{\boldsymbol{\mathsf{B}}_S}{\boldsymbol{\mathsf{C}}_F}}\\ {{\boldsymbol{\mathsf{B}}_F}{\boldsymbol{\mathsf{C}}_S}}&{{\boldsymbol{\mathsf{A}}_F}} \end{array}} \right]{\boldsymbol{x}_{FS}}(t)= {\boldsymbol{\mathsf{A}}_{FS}}{\boldsymbol{x}_{FS}}(t),\end{gather}
(3.8b)\begin{gather}{\boldsymbol{u}_F}(t) = [{\boldsymbol{\mathsf{C}}_S}\quad {\bf 0}]{\boldsymbol{x}_{FS}}(t),\end{gather}

where xFS = [xS xF]T denotes the FSI variables. Similar to the analysing process of fluid stability, the stability issues of the FSI system can be qualitatively described by the eigenvalues of $\boldsymbol{\mathsf{A}}_{FS}$. The eigenvalues are commonly composed of the real part λr and the imaginary part λi that represent the growth rate and angular frequency of the eigenmodes, respectively. The system is unstable if λr > 0.

3.3. Validation on the reduced-order model

The flow past two vibrating tandem square cylinders with L* = 5 at Re = 150 are chosen as an example to validate the ROM and the ROM-based linear stability analysis. The coefficient matrices of fluid, namely $\boldsymbol{\mathsf{A}}_F$, $\boldsymbol{\mathsf{B}}_F$, $\boldsymbol{\mathsf{C}}_F$ and $\boldsymbol{\mathsf{D}}_F$, are obtained through the training for the input of displacements and output of lift coefficients in the steady base flow. The steady base flow represents the linearized flow field in linear stability analysis, while the input displacements are regarded as small perturbations. To generate the steady base flow, DNS of flow past two stationary tandem square cylinders is carried out by setting a symmetry boundary at the central line (y = 0) across the computational domain. The vorticity and pressure of the base flow is shown in figure 5.

Figure 5. Base flow of two stationary tandem cylinders (L* = 5 and Re = 150): (a) vorticity and (b) pressure.

The input of the training signal is the designed cross-flow displacements of the two square cylinders, given as

(3.9)\begin{equation}{\boldsymbol{u}_F}(t) = {A_{y0}}\,\sin (2{\rm \pi} {\omega _0}(1 - {\textrm{e}^{{\boldsymbol{a}_0}t}})t),\end{equation}

where Ay 0 is the amplitude of forced displacements with a value of 10−5, ω 0 = 0.2 is the designed frequency of forced displacements and a0 = [−0.01 −0.012]T is the coefficient vector for the time varying frequency, as shown in (3.9). The small magnitude of Ay 0 ensures small perturbations in the linear stability analysis. The time-varying forced frequency is used to roughly cover the range of the possible frequencies of the vibrating square cylinders, while the different values of time-varying coefficient for UC and DC are designed to consider the phase difference between the displacements of the two square cylinders. The output lift coefficients used for training are obtained through the DNS for flow past the square cylinders forced to vibrate in the form of (3.9), as depicted in figure 6, together with the input displacement signals.

Figure 6. Time-history curves of input and output signals at L* = 5 and Re = 150: (a) forced displacements of two tandem square cylinders; (b) lift coefficients of two tandem square cylinders obtained from DNS and ROM, where the subscripts 1 and 2 denote upstream and downstream cylinders, respectively.

The approach to construct the ROM has been validated for the cases of unsteady flows past a circular cylinder (Zhang et al. Reference Zhang, Li, Ye and Jiang2015), a square cylinder (Li et al. Reference Li, Lyu, Kou and Zhang2019) and two tandem circular cylinders (Li, Zhang & Gao Reference Li, Zhang and Gao2018). To further validate its application for flow past two tandem square cylinders, the identification parameters na and nb for the ROM are chosen as 90 to ensure high resolution, and the ROM-predicted lift coefficients are compared with those from the DNS, as shown in figure 6(b). It is found that the ROM-predicted results agree well with those obtained from DNS, demonstrating the validity of the present ROM in predicting the dominant characteristics of flow past two tandem square cylinders.

The linear stability analysis based on the ROM for the FSI system, focusing on the eigenvalue analysis of AFS in (3.8), is further validated by considering two tandem square cylinders vibrating in the cross-flow direction with m* = 3.5 and ξ = 0. The real and imaginary parts of the eigenvalues for two leading modes of AFS at Ur = 0–20 are plotted as the root loci in figure 7(a), where Ur = 0 represents the case of two stationary tandem square cylinders. The two leading modes of two stationary tandem square cylinders are marked as ST I and ST II in figure 7(a). Li et al. (Reference Li, Lyu, Kou and Zhang2019) defined the root loci as the wake mode (WM) when the imaginary part of the leading eigenvalue of the FSI system, representing the leading eigenfrequency, varies around the counterpart of flow past the stationary structure with increasing Ur, while the structure mode (SM) appears when the eigenfrequency is close to the structural natural frequency. However, the root loci are more frequently affected by WM and SM simultaneously for the oscillating system with a lower mass ratio, classified as the combined mode (CM) or the wake-structure mode (WSM) (Li et al. Reference Li, Lyu, Kou and Zhang2019, Yao & Jaiman Reference Yao and Jaiman2019). The WSM is thus introduced to describe the root loci marked in green in figure 7(a), since their imaginary parts are basically near 0.644i (ST II) initially, and evolute from the left grey plane with negative real parts to the right pink plane with positive real parts following the trend of structural natural frequency (see figure 11b). By contrast, the root loci with blue colour are identified as the WM based on the semi-circle distribution of their imaginary parts near 0.699i (ST I). Several critical values of Ur (e.g. 2, 3.4 and 5.6), located at the boundary of pink plane, are observed, indicating the corresponding mode of the system becomes unstable when the Ur crosses the border to positive real parts of eigenvalues.

Figure 7. Stability analysis for the FSI system of two tandem square cylinders with m* = 3.5 and ξ = 0 at L* = 5 and Re = 150: (a) root loci of the coupled system at Ur = 0–20; (be) DNS-computed cross-flow displacements of the two square cylinders subjected to an impulse velocity response at Ur = 2.5, 4, 6 and 10, respectively.

To validate the results of the linear stability analysis, the FIVs of the tandem square cylinders subjected to an initial small impulse velocity of 10−5 at Ur = 2.5, 4, 6 and 10 are solved through DNS, and the corresponding results are illustrated in figure 7(be), respectively. According to the linear stability analysis, the concerned system at 2 < Ur < 3.4 is stable since λr < 0, which can be verified by the decaying displacements of the two square cylinders obtained from DNS at Ur = 2.5. When Ur = 4, the displacement of UC presents a decaying trend while the DC keeps oscillation, related to the stable WSM and unstable WM in the stability analysis. When Ur = 6 and 10, the displacements of both UC and DC grow with the time, matching with the prediction in linear stability analysis. Meanwhile, it is noted that the displacements become irregular when the value of Ur is in the vicinity of the critical values (e.g. Ur = 4 and 6), caused by the competition between the stable and unstable modes. Overall, the ROM-based linear stability analysis in the present study is effective for laminar flow past two tandem square cylinders vibrating in the cross-flow directions.

4. Results and discussion

4.1. FIV of the tandem square cylinders at L* = 5

4.1.1. Response and hydrodynamic characteristics

The FIV of the tandem square cylinders at L* = 5 and Ur = 3–34 is first investigated to examine the characteristics of vibration response and hydrodynamics in the co-shedding flow regime. The DNS results of the vibration amplitudes, frequency characteristics, wake patterns, force coefficients and phase lags are presented and discussed herein. The displacements and their amplitudes are normalized by D, while the time and frequencies are normalized by D/U and U/D, respectively.

Variations of vibration amplitudes Ay = (Ymax − Ymin)/2, dominant frequencies and mean displacements of the two tandem square cylinders with Ur are shown in figure 8(ac), respectively, where Ymax and Ymin are the maximum and minimum displacements (Zhao et al. Reference Zhao, Cheng and Zhou2013). The corresponding results of a single square cylinder (SC) are also included for the purpose of comparison.

Figure 8. Vibration responses of DC and UC with a companion to that of a single square cylinder at L* = 5: (a) normalized vibration amplitudes; (b) normalized vibration frequencies; and (c) normalized mean positions in the y-direction.

The vibration response of DC is classified into five branches, marked by different background colours in figure 8, based on the characteristics of the variations of amplitude, frequency and mean displacement with Ur. The initial branch of the VIV amplitude, referred to as IV, is observed in the range of Ur = 3–4.5. The VIV response at the IV branch is characterized by the gradual increase and decrease of amplitude and dominant frequency, respectively, near the critical Ur for the onset of VIV. Two large-amplitude response branches of DC observed at Ur = 4.5–6 and Ur = 6–10 are referred to as the resonant VIV (RV) and the flutter-induced VIV (FV) branches, respectively. The maximum response amplitude of the RV is 0.54D at Ur = 5.5 and that of the EV is 0.62D at Ur = 7.5. The dominant frequencies of RV at Ur = 4.5–6 are locked in the vicinity of 0.59fn, which deviates substantially from the commonly known lock-in frequency near fn. Khalak & Williamson (Reference Khalak and Williamson1999) suggested that the lock-in frequency may be much higher or lower than fn for a smaller m . By assuming the simple harmonic forms of fluid force and structural motion, Lu et al. (Reference Lu, Guo, Tang, Liu, Chen and Xie2016) separated the in-phase part of fluid force with motion and defined the natural frequency of the FSI system by considering the effect of this part. The dominant vibration frequencies at Ur = 5 and 5.5 in the present work are found to be equal to the modified natural frequencies of 0.117 and 0.107 by applying this method. Therefore, the first peak of the DC amplitude is induced by the resonance affected by the in-phase part of the lift (Sarpkaya Reference Sarpkaya2004). The second interval of lock-in or near lock-in at Ur = 6–10 with larger vibration amplitude is only observed for DC. Zhang et al. (Reference Zhang, Li, Ye and Jiang2015) divided the general VIV lock-in of a circular cylinder into the resonance-induced and flutter-induced patterns through stability analysis. The appearance of the second large-amplitude branch in the present study is also attributed to the flutter related to structural instability, and it will be further discussed in § 3.1.2.

The desynchronized VIV (DV) is observed at Ur = 10–24 where the vibration frequency follows the variation trend of Strouhal frequency and deviates significantly from the natural frequency fn. The biased oscillation (BO) branch, which is characterized by a biased equilibrium position in either direction y = 0, as shown in figure 8(c), is identified at Ur > 24. The present finding confirms that the BO branch not only occurs in the flow past vibrating tandem circular cylinders (Lin et al. Reference Lin, Jiang and Ku2014), but also arise for tandem square cylinders with low m* and large Ur. The detailed features of the BO branch will be discussed in § 4.1.3.

The vibration amplitude of UC shares a similar trend with SC, except that a BO branch is also observed at the high end of the Ur range investigated in the present study. The amplitude of the UC reaches a peak of 0.36D at Ur = 5.5, in accordance with the first peak of DC. By contrast, the occurrence of the resonant peak for the SC is at Ur = 5, with an amplitude of 0.25D. The overall response amplitudes of both DC and UC are larger than the SC counterparts, while frequency results exhibit a contrary behaviour. The absence of an FV branch from the response of UC suggests the FV branch observed for DC is closely associated with the influence of the wake of UC. This aspect will be elaborated further in § 3.1.2.

In addition to the dominant frequencies of vibration displacement shown above, the other frequency components of vibration displacement and lift coefficient do exist in the system, and they are invaluable to understand the FIV responses of the system. For this reason, the fast Fourier transform (FFT) spectra of the lift coefficients and displacement versus Ur are illustrated in figure 9. At the IV branch, the frequencies of lift coefficient and displacement are characterized by a single dominant component. When entering the RV branch, the intense competition between fluid and structure is reflected by the multiple frequency components of lift coefficient and displacement, especially for DC. The FV branch is only identified for DC, where the frequencies near fn dominate the lift coefficient and displacement, and the triple-harmonic frequencies as well as lower fluid-related modulation frequencies. At the DV branch, the lift coefficient of DC mainly presents the dominant and triple-harmonic frequencies, while an extra frequency component of 0.081 plays a secondary role for the displacement. By contrast, the harmonic frequency components are very weak for both the lift coefficient and displacement of UC. Abundant frequency components are observed at the BO branch of DC, especially for the lift coefficient. Except for the odd-multiple frequency components of 0.142 and 0.428 at Ur = 25, the double and quadruple ones of 0.285 and 0.568 are captured for the lift coefficient. The primary and double secondary frequencies, together with subharmonic frequency components, are observed for the displacement of DC, whose subharmonics coalesce to be a half-harmonic component of 0.071 near Ur = 30. The double-harmonic frequency component also appears in the lift coefficient of UC. The appearances of the even-multiple frequency components are related to the bifurcation of flow evolution and structural motion, whose relationship with the BO will be explained in § 3.1.3.

Figure 9. FFT spectra of lift coefficients and normalized displacements of the two tandem square cylinders at Ur = 3–34 and L* = 5: (a) lift coefficient of DC; (b) displacements of DC; (c) lift coefficient of UC; and (d) displacements of UC.

The r.m.s. and mean lift coefficients (CL-rms and ${\bar{C}_L}$) of the two square cylinders versus Ur are shown in figure 10(a,b). Several dash lines with different colours are plotted to emphasize the results corresponding to the IV, RV, FV, DV and BO branches of DC. The r.m.s. lift coefficients of DC and UC gradually grow with increasing Ur at the IV branch. When entering the RV branch, the CL-rms of DC experiences a sharp decrease at the onset of the lock-in and then grows rapidly with increasing Ur to an equilibrium value, which is different from UC. The multiple-frequency components, as shown in figure 9(a) at Ur = 5, lead to the reduction of CL-rms of DC. In addition, the CL-rms of both DC and UC at the IV and RV branches are significantly greater than those at the FV, DV and BO branches. A slow decline of CL-rms of DC and a slight decrease of the UC counterpart are observed at Ur > 24, along with the deflections of ${\bar{C}_L}$ to randomly positive or negative directions in the BO branch in figure 10(b). The mean phase lags between the displacement and lift coefficient for each square cylinder are shown in figure 10(c). The phase lags are averaged since diverse temporal variations (e.g. phase trapping, phase drifting, etc.) exist in some cases. The mean phase lags between the displacements and lift coefficients are 0 for DC and UC when Ur < 6 in the IV and RV branches, then turn into transitional values near ${\rm \pi}$ at the FV branch, and finally stabilize at ${\rm \pi}$ at the DV and BO branches. The reversal of phase lag from 0 to ${\rm \pi}$ with large vibration amplitude marks the end of the resonant lock-in and the onset of the flutter-induced lock-in. The deviation of phase lag from 0 for DC at Ur = 6 is associated with the transient desynchronization between the lift and displacement during the transition stage.

Figure 10. Statistical results and phase characteristics of lift coefficients at Ur = 3–34 and L* = 5: (a) and (b) r.m.s. and mean lift coefficients of the two square cylinders; and (c) mean phase lags between displacements and lift coefficients of two square cylinders.

4.1.2. Transitions among VIV branches

The transitions among the VIV branches identified for the DC are discussed. The linear stability analysis introduced in § 3 is performed to capture the stability features of the FSI system at different VIV branches. The real and imaginary parts of the eigenvalues of the first two leading modes for the FSI system of two tandem square cylinders at L* = 5 versus Ur are shown in figure 11, together with those of stationary tandem square cylinders (ST I and ST II). The root loci of the eigenvalues are not presented here since they have been depicted in figure 7(a).

Figure 11. Stability results of the FSI system of two tandem square cylinders at Ur = 3–34: (a,b) real and imaginary parts of the eigenvalues corresponding to the first two leading modes, respectively, together with the corresponding values for the stationary tandem square cylinders.

The WM of the FSI system becomes unstable when Ur > 3.4, implying that the vortex shedding from the square cylinder begins to excite the VIV of the cylinders. The WM instability, inherently related to the vortex evolution in the flow field, continuously promotes the development of VIV until the occurrence of resonance between the vortex shedding and the structural vibration near Ur = 5–5.5, namely the transition from IV to RV. During this process, the eigenfrequency of WM in figure 11(b) increases with increasing Ur and is greater than the eigenfrequency of ST II over a range of Ur, whereas the eigenfrequency of WSM varies between ST I and ST II counterparts. When Ur > 5.6, both the WM and the WSM have positive real eigenvalues, and thus become unstable. The eigenfrequency of WM gradually returns to the vicinity of ST II with increasing Ur, indicating that the WM is out of resonance at Ur > 5.6 and is dominated again by the fluid. The eigenfrequency of WSM begins to jump out of the range of ST I and ST II for Ur > 5.6, and shows a trend similar to the variation of fn versus Ur even though the specific values are different due to the linearity assumption of stability analysis. This observation suggests the structural instability characterizes the WSM, causing the flutter-induced vibration with large amplitude, and thus appears as the transition from RV branch to FV branch. In fact, the fluid-elastic instability phenomenon of flutter is also known as galloping in the studies of flow past cylinders (Blevins Reference Blevins1990). Therefore, the second amplitude peak of DC is inherently related to the galloping-type motion. However, the obvious galloping branch of DC is absent with increasing Ur at L* = 5. Li et al. (Reference Li, Lyu, Kou and Zhang2019) attributed the absence of large-amplitude galloping at the stage of structural instability to the competition between the unstable WM and the unstable structure component in WSM, and defined the VIV-type motion as pre-galloping when the wake is the winner. The eigenfrequency of WM in the present study is completely captured by the ST I and ST II for Ur > 10.3, whose competition with structure-dominated WSM reflects the roles of wake and structure. The wining of WM in the mode competition with WSM causes the FV or DV. Once the structure component in WSM is too weak to affect the dominant WM, the transition from FV to DV occurs. The BO is not captured by linear stability analysis since it is induced by the nonlinearity, which will be discussed in the next subsection.

More detailed DNS results of DC at different VIV branches, involving the time-history curves and FFT amplitude spectra of y-displacement and lift coefficient as well as the phase diagram of vibration, are illustrated in figure 12. The Poincaré mapping of the y-displacements and y-velocity of DC is constructed based on the dominant vibration frequency, marked as blue points in figure 12, to classify the vibration behaviours. The vibration is identified as the periodic mode when only one fixed mapping point is captured on the phase diagram, while multiple points correspond to a periodic mode of multiple frequency components. A closed curve comprising mapping points and a patch of dense points with fractal structures on the phase diagram are typical characteristics of quasiperiodic and chaotic vibration modes, respectively.

Figure 12. DNS results of the DC at different VIV branches: (ad) time-history y-displacements and lift coefficients; (eh) FFT amplitude spectra of y-displacements and lift coefficients; and (il) phase diagrams of y-displacements and y-velocities at Ur = 3, 5.5, 7.5 and 16, respectively.

Figure 12(a) shows that the YDC and CL-DC are in phase at Ur = 3 at the IV branch, both dominated by a primary frequency f 0 = 0.125 and accompanied by a tiny triple-harmonic frequency. The periodic oscillation of displacement is relatively limited even though the lift coefficient is large enough at the IV branch. The amplitude of the YDC rises to a level near 0.55 at Ur = 5.5 at the RV branch while the CL-DC is almost consistent with the case of Ur = 3. The resonance promotes the system to achieve larger vibration amplitude at Ur = 5.5. The vibration of DC at Ur = 7.5 at the FV branch becomes more complex in comparison with its counterpart at Ur = 5.5, characterized by a hybrid state of 7-periodic and quasiperiodic modes. In addition to the primary frequency of 0.156, two obvious lower-order and two higher-order harmonics are observed for both the YDC and CL-DC. The irregularity of the vibration is caused by the unstable structural factor in the WSM since the unstable WM mainly affects the regular parts of vibration as evidenced in the results of Ur = 5.5 and 16. The mode competition is reflected in the frequency results at Ur = 16 at the DV branch as well, where unstable WM dictates the vibration again and unstable WSM plays a minor disturbing role, resulting in the weak quasiperiodic feature observed in the phase diagram.

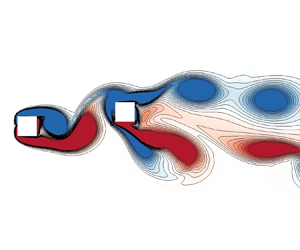
The vorticity fields at Ur = 3, 5.5, 7.5 and 16 are further examined in figure 13. A regular two-raw parallel vortex street is observed at Ur = 3 in figure 13(a), representing the wake pattern of IV. The gap vortices periodically interact with and impinge on the DC, increasing the vibration amplitude of DC. At Ur = 5.5, the wake of the square cylinders at the RV branch is still characterized by the parallel vortex street, while the vortex street tends to be unstable in the far-wake region. The ‘P + S' wake mode, appearing as the combination of a pair of vortices and a single vortex during a vibration cycle, is observed in the near-wake region at Ur = 7.5. The unstable WM and WSM in FV intensify the interaction and coalescence among vortices, and induce the multiple frequency components in the lift spectrum. The wake re-appears as the two-raw parallel vortex street in near-wake field and the coalesced secondary vortex street in the far-wake field at Ur = 16. The other frequency components, in addition to the primary vortex shedding frequency, are likely induced by the secondary vortex street.

Figure 13. Vorticity fields of the two tandem square cylinders at different VIV branches: (ad) Ur = 3, 5.5, 7.5 and 16, respectively.

4.1.3. Transition from VIV to biased oscillation

The transition from VIV to BO, observed when Ur > 24 at L* = 5 in the present study, is discussed by evaluating the effect of the higher-order harmonics. The case of Ur = 27 is chosen as an example, whose time-history y-displacement and lift coefficient, FFT spectra within different time stages, and phase diagram are shown in figure 14.

Figure 14. DNS results of the DC at the BO branch when Ur = 27: (a,d) time-history y-displacement and lift coefficient, respectively; (ce) FFT amplitude spectra of y-displacement and lift coefficient at Stages II, III and IV, respectively; and (f) phase diagrams of y-displacement and y-velocity at Stage IV.

The evolution processes of y-displacement and lift coefficient in figure 14(a,b) are classified into four stages, where stage I is in an initially developing state, stage II tends to be a quasi-stable oscillation with its mean value being around zero, stage III presents the varying process of gradual deflection and stage IV appears as a final oscillating state at the biased equilibrium position. Stage II can be regarded as a VIV-type oscillation, developing through stage III and transforming to be BO at stage IV eventually. The FFT is performed for both the y-displacement and lift coefficient at the four stages to reveal the variation of frequency components during the transition from VIV to BO. It is observed that the primary frequency f 0 = 0.144 dominates the Y and CL at stage II, slightly modulated by the 3f 0 and 5f 0 for CL and the 3f 0 for Y. When entering stage III, the f 0 changes to be 0.141 and the even-order harmonic frequencies are captured in addition to the odd-order ones, especially for CL. Alternate odd-order and even-order frequencies appear in stage IV, with the decreasing amplitudes for the higher orders. It is assumed that the occurrence of even-order harmonic frequencies is responsible to the deflection of Y and CL, which will be explained in the following paragraphs. The Poincaré mapping for the vibration of DC is conducted at stage IV, represented by the blue points in figure 14(a,f). The mapping points in the phase diagram are similar to an asymmetric ‘figure-8’-shape, and the trajectory lines are asymmetric to the equilibrium y-position, indicating the existence of symmetry breaking bifurcation. The bifurcation is a well-known origin to induce multiple frequencies in vibration, confirmed by the numerous peaks in figure 14(ce).

To examine the relationship between the even-order harmonic frequencies and the deflection, the frequencies of f 0, 2f 0, 3f 0 and 4f 0 as well as their initial phases obtained from FFT at stage IV are used to reconstruct the time-history CL of DC, and the corresponding results are shown in figure 15. The time-history CL curves reconstructed by the single frequency in figure 15(ad) present a decreasing amplitude from f 0 to 4f 0, in accordance with the FFT amplitudes in figure 14(e). By adding the objective time-history curves, three combinations of f 0 + 2f 0, f 0 + 3f 0 and f 0 + 4f 0 are compared with the curve constructed by a single f 0, whose results are illustrated in figure 15(f) together with zoom-in details in panels (g) and (h). The mean value of CL is clearly reduced by 0.099 when superimposing the reconstructed curve of 2f 0, while that is increased slightly for f 0 + 4f 0, indicating the even-order harmonic frequencies are responsible for the deflection of lift oscillation. By contrast, the representative odd-order harmonic frequency of 3f 0 mainly affects the oscillation amplitude. Therefore, even-order harmonic frequency components, accompanied by proper initial phases, play a promoting role in the deviation of lift from the zero equilibrium position. The even-order harmonics in lift could be induced by the symmetry breaking bifurcation of the flow around the structure system, which has been attributed to the origin of asymmetric deflection of the rotating circular cylinder attached with a rigid plate (Lācis et al. Reference Lcis, Brosse, Ingremeau, Mazzino, Lundell, Kellay and Bagheri2014; Lu et al. Reference Lu, Guo, Tang, Liu, Chen and Xie2016). Therefore, the symmetry breaking bifurcation of the flow around the structure system leads to the biased oscillation from the source.

Figure 15. Lift coefficients related to different frequency and phase components at Ur = 27: (ad) time-history lift coefficients reconstructed by the single frequency of f 0, 2f 0, 3f 0 and 4f 0 as well as the corresponding initial phases, respectively; (e) initial phases of f 0, 2f 0, 3f 0 and 4f 0 obtained from FFT; (f) time-history lift coefficients reconstructed by f 0, f 0 + 2f 0, f 0 + 3f 0 and f 0 + 4f 0 as well as the initial phases; (g) and (h) zoom-in details of panel (f).

The symmetry breaking of flow is further discussed by comparing the vorticity features near DC at stage II (t = 197 and 201) and stage IV (t = 1204 and 1208), as shown in figure 16. When t = 197, a negative gap vortex generating from UC is impacting on the surface of DC and splitting into the UN11 and UN12, while the negative shear layer on DC is developing into DN1, and the positive shear layer DP1 on DC has coalesced with the UP02 during last half-cycle. When t = 201, the splitting positive vortices UP11 and UP12 are symmetric with the UN12 and UN11 at t = 197, respectively, while newly coalesced vortex UN11 + DN1 is symmetric with the DP1 + UP02 at t = 197. The symmetric flow features between t = 201 and 197 induce the symmetric vibration behaviours of the cylinders at stage II. The splitting of the UC vortex and the shedding of a single DC vortex during every half-cycle forms three vortices, causing the harmonic frequency of 3f 0. When t = 1204 and 1208, UP11 and UP12 are split from the UC positive vortex in one half-cycle, while UN2 only attaches on the top side of the cylinder in another half-cycle, appearing as the asymmetric pattern. A pair of vortices, namely UP11 and DN1 + UN1 in figure 16(c), are shed in one half of a cycle, and another pair of vortices, namely UP12 + DP1 and UN2, are shed in another half of the cycle, leading to the 2f 0 frequency. The asymmetric flow pattern at stage IV confirms the symmetry breaking of the FSI system.

Figure 16. Vorticity fields near the DC at Ur = 27: (ad) t = 197, 201, 1204 and 1208, respectively.

4.2. FIV of the tandem square cylinders at L* = 2.5

4.2.1. Response and hydrodynamic characteristics

The DNS for the FIV of the tandem square cylinders at L* = 2.5, corresponding to the reattachment flow regime, is then conducted, followed by a discussion on the vibration responses and hydrodynamics. The vibration amplitudes and dominant frequencies of DC, UC and SC versus Ur are shown in figure 17(ac), together with the time-history displacements of DC and UC in panels (d) and (e) to show the VIV developing from galloping (GA), which is defined as the GV branch.

Figure 17. Vibration responses obtained from DNS at L* = 2.5: (a,b) normalized vibration amplitudes of DC and UC, respectively, together with the SC amplitudes in panel (b); (c) normalized vibration frequencies; (d,e) time-history displacements of DC and UC at Ur = 22, respectively.

The response amplitudes of DC and UC are classified into several branches with increasing Ur, where the GV and GA branches are observed at large Ur values. An interval of RV′, representing the resonant lock-in of DC and UC, is identified when Ur = 4–6, where large and small response amplitudes are observed for DC and UC, respectively. The lock-in frequency near 0.87fn and the absence of the peak amplitude for UC at the RV′ branch are the prominent features to differentiate it from the RV branch discussed in § 3.1.1. The arrangement of L* = 2.5 falls into the reattachment regime for two tandem cylinders at L* = 1.5–4 identified by Zdravkovich (Reference Zdravkovich1987), which means that the vibration of UC is slightly excited by the far resonant wake while the near reattached shear layer may be too weak to induce large vibration amplitude at the RV′ branch. An interesting phenomenon, that the RV and FV appear alternatively with the increasing Ur for DC and UC, is observed at Ur = 6.5–8, accompanied by multiple frequency jumps. Such RV interval is near the boundary of the structural instability, which is confirmed to be Ur = 6.9 according to figure 20. The critically unstable wake-structure mode promotes the UC to achieve large vibration amplitudes at the RV branch. The large vibration amplitude (1.04D) and low vibration frequency (0.73fn) of UC in the RV branch resemble the behaviours at the GA branch. However, the vortex shedding frequency in the wake, evaluated by the lift frequency of DC, is synchronized with the vibration to the natural frequency in RV, which is a typical resonance phenomenon. The GA presents a desynchronized behaviour between vibration and vortex shedding. The frequency separation between DC and UC appears at Ur = 8.5–10. The vibration of DC behaves as FV, while the UC counterpart develops into GA even though the vibration amplitude is relatively small. As stated by Li et al. (Reference Li, Lyu, Kou and Zhang2019), the winning of the structural mode in competition induces the GA, otherwise, the VIV-dominated motion will occur. The transition between FV and GA is induced by the intense competition between the unstable wake and structure modes. Compared with DC, the UC presents a stronger relationship with the unstable structure mode, evidenced by the interval of GA at Ur = 8.5–10. More detailed discussion on the competition between VIV and GA will be presented in § 4.2.2.

For Ur = 10–26, the GV branch is identified for UC. In contrast, the onset of the galloping is delayed to Ur = 16 after an interval of DV for DC. The timing span of the UC galloping in figure 17(e) is longer than the DC counterpart in figure 17(d), indicating again that the UC is related more to the unstable structure mode and can easily develop into GA. The unstable wake mode dominates the vibration finally at the GV branch even though the unstable structure mode has induced a period of GA in evolution. The GA branch, with particularly large amplitudes and lock-in frequencies near 0.7fn, is observed at Ur = 26–34. The deviation of lock-in frequency from fn for the GA of a square cylinder is owing to the effect of added mass, confirmed by Li et al. (Reference Li, Lyu, Kou and Zhang2019) through the frequency modification method introduced by Khalak & Williamson (Reference Khalak and Williamson1999). By comparing with FIV responses of SC, both DC and UC present different amplitude and frequency trends versus Ur, especially for the FV and GA branches. The variation from L* = 5 to L* = 2.5 strengthens the role of unstable structure mode in competition, promoting the behaviours related to GA.

The FFT spectra of the lift coefficients, and the displacements of DC and UC versus Ur are shown in figure 18 to examine more details of the frequency response. The lifts and vibrations of DC and UC mainly present the primary frequency component in IV and RV′. When entering the mixing region of RV and FV, the lift and displacement frequencies are dominated by the wake mode for RV and the structure mode for FV, where multiple frequency components are observed for FV. The frequency components of UC at the GA branch of Ur = 8.5–10 indicate that the UC vibration is locked to the structure mode because of the proximity of the primary vibration frequency to the natural frequency. The vibration of DC is dominated by the wake mode because the primary vibration frequency is close to the wake frequency in desynchronized VIV. The frequency discrepancy of UC vibration and wake variation confirmed the existence of GA for UC at Ur = 8.5–10. The frequency components of DC and UC at the GV branch are similar to the DV counterparts, where a third-order harmonic frequency appears in the lift coefficients. Complex frequency components, irregularly distributed between structure mode and wake mode, are captured in GA at Ur > 26, especially for the DC and UC displacements. Again, the dominant frequency of wake (0.113) is different from the lock-in frequency of structural vibration (0.021), exhibiting the typical behaviours of GA.

Figure 18. FFT spectra of lift coefficients and normalized displacements of the two tandem square cylinders at Ur = 3–34 and L* = 2.5: (a) lift coefficient of DC; (b) displacements of DC; (c) lift coefficient of UC; and (d) displacements of UC.

The r.m.s. values of lift coefficients as well as the phase features of the FSI system at L* = 2.5 are shown in figure 19. The results are classified into six regions in accordance with the FIV branches depicted in figure 17. The r.m.s. lift coefficient of DC jumps to a large value, while the UC counterpart is relatively small at the IV and RV′ branches, with a constant value of 0 for phase lags between YDC and CL-DC and between YUC and CL-UC. The region of 6 < Ur ≤ 8 is basically covered by the mixing of RV and FV, where the r.m.s. lift coefficients and phase lags in RV share similar trends with those in RV′ except for the two sharp peaks of r.m.s. CL-UC (1.38 and 1.34 at Ur = 6.5 and 7.5, respectively). The discrepancy of the phase lags corresponding to DC and UC at 8 < Ur ≤ 11 is related to the different vibration branches of FV and GA. The interval of 11 < Ur ≤ 26 corresponds to the DV and GV branches, which are characterized by the typical features of DV branch described in § 3.1.1. The final branch at Ur > 26 is the branch of GA, where the small lift excites particularly large-amplitude vibrations, confirming the weak correlation of unstable wake mode with GA. The irregular phase lags at the GA branch indicate that the frequencies of lift and vibrations are desynchronized, which is a primary feature for galloping.

Figure 19. Statistical results and phase characteristics of lift coefficients at Ur = 3–34 and L* = 2.5: (a) r.m.s. lift coefficients of the two square cylinders; and (b) mean phase lags between displacements and lift coefficients of two square cylinders.

4.2.2. Transitions among VIVs and galloping

More abundant VIV and GA branches have been identified for tandem square cylinders at L* = 2.5 through the above discussion. The transition from RV′ to RV, as well as the transition from VIV to GA, are examined by conducting linear stability analysis and interpreting the temporal evolution of the vibration.

The root loci of the two leading modes for the FSI system obtained from linear stability analysis are shown in figure 20, whose real and imaginary parts versus Ur are provided in figure 21(a,b), respectively.

Figure 20. Root loci of the coupled system at Ur = 0–34 and L* = 2.5 through stability analysis.

Figure 21. Stability results of the FSI system at Ur = 3–34 and L* = 2.5: (a,b) real parts and imaginary parts of the eigenvalues corresponding to the first two leading modes, respectively, accompanied by the compared ones of the stationary tandem square cylinders.

The imaginary parts of WM with blue colour mainly distribute around that of ST I, while the imaginary parts of WSM with green colour are near that of ST II first and approach SM counterparts gradually in figure 20. The real part of WM, also considered to be the growth rate, is greater than 0 when Ur ≤ 1.3 and Ur ≥ 3.9 in figure 21(a), revealing the interval of the unstable WM. In fact, the VIV with recognizable amplitude is observed at Ur ≥ 4 for DNS results in figure 17, consistent with the stability analysis. The WSM is found to be unstable for Ur ≥ 6.9, entering the SM-dominated branch. The Ur corresponding to RV′ falls into the region of the unstable WM completely, implying the relationship of RV′ with unstable WM. The RV is near the boundary of the unstable WSM, whose eigenfrequencies are near that of the ST II in figure 21(b). This observation suggests that the WSM is dominated by the wake at the RV branch, and its instability resembles the unstable WM except for the low eigenfrequencies, thus inducing RV with low lock-in frequency. The transition from RV′ to RV will be further discussed by combining with the temporal evolution of vibration. The growth rate λr of WSM continuously increases from Ur = 6.9 to Ur = 10 while that of WM is at λr = 0.18, where the eigenfrequency of WM asymptotes to that of ST I and WSM varies with a similar trend to SM (fn). The initially growing proportion of the structure component in the unstable WSM leads to the FV. With the increasing Ur, the structural instability dominates the unstable WSM, and the competition between unstable WM and SM promotes the appearance of either GV or GA based on the dominance of either WM or SM, respectively. Behara, Ravikanth & Chandra (Reference Behara, Ravikanth and Chandra2023) found that the galloping instability begins at a much lower Ur although the overall vibration is still dominated by the VIV in the FIV of three tandem square cylinders. This combination of VIV and GA is related to the mode competition.

The time history of the displacements and lift coefficients of DC and UC, together with the FFT spectra and vorticity fields at Ur = 6.5, are illustrated in figure 22 to reveal the evolution of RV′ and the transition from RV to RV′.

Figure 22. DNS results at the RV branch when Ur = 6.5 and L* = 2.5: (a,b) time-history displacement and lift coefficient of DC, respectively; and (c,d) the UC counterparts; (e,f) FFT amplitude spectra of DC and UC displacements and lift coefficients at Stages II; and (g,h) the counterparts at Stages V; (i,j) vorticity fields at t = 584 and 1210, respectively.

The temporal evolutions of Y and CL in figure 22(ad) are divided into four stages. Stage I represents the development process from the initial state, followed by a relatively stable state of Stage II, where the Y and CL display regular oscillating features. The FFT spectra at Stage II indicate that the vibration of the system is at the RV′ branch since the primary frequency f 0 = 0.145 = 0.943fn and only DC exhibits a large vibration amplitude. A weak disturbing frequency f 1 = 0.099, matching with the eigenfrequency of ST II, is observed for UC at Stage II, implying that the transition from RV′ to RV is related to the resonant wake near UC, defined as the gap vortex by Bhatt & Alam (Reference Bhatt and Alam2018), instead of the far wake. The low resonant frequency gradually dominates the CL-UC evolution, then the YUC and finally the CL-DC at Stage III. The first transition for the CL-UC confirms that the RV originates from the unstable wake, and thus belongs to the resonance phenomenon. The vibrations and lifts of DC and UC become stable at Stage IV, controlled by the primary frequency f 0 = 0.105 = 0.683fn and affected by odd-order harmonics. The vorticity fields at t = 592.9 and 1546.1, corresponding to Stage II and Stage IV, behave as the mode of two-raw vortices and the ‘2S’ mode, respectively. The gap vortex, inducing large vibration amplitude for UC, is observed at Stage IV, suggesting that the flow changes from the reattachment to the co-shedding regime. In addition, the coalescence of the vortices (e.g. DP1 and DP0) at t = 1546.1 enhance the proportion of high-order harmonics, especially for DC.

The transition between VIV and GA is further discussed based on the temporal evolution of Y and CL at Ur = 26, as shown in figure 23. The combination of the intermediate GA and final VIV, known as the GV branch in the present study, exhibits the transition between GA and VIV. The characteristics of Y and CL temporal evolutions of DC and UC feature three stages. Both DC and UC behave as VIV-dominated vibration at Stage I, whereas the Y of UC first transits to GA near the end of this stage, confirming that the structural instability of UC leads to GA instead of the unstable wake. At Stage II, the GA is identified since the low vibration frequency of f 0 = 0.026 = 0.676fn is desynchronized with the high vortex shedding frequency of f 1 = 0.113 = 2.938fn. The CL values of DC and UC are stable and regular near the end of Stage II, implying that the wake mode is gradually suppressing the structure mode. The wake mode finally re-dominates the vibration at Stage III with a primary frequency of 0.117 and a third-order harmonic frequency. Although the structural instability promotes the appearance of GA, it is valid because the structure mode dominates the wake mode in the competition, otherwise, the VIV will dominate the vibration at the final stable stage. The vorticity fields at t = 352 and 870.6 exhibit the ‘2S’ vortex mode for both GA and VIV at Stage II and Stage III. The low-frequency characteristics of GA is reflected in the moving trajectory of the ‘2S’ vortex while the vortex shedding frequency is almost unaffected, supporting the conclusion that the structure mode controls the vibration at the GA branch.

Figure 23. DNS results at the GV branch when Ur = 26 and L* = 2.5: (a,b) time-history displacement and lift coefficient of DC, respectively; and (c,d) the UC counterparts; (e,f) FFT amplitude spectra of DC and UC displacements and lift coefficients at Stages II; and (g,h) the counterparts at Stages V; (i,j) vorticity fields at t = 352 and 870.6, respectively.

4.3. FIV response and branch map within L* = 1.5–5 and Ur = 3–34

4.3.1. Effect of L* on FIV response

In addition to the typical FIV characteristics of the two tandem square cylinders at L* = 5 and 2.5 discussed above, the vibration amplitudes and frequencies within L* = 1.5–5, illustrated in figure 24, are investigated to quantify the effect of L* on FIV responses.

Figure 24. Amplitude and frequency responses of DC and UC versus Ur at L* = 1.5, 2, 2.5, 3, 3.5, 4, 4.5 and 5: (a,c) normalized vibration amplitudes of DC and UC, respectively; (b,d) frequency ratio of DC and UC y-displacements, respectively.

The vibration amplitudes of DC and the corresponding dominant frequency versus Ur are shown in figure 24(a,b), respectively. The vibration amplitudes are classified into three regions except for the initial branch with small vibration amplitudes. Region I is mainly covered by RV′, RV and FV with large vibration amplitudes, which are distinguished by the different frequency lock-in features described in §§ 3.1 and 3.2. Region II basically falls into the branches of DV, GV and BO with almost constant or slowly decreasing vibration amplitude with increasing Ur. Region III shows an overall ascending trend for the vibration amplitude with increasing Ur, basically covered by the GA branch. The upper Ur boundary of Region I is constant at 12 for L* = 5, 4.5 and 4, grows to almost 14 for L* = 3.5 and 3, and then decreases to the value near 7.5 for the smaller L*. The number of amplitude peaks varies from two to three when L* is reduced to 3, and then diminishes to one peak with L* = 1.5. The variation of the amplitude peaks corresponds to the changing of lock-in frequency in Region I. The vibration amplitude in Region II is amplified with decreasing L* until approaching the boundary of Region III at L* = 2. Region III occurs at the amplitude curves of L* ≤ 2.5, whose lower Ur boundary varies from 26 at L* = 2.5 to 7 at L* = 2 and then to 8 at L* = 1.5.

Figure 24(c,d) shows the vibration amplitudes and frequencies for UC. Three regions are also identified for the vibration amplitude. Different from that of DC, the branch of RV′ is incorporated in the initial region instead of Region I due to the small vibration amplitude, resulting in a slender shape of Region I for UC. Meanwhile, the amplitude peaks in Region I are mainly induced by RV based on the lock-in frequency features. The amplitude peaks in Region I present an increasing trend from L* = 5 to 2.5 and then exhibit a sharp decline at L* = 2 and 1.5. The lower and upper Ur boundaries of Region I reach the maximum values near L* = 2.5–3.5, differing from DC. The vibration amplitudes of UC in Region II are small at L* = 2.5–5, while those in Region III jump to considerable large values. Region III of UC locates at the range of small L*, whose largest Ur span appears at L* = 2.

4.3.2. FIV branch map

The characteristics of vibration amplitude and frequency are associated with diverse FIV branches. To clarify the distribution of FIV branches in the parameter space of L* = 1.5–5 and Ur = 3–34, the branch maps for both DC and UC are summarized based on the DNS results and linear stability analysis, shown in figure 25.

Figure 25. FIV branch map of two tandem square cylinders with the variation of reduced velocity (Ur) and spacing ratio (L*): (a,b) DC and UC, respectively.

The classifications of the vibration states at each branch for DC and UC are primarily based on the response features of amplitude, frequency and equilibrium position, which have been presented and interpreted in §§ 4.1 and 4.2. A transitional (TR) branch between DV and GA branches at large Ur, which has not been discussed so far, is marked in green in figure 25, and detailed at Ur = 34 and L* = 3 in figure 26. It is observed from figure 26 that the vibration and lift of both DC and UC share the same primary frequency of 0.125. Their secondary frequencies are different, 0.008 for the vibration and 0.375 for the lift. Although the vibrations are dominated by VIV, the significant component of the galloping frequency tends to take over them, especially for UC, and thus defined as TR. The wake of the system behaves as the ‘C(2S)’ mode, different from the typical ‘2S’ mode of the GA branch.

Figure 26. DNS results for two tandem square cylinders at the TR branch when Ur = 34 and L* = 3: (a,b) normalized displacements and lift coefficients of DC and UC, respectively; (c,d) amplitude spectra of normalized displacements and lift coefficients of DC and UC, respectively; (e,f) vorticity fields at t = 767 and 770.9, respectively.

The primary distributions of the FIV branches of the two tandem square cylinders are summarized as follows.

  1. (i) The RV′, RV and FV branches mainly intersperse between the IV and DV branches or between the IV and GA branches for the two tandem square cylinders, where the RV′ and RV occur at L* ≤ 4.3 and L* ≥ 2.5, respectively. The FV branch of DC covers a larger parameter space for both L* and Ur than the UC counterpart, which is identified at L* ≤ 3.2. The boundary of the structural instability basically separates the RV′ or RV branch from the FV or DV branch even though local distinctions between DNS and stability analysis exist near the boundary. The transition from the IV branch to the RV′ or RV branch is attributed to the unstable wake, while the transition from the RV′ or RV branch to the FV branch is related to the appearance of the unstable structure.

  2. (ii) The DV branch occupies the largest area of the branch map for DC and UC. At the top-right corner of the DV branch, the BO branch caused by symmetry breaking bifurcation is observed. In terms of the concerned parameters, the critical L* for the BO branch is near 3.7 at Ur = 34 and the critical Ur (Urc) is evaluated as 24.5 at L* = 4.5. Within the present parameter range, the BO branch shows a gradually decreasing Urc when L* grows from 3.7 to 4.5 and a stable Urc near 24.5 when L* ≥ 4.5. The DC and UC share the same parameter range of L* and Ur for the appearance of the BO branch.

  3. (iii) The GA branch is located at the bottom-right corner of the branch map for DC and UC. The GA branch of DC borders with DV while that of UC, excited by smaller Ur, neighbours on FV, confirmed that the UC is more easily dominated by an unstable structure mode. Two holes of GV and TR branches are found between the lower boundary of the DV branch and the upper boundary of the GA branch, where the GV branch is within Ur = 11–26 and L* = 2.3–2.5, and the TR branch occurs at larger Ur and near L* = 2.7–3. Notably, the GV and TR branches still belong to VIV-type vibration based on the dominant features. The transitional GV and TR branches are caused by the intense competition between unstable wake and structure modes, and the dominance of wake or structure determines the transition to VIV or GA.

5. Conclusions

This study performs two-dimensional DNS and ROM-based linear stability analysis on the cross-flow FIV of two identical square cylinders with m* = 3.5 in tandem arrangement at Re = 150. The branches of VIV, BO and GA are identified over the range of 1.5 ≤ L* ≤ 5 and 3 ≤ Ur ≤ 34, among which the IV, RV′, RV, FV, DV, GV and TR branches are specified for VIV. The transitions among different branches are examined. The main conclusions from this study are summarized below.

Different FIV branches are identified based on the vibration responses of the two square cylinders. The amplitude response of DC presents two peaks near Ur = 4.5–10 at L* = 5, which are classified into the RV and FV branches that are inherently induced by the resonance and flutter, respectively. The BO branch with biased equilibrium position in randomly positive or negative y-direction appears at Ur > 24 for both DC and UC. With increasing Ur, the DC experiences the branches of IV, RV, FV, DV and BO sequentially, while the FV branch is absent for UC at L* = 5. A different resonance branch of RV′, characterized by large vibration amplitude for DC and rather small vibration amplitude for UC, is found near Ur = 4–6 at L* = 2.5. The GV branch, which is similar to the DV branch at the final stage but experiences a period of GA in evolution, is identified at Ur = 4–6 for DC and at Ur = 4–6 for UC at L* = 2.5. The DC behaves as the IV, RV′, mixing of RV and FV, DV, GV and GA branches sequentially, while the UC presents a GA interval after the mixing of RV and FV branches, and then appears as GV and GA branches at L* = 2.5.

The two square cylinders experience several vibration transitions among the VIV, BO and GA with varying L* and Ur. The transition from IV to RV or RV′ is related to the unstable WM. The WSM behaves as a wake mode first and then as a structure mode with the increasing Ur. The critically unstable WSM dominated by the wake promotes the transition from RV′ to RV, while that dominated by the structure leads to the transition from RV or RV′ to FV. The structural instability is the physical origin of the GA, whereas the mode competition between unstable wake and structure delays the transition from VIV to GA. The complete dominance of wake mode leads to regular VIV, evidenced by the transition from FV or RV to DV. The unstable structure mode gradually becomes prominent at low L* and large Ur, resulting in the GV and TR. Once unstable structure mode plays the leading role, the GA is excited. The transition from DV to BO occurs at large L* and Ur values, whose deviation from zero equilibrium position is associated with the even-order harmonic frequencies. The symmetry breaking bifurcation in the FSI system induces the biased equilibrium and even-order frequency components.

The transition boundaries among VIV, BO and GA branches within 1.5 ≤ L* ≤ 5 and 3 ≤ Ur ≤ 34 can be clarified through FIV branch maps of DC and UC. The RV′, RV and FV branches are mainly interspersed between the IV and DV branches or between the IV and GA branches for both DC and UC, where RV′ and RV occur at L* ≤ 4.3 and L* ≥ 2.5, respectively. The DV branch locates at the upper central area of branch map for both DC and UC. The BO branch is near the top-right corner of the DV branch, with the critical L* of 3.7 at Ur = 34 and the critical Ur of 24.5 at L* = 4.5. The GA branch is mainly at the bottom-right corner of the branch map. Two holes of GV and TR branches distribute between the DV lower boundary and the GA upper boundary, where the GV branch is at Ur = 11–26 and L* = 2.3–2.5, and the TR branch occurs at large Ur and near L* = 2.7–3.

Funding

This work is supported by the National Natural Science Foundation of China (grant numbers 52201310, 52371262 and 51979031), the Fundamental Research Funds for the Central Universities (grant number D2230600) and the Natural Science Foundation of Liaoning Province (grant number 2022-KF-18-02).

Declaration of interests

The authors report no conflict of interest.

Data availability

The data that support the findings of this study are available from the corresponding author upon reasonable request.

References

Assi, G.R.S., Meneghini, J.R., Aranha, J.A.P., Bearman, P.W. & Casaprima, E. 2006 Experimental investigation of flow-induced vibration interference between two circular cylinders. J. Fluids Struct. 22 (6–7), 819827.10.1016/j.jfluidstructs.2006.04.013CrossRefGoogle Scholar
Bearman, P.W. 2011 Circular cylinder wakes and vortex-induced vibrations. J. Fluids Struct. 27 (5), 648658.10.1016/j.jfluidstructs.2011.03.021CrossRefGoogle Scholar
Behara, S., Ravikanth, B. & Chandra, V. 2023 On the galloping cross-flow vibration responses of three in-line square cylinders. Phys. Fluids 35, 067112.10.1063/5.0146666CrossRefGoogle Scholar
Bhatt, R. & Alam, M.M. 2018 Vibrations of a square cylinder submerged in a wake. J. Fluid Mech. 853, 301332.10.1017/jfm.2018.573CrossRefGoogle Scholar
Blevins, R.D. 1990 Flow-induced Vibration. Van Nostrand Reinhold.Google Scholar
Borazjani, I. & Sotiropoulos, F. 2009 Vortex-induced vibrations of two cylinders in tandem arrangement in the proximity-wake interference region. J. Fluid Mech. 621, 321364.10.1017/S0022112008004850CrossRefGoogle ScholarPubMed
Carmo, B., Sherwin, S., Bearman, P. & Willden, R. 2011 Flow-induced vibration of a circular cylinder subjected to wake interference at low Reynolds number. J. Fluids Struct. 27 (4), 503522.10.1016/j.jfluidstructs.2011.04.003CrossRefGoogle Scholar
Crouch, J.D., Garbaruk, A. & Magidov, D. 2007 Predicting the onset of flow unsteadiness based on global instability. J. Comput. Phys. 224 (2), 924940.10.1016/j.jcp.2006.10.035CrossRefGoogle Scholar
Gowda, B.H.L. & Kumar, R.A. 2006 Flow-induced oscillations of a square cylinder due to interference effects. J. Sound Vib. 297 (3–5), 842864.10.1016/j.jsv.2006.05.003CrossRefGoogle Scholar
Griffith, M.D., Jacono, D.L., Sheridan, J. & Leontini, J.S. 2017 Flow-induced vibration of two cylinders in tandem and staggered arrangements. J. Fluid Mech. 833, 98130.10.1017/jfm.2017.673CrossRefGoogle Scholar
Guan, M.Z. & Jaiman, R.K. 2017 Flow-induced vibration of two side-by-side square cylinders with combined translational motions. J. Fluids Struct. 69, 265292.10.1016/j.jfluidstructs.2016.12.010CrossRefGoogle Scholar
Guan, M.Z., Jaiman, R.K., Kang, C.W. & Lim, T.B.A. 2016 Freely vibrating two side-by-side square columns with combined translational motions. In International Conference on Offshore Mechanics and Arctic Engineering, vol. 49934, p. V002T08A069. ASME.Google Scholar
Han, Z., Zhou, D., Malla, A., Nepali, R., Kushwaha, V., Li, Z., Kwok, K.C., Tu, J. & Bao, Y. 2018 Wake-induced vibration interference between a fixed square cylinder and a 2-DOF downstream square cylinder at low Reynolds numbers. Ocean Engng 164, 698711.10.1016/j.oceaneng.2018.07.007CrossRefGoogle Scholar
Hwang, J.Y., Yang, K.S. & Sun, S.H. 2003 Reduction of flow-induced forces on a circular cylinder using a detached splitter plate. Phys. Fluids 15, 24332436.CrossRefGoogle Scholar
Jaiman, R.K., Pillalamarri, N.R. & Zhao, G.M. 2016 A stable second-order partitioned iterative scheme for freely vibrating low-mass bluff bodies in a uniform flow. Comput. Meth. Appl. Mech. Engng 301, 187215.CrossRefGoogle Scholar
Khalak, A. & Williamson, C.H.K. 1999 Motions, forces and mode transitions in vortex-induced vibrations at low mass-damping. J. Fluids Struct. 13, 813851.CrossRefGoogle Scholar
Kumar, R.A. & Gowda, B.H.L. 2006 Vortex-induced vibration of a square cylinder without and with interference. J. Fluids Struct. 22 (3), 345369.10.1016/j.jfluidstructs.2005.11.006CrossRefGoogle Scholar
Kumar, R.A., Gowda, B.H.L. & Sohn, C.H. 2008 Interference excitation of a square section cylinder. J. Mech. Sci. Technol. 22 (3), 599607.CrossRefGoogle Scholar
Kumar, D. & Sen, S. 2021 Flow-induced vibrations of a pair of in-line square cylinders. Phys. Fluids 33 (4), 043602.10.1063/5.0038714CrossRefGoogle Scholar
Lcis, U., Brosse, N., Ingremeau, F., Mazzino, A., Lundell, F., Kellay, H. & Bagheri, S. 2014 Passive appendages generate drift through symmetry breaking. Nat. Commun. 5 (1), 19.Google Scholar
Leontini, J.S., Thompson, M.C. & Hourigan, K. 2010 A numerical study of global frequency selection in the time-mean wake of a circular cylinder. J. Fluid Mech. 645, 435446.CrossRefGoogle Scholar
Li, X., Lyu, Z., Kou, J. & Zhang, W. 2019 Mode competition in galloping of a square cylinder at low Reynolds number. J. Fluid Mech. 867, 516555.10.1017/jfm.2019.160CrossRefGoogle Scholar
Li, X., Zhang, W. & Gao, C. 2018 Proximity-interference wake-induced vibration at subcritical Re: mechanism analysis using a linear dynamic model. Phys. Fluids 30 (3), 033606.CrossRefGoogle Scholar
Lin, J.Z., Jiang, R.J. & Ku, X.K. 2014 Numerical prediction of an anomalous biased oscillation regime in vortex-induced vibrations of two tandem cylinders. Phys. Fluids 26 (3), 034102.10.1063/1.4868278CrossRefGoogle Scholar
Lu, L., Guo, X.L., Tang, G.Q., Liu, M.M., Chen, C.Q. & Xie, Z.H. 2016 Numerical investigation of flow-induced rotary oscillation of circular cylinder with rigid splitter plate. Phys. Fluids 28 (9), 093604.CrossRefGoogle Scholar
Naudascher, E. & Rockwell, D. 1994 Flow-induced Vibrations: An Engineering Guide. Dover.Google Scholar
Nepali, R., Ping, H., Han, Z., Zhou, D., Yang, H., Tu, J., Zhao, Y. & Bao, Y. 2020 Two-degree-of-freedom vortex-induced vibrations of two square cylinders in tandem arrangement at low Reynolds numbers. J. Fluids Struct. 97, 102991.10.1016/j.jfluidstructs.2020.102991CrossRefGoogle Scholar
Papaioannou, G.V., Yue, D.K.P., Triantafyllou, M.S. & Karniadakis, G.E. 2008 On the effect of spacing on the vortex-induced vibrations of two tandem cylinders. J. Fluids Struct. 24 (6), 833854.CrossRefGoogle Scholar
Prasanth, T.K. & Mittal, S. 2008 Vortex-induced vibrations of a circular cylinder at low Reynolds numbers. J. Fluid Mech. 594, 463491.CrossRefGoogle Scholar
Qin, B., Alam, M.M. & Zhou, Y. 2017 Two tandem cylinders of different diameters in cross-flow: flow-induced vibration. J. Fluid Mech. 829, 621658.10.1017/jfm.2017.510CrossRefGoogle Scholar
Qiu, T., Lin, W., Du, X. & Zhao, Y. 2021 b Mass ratio effect on vortex-induced vibration for two tandem square cylinders at a low Reynolds number. Phys. Fluids 33 (12), 123604.CrossRefGoogle Scholar
Qiu, T., Yan, Z., Du, X. & Lin, W. 2021 a Spacing effect on the two-degree-of-freedom VIV of two tandem square cylinders. Ocean Engng 236, 109519.CrossRefGoogle Scholar
Sarpkaya, T. 2004 A critical review of the intrinsic nature of vortex-induced vibrations. J. Fluids Struct. 19 (4), 389447.CrossRefGoogle Scholar
Sen, S. & Mittal, S. 2015 Effect of mass ratio on free vibrations of a square cylinder at low Reynolds numbers. J. Fluids Struct. 54, 661678.10.1016/j.jfluidstructs.2015.01.006CrossRefGoogle Scholar
Singh, S.P. & Mittal, S. 2005 Vortex-induced oscillations at low Reynolds numbers: hysteresis and vortex-shedding modes. J. Fluids Struct. 20, 10851104.CrossRefGoogle Scholar
Sumer, B.M. 2006 Hydrodynamics Around Cylindrical Structures, vol. 26. World Scientific.CrossRefGoogle Scholar
Sun, X., Zhang, J.Z. & Ren, X.L. 2012 Characteristic-based split (CBS) finite element method for incompressible viscous flow with moving boundaries. Engng Appl. Comput. Fluid 6 (3), 461474.Google Scholar
Tamimi, V., Esfehani, M.J., Zeinoddini, M., Naeeni, S.T.O., Wu, J. & Shahvaghar-Asl, S. 2020 Marine hydrokinetic energy harvesting performance of diamond and square oscillators in tandem arrangements. Energy 202, 117749.10.1016/j.energy.2020.117749CrossRefGoogle Scholar
Wang, T., Kwok, K.C., Yang, Q., Tian, Y. & Li, B. 2022 Experimental study on proximity interference induced vibration of two staggered square prisms in turbulent boundary layer flow. J. Wind Engng Ind. Aerod. 220, 104865.CrossRefGoogle Scholar
Williamson, C. & Govardhan, R. 2004 Vortex-induced vibrations. Annu. Rev. Fluid Mech. 36, 413455.10.1146/annurev.fluid.36.050802.122128CrossRefGoogle Scholar
Yao, W. & Jaiman, R.K. 2019 Stability analysis of the wake-induced vibration of tandem circular and square cylinders. Nonlinear Dyn. 95 (1), 1328.10.1007/s11071-018-4547-9CrossRefGoogle Scholar
Zdravkovich, M.M. 1987 The effects of interference between circular cylinders in cross flow. J. Fluids Struct. 1, 239261.CrossRefGoogle Scholar
Zhang, W., Li, X., Ye, Z. & Jiang, Y. 2015 Mechanism of frequency lock-in in vortex-induced vibrations at low Reynolds numbers. J. Fluid Mech. 783, 72102.CrossRefGoogle Scholar
Zhang, W. & Ye, Z. 2007 Reduced-order-model-based flutter analysis at high angle of attack. J. Aircraft 44 (6), 20862089.CrossRefGoogle Scholar
Zhao, G.M., Pillalamarri, N.R., Mysa, R.C. & Jaiman, R.K. 2015 Flow-induced vibrations of single and tandem square columns. In International Conference on Offshore Mechanics and Arctic Engineering, vol. 56482, p. V002T08A053. ASME.Google Scholar
Zhao, J.S., Leontini, J.S., Jacono, D.L. & Sheridan, J. 2014 Fluid structure interaction of a square cylinder at different angles of attack. J. Fluid Mech. 747, 688721.10.1017/jfm.2014.167CrossRefGoogle Scholar
Zhao, M. 2013 Flow induced vibration of two rigidly coupled circular cylinders in tandem and side-by-side arrangements at a low Reynolds number of 150. Phys. Fluids 25 (12), 123601.10.1063/1.4832956CrossRefGoogle Scholar
Zhao, M., Cheng, L. & Zhou, T. 2013 Numerical simulation of vortex-induced vibration of a square cylinder at a low Reynolds number. Phys. Fluids 25 (2), 023603.CrossRefGoogle Scholar
Zhao, M., Kaja, K., Xiang, Y. & Cheng, L. 2016 Vortex-induced vibration of four cylinders in an in-line square configuration. Phys. Fluids 28 (2), 023602.10.1063/1.4941774CrossRefGoogle Scholar
Zienkiewicz, O.C. & Codina, R. 1995 A general algorithm for compressible and incompressible flow. Part I. The split, characteristic-based scheme. Intl J. Numer. Meth. Fluids 20 (8–9), 869885.CrossRefGoogle Scholar
Zienkiewicz, O.C., Nithiarasu, P., Codina, R., Vazquez, M. & Ortiz, P. 1999 The characteristic-based-split procedure: an efficient and accurate algorithm for fluid problems. Intl J. Numer. Meth. Fluids 31 (1), 359392.3.0.CO;2-7>CrossRefGoogle Scholar
Figure 0

Table 1. Summary of the studies on FIV of two tandem square cylinders. Exp., experiment; Num., numerical simulation; SA., stability analysis.

Figure 1

Figure 1. A sketch of computational domain and boundary conditions.

Figure 2

Figure 2. Mesh distribution of the computational domain and a close-up view near two tandem square cylinders at L = 5.

Figure 3

Table 2. Influence of the mesh parameters on vibration responses and hydrodynamic coefficients of the tandem square cylinders with L* = 5 and 2.5 at Re = 150: Nel represents the element number; Ay1 and Ay2, normalized by dividing D, are maximum vibration amplitudes of DC and UC, respectively; fy1 and fy2 are the corresponding normalized primary frequencies by U/D; and $C_{L1}^{rms}$ and $C_{L2}^{rms}$ are the corresponding root-mean-square (r.m.s.) lift coefficients.

Figure 4

Figure 3. Comparison of the VIV results of a square cylinder with m* = 3 and ξ = 0 at Re = 100. The upper and lower subgraphs are the dimensionless cross-flow amplitude and frequency, respectively.

Figure 5

Figure 4. Comparison of the cross-flow and in-line maximum vibration amplitudes versus Ur at Re = 160 and L* = 2.5 and 5: (a,b) cross-flow and in-line vibration amplitudes of downstream circular cylinder, respectively; (c,d) counterparts of upstream circular cylinder.

Figure 6

Figure 5. Base flow of two stationary tandem cylinders (L* = 5 and Re = 150): (a) vorticity and (b) pressure.

Figure 7

Figure 6. Time-history curves of input and output signals at L* = 5 and Re = 150: (a) forced displacements of two tandem square cylinders; (b) lift coefficients of two tandem square cylinders obtained from DNS and ROM, where the subscripts 1 and 2 denote upstream and downstream cylinders, respectively.

Figure 8

Figure 7. Stability analysis for the FSI system of two tandem square cylinders with m* = 3.5 and ξ = 0 at L* = 5 and Re = 150: (a) root loci of the coupled system at Ur = 0–20; (be) DNS-computed cross-flow displacements of the two square cylinders subjected to an impulse velocity response at Ur = 2.5, 4, 6 and 10, respectively.

Figure 9

Figure 8. Vibration responses of DC and UC with a companion to that of a single square cylinder at L* = 5: (a) normalized vibration amplitudes; (b) normalized vibration frequencies; and (c) normalized mean positions in the y-direction.

Figure 10

Figure 9. FFT spectra of lift coefficients and normalized displacements of the two tandem square cylinders at Ur = 3–34 and L* = 5: (a) lift coefficient of DC; (b) displacements of DC; (c) lift coefficient of UC; and (d) displacements of UC.

Figure 11

Figure 10. Statistical results and phase characteristics of lift coefficients at Ur = 3–34 and L* = 5: (a) and (b) r.m.s. and mean lift coefficients of the two square cylinders; and (c) mean phase lags between displacements and lift coefficients of two square cylinders.

Figure 12

Figure 11. Stability results of the FSI system of two tandem square cylinders at Ur = 3–34: (a,b) real and imaginary parts of the eigenvalues corresponding to the first two leading modes, respectively, together with the corresponding values for the stationary tandem square cylinders.

Figure 13

Figure 12. DNS results of the DC at different VIV branches: (ad) time-history y-displacements and lift coefficients; (eh) FFT amplitude spectra of y-displacements and lift coefficients; and (il) phase diagrams of y-displacements and y-velocities at Ur = 3, 5.5, 7.5 and 16, respectively.

Figure 14

Figure 13. Vorticity fields of the two tandem square cylinders at different VIV branches: (ad) Ur = 3, 5.5, 7.5 and 16, respectively.

Figure 15

Figure 14. DNS results of the DC at the BO branch when Ur = 27: (a,d) time-history y-displacement and lift coefficient, respectively; (ce) FFT amplitude spectra of y-displacement and lift coefficient at Stages II, III and IV, respectively; and (f) phase diagrams of y-displacement and y-velocity at Stage IV.

Figure 16

Figure 15. Lift coefficients related to different frequency and phase components at Ur = 27: (ad) time-history lift coefficients reconstructed by the single frequency of f0, 2f0, 3f0 and 4f0 as well as the corresponding initial phases, respectively; (e) initial phases of f0, 2f0, 3f0 and 4f0 obtained from FFT; (f) time-history lift coefficients reconstructed by f0, f0 + 2f0, f0 + 3f0 and f0 + 4f0 as well as the initial phases; (g) and (h) zoom-in details of panel (f).

Figure 17

Figure 16. Vorticity fields near the DC at Ur = 27: (ad) t = 197, 201, 1204 and 1208, respectively.

Figure 18

Figure 17. Vibration responses obtained from DNS at L* = 2.5: (a,b) normalized vibration amplitudes of DC and UC, respectively, together with the SC amplitudes in panel (b); (c) normalized vibration frequencies; (d,e) time-history displacements of DC and UC at Ur = 22, respectively.

Figure 19

Figure 18. FFT spectra of lift coefficients and normalized displacements of the two tandem square cylinders at Ur = 3–34 and L* = 2.5: (a) lift coefficient of DC; (b) displacements of DC; (c) lift coefficient of UC; and (d) displacements of UC.

Figure 20

Figure 19. Statistical results and phase characteristics of lift coefficients at Ur = 3–34 and L* = 2.5: (a) r.m.s. lift coefficients of the two square cylinders; and (b) mean phase lags between displacements and lift coefficients of two square cylinders.

Figure 21

Figure 20. Root loci of the coupled system at Ur = 0–34 and L* = 2.5 through stability analysis.

Figure 22

Figure 21. Stability results of the FSI system at Ur = 3–34 and L* = 2.5: (a,b) real parts and imaginary parts of the eigenvalues corresponding to the first two leading modes, respectively, accompanied by the compared ones of the stationary tandem square cylinders.

Figure 23

Figure 22. DNS results at the RV branch when Ur = 6.5 and L* = 2.5: (a,b) time-history displacement and lift coefficient of DC, respectively; and (c,d) the UC counterparts; (e,f) FFT amplitude spectra of DC and UC displacements and lift coefficients at Stages II; and (g,h) the counterparts at Stages V; (i,j) vorticity fields at t = 584 and 1210, respectively.

Figure 24

Figure 23. DNS results at the GV branch when Ur = 26 and L* = 2.5: (a,b) time-history displacement and lift coefficient of DC, respectively; and (c,d) the UC counterparts; (e,f) FFT amplitude spectra of DC and UC displacements and lift coefficients at Stages II; and (g,h) the counterparts at Stages V; (i,j) vorticity fields at t = 352 and 870.6, respectively.

Figure 25

Figure 24. Amplitude and frequency responses of DC and UC versus Ur at L* = 1.5, 2, 2.5, 3, 3.5, 4, 4.5 and 5: (a,c) normalized vibration amplitudes of DC and UC, respectively; (b,d) frequency ratio of DC and UC y-displacements, respectively.

Figure 26

Figure 25. FIV branch map of two tandem square cylinders with the variation of reduced velocity (Ur) and spacing ratio (L*): (a,b) DC and UC, respectively.

Figure 27

Figure 26. DNS results for two tandem square cylinders at the TR branch when Ur = 34 and L* = 3: (a,b) normalized displacements and lift coefficients of DC and UC, respectively; (c,d) amplitude spectra of normalized displacements and lift coefficients of DC and UC, respectively; (e,f) vorticity fields at t = 767 and 770.9, respectively.