INTRODUCTION
Current meat inspection procedures are designed to ensure the safety and wholesomeness of meat products for human consumption [1]. They involve visual evaluation of the health status of animals to be slaughtered, and withdrawal from the food chain of all carcases that present macroscopic abnormalities. Relevant food chain information about the flock to be slaughtered must also be provided to the slaughterhouse at least 24 h before flock arrival [2]. The need to review current meat inspection procedures has been widely acknowledged for many years [Reference Edwards, Johnston and Mead3–5]. Meat inspection has shifted from a producted-based process to an integrated approach covering the whole food chain based on risk analysis. Suggestions to modernize meat inspection started with the construction, analysis and use of epidemiological tools [Reference Berends, Van Knapen and Snijders6], and have culminated in the concept of risk assessment [5, Reference Hathaway, Pullen and McKenzie7] as an analytical tool for responsibly integrating science with public health issues and policy [Reference Hathaway and McKenzie8–Reference Cates10], and even for guiding legislated changes to improve food safety [1, 2].
In the context of food safety issues, predictive modelling can provide useful information for risk assessment and, ultimately, risk management [Reference Foegeding11]. Such a modelling approach could help to implement a risk-based meat inspection at the slaughterhouse. In particular, anticipating the risk of condemnation may be used as a tool to optimize organization of meat inspection procedures, either by helping to focus on animals expected to have a high level of abnormalities [Reference Edwards12, Reference Harbers, Smeets and Snijders13] by classifying animal flocks into risk categories [Reference Stark14], or by deciding the most appropriate meat inspection procedure [Reference Hathaway, Pullen and McKenzie7, Reference Habtemariam and Cho15, Reference Meemken16], such as efficient allocation of inspection ressources [Reference Hathaway, Pullen and McKenzie7–Reference Pointon9]. Routine screening of animals prior to entry at the slaughterhouse should be based on markers of condemnation risk that are reliable and easily retrieved in order to implement a risk-based inspection. Therefore a wide range of information on pigs [Reference Harbers, Smeets and Snijders13, Reference Meemken16–Reference Harbers19], sheep [Reference Edwards12, Reference Green, Berriatua and Morgan20] and poultry [Reference Habtemariam and Cho15] was examined to determine useful predictors for meat inspection purposes.
These were usually specific to a species or country but confirmed the value of exploring a predictive modelling strategy in French broiler chicken production. A field study was therefore conducted to in order to examine the feasibility of anticipating the risk of sanitary condemnation at meat inspection by screening broiler chicken flocks for risk markers.
METHODS
Study population and study design
The target population consisted of broiler chicken flocks slaughtered in Western France. All chicken broiler flocks slaughtered during 2005, at all the European Union-licensed slaughterhouses in two regions of Western France (Bretagne and Pays de la Loire) were included. Only confined production types were included in the study as these are the major types produced in France [21].
The study was a two-step cohort design and the epidemiological unit was the flock slaughtered. A flock was defined as a group of birds placed in a same house, shipped to the same slaughterhouse and processed together on the same day. Only one flock per farm was included.
Two-stage sampling, stratified per slaughterhouse, ensured random sampling of the flocks included in the study. The primary sampling unit was the day of slaughter in a given slaughterhouse and the secondary sampling unit was the flock sequence number in the slaughtering schedule of that day. Both slaughter date and sequence number were randomly selected. In-depth descriptions of the study population, sampling design and flock random selection have been published previously [Reference Lupo22].
The first step of the study was prospective. Flocks were followed from their arrival at the slaughterhouse to completion of the post-mortem inspection. The second step was retrospective and involved the collection of on-farm information.
Data collection
Data on potential factors related to condemnation were collected for each flock, at the slaughterhouse and on-farm, through two standardized and specific questionnaires summarized in Table 1.
Table 1. Summary of data collected by the questionnairesFootnote *, for the analysis of condemnation rate
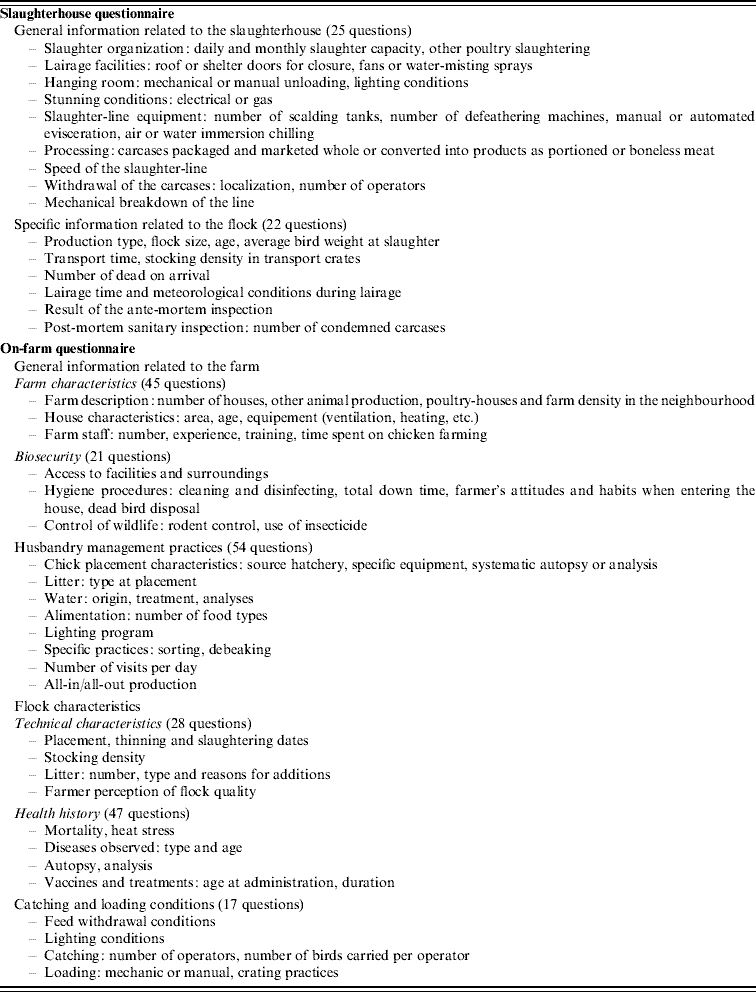
* Some elements were also collected or confirmed from official documents (on-farm records, slaughterhouse routine records, foodstuff delivery orders).
First, slaughtering data were collected by previously trained official veterinary meat inspectors during mandatory sanitary inspections (ante mortem and post mortem), and from official documents and routine slaughterhouse records. Second, farmers were contacted by mail and then by phone, to make an appointment for on-farm data collection. This consisted of an examination of on-farm records and a personal interview of about 2 h. The interviews and record examinations were carried out by four previoulsy trained, experienced investigators. Neither the farmer nor the investigator knew the condemnation rate of the flock when the farmer was interviewed.
Statistical analysis
The reliability of the model was evaluated by creating two subsamples by means of a split-sample method [Reference Picard and Berk23]. The model was developed on the development sample, representing 75% of the initial sample split at random and stratified per slaughterhouse. The predictive performance of the built model was evaluated on the remaining 25%, i.e. the validation sample.
Sample-size calculation was based on statistical considerations, using the approach proposed by Signorini for Poisson regression [Reference Signorini24], logistical and economic constraints. Based on a Type-I error of 5% and a baseline condemnation rate of 0·9% in the study population [Reference Lupo22], the study would require 300 units to detect a 20% variation in the response rate with a power of 85%.
Outcome modelling
The outcome was the within-flock condemnation rate per flock slaughtered, taking the number of post-mortem condemned carcases in a flock as numerator, and the total number of chickens slaughtered in this flock as denominator. Only sanitary condemnations were accounted for; technological condemnations, due to any processing default, were not considered [Reference Lupo22].
The condemnation rate distribution [Reference Lupo22] was analysed using a generalized linear mixed (GLM) Poisson regression model fitted with the glimmix procedure of SAS version 9.1.3 [25]. The unit of analysis was the number of condemned carcases and the offset variable was the logarithm of the flock size. Random slaughterhouse-specific intercepts were introduced to account for clustering at the slaughterhouse level [Reference Lupo22]. An overdispersion component was also added to the variance function to model a residual-type random effect with a Cholesky parametrized covariance structure [Reference Lindstrom and Bates26].
In the initial screening step, a GLM Poisson regression analysis was conducted separately, introducing each explanatory variable as a fixed effect, containing a forced-in confounder representing production type. This variable was forced to remain in the model to prevent a potential confounding bias, since earlier results had shown that the condemnation rate differed significantly according to broiler production type [Reference Lupo22, Reference Herenda and Jakel27].
The number of categories of qualitative explanatory variables was limited to ensure minimal category frequencies of 10%. The linearity assumption was tested for all continuous explanatory variables and, when violated, the corresponding variable was categorized. Cut-points were based on groupings of logical categories or on categories which reflected the changes in regression estimates. Only variables with <15% missing values were considered for further analysis.
Variables significant at Wald-type-3 P<0·20 in the screening analysis were selected for entry into the multivariate model step. Any strong collinearity (χ2 test, P<0·05) between explanatory variables was checked, and the most significant variable or the one most biologically related to the outcome variable was chosen.
Missing values of the selected explanatory variables were replaced before the multivariate analysis using multiple imputation, implemented in the IVEware program [Reference Raghunathan, Solenberger and Van Hoewyk28, Reference Raghunathan29] for SAS. All complete variables, including the outcome variable, were used when creating five imputed datasets. The application of multiple imputation to the present data has been extensively detailed elsewhere [Reference Lupo30].
The imputed variables were included in a multivariate GLM Poisson regression model, fitted with a manual backward-selection procedure (Wald's test, P<0·05). Confounding was assessed by checking that the discarded variables induced changes of <25% in the estimates of the other variables. All two-way interactions between significant variables were tested in the final model. This procedure was simultaneously conducted for each of the five imputed datasets. The results of these five regressions were then combined into a single set of estimates using the mianalyze procedure of SAS.
The exponentiated regression estimate (eβ) was interpreted as an incidence rate ratio (IRR), representing the proportional increase in condemnation rate for a unit change in the explanatory variable [Reference Dohoo, Martin and Stryhn31].
The overall fit of the model was visually assessed from plots of Pearson residuals against the predicted values for the condemnation rate and a Q–Q plot, where the Pearson residuals were plotted against the quantiles to diagnose the assumed normal distribution. The characteristics of observations with the largest and smallest Pearson residuals were examined.
Evaluation of model reliability
The measures of predictive performance in the development and validation samples were used to evaluate the apparent validity and the internal validation of the model, respectively.
Calibration [Reference Harrell, Lee and Mark32] was measured by plotting the predicted value of condemnation rate obtained from the final model against the observed condemnation rate for the sample, and by calculating the Pearson correlation coefficient between the predicted and observed condemnation rates. The predicted and observed cumulative density functions were then compared visually to evaluate the fit of the model and examine any miscalibration. The mean squared error of the estimate [Reference Harrell, Lee and Mark32] was also measured.
The discrimination ability of the model, i.e. classification of a flock into low- or high-condemnation-rate groups, was evaluated using receiver-operating characteristic (ROC) analysis. Various arbitrarily chosen cut-points for condemnation rate were used to assess model performance in terms of sensitivity and specificity.
RESULTS
Sampled population and descriptive statistics
A total of 404 chicken broiler flocks were included in the study from the 15 participating slaughterhouses. Each slaughterhouse included 27 flocks on average during the year, at an average rate of three flocks per month. Of the 404 farmers contacted, 375 agreed to take part, representing a participation rate of 92·8%, and 29 refused a visit, mainly claiming lack of time. On average, visits were scheduled 23 days after slaughtering. Main flock characteristics (production type, age and weight) have been described previously [Reference Lupo22].
The development sample consisted of 311 flocks and the potential explanatory variables are described in Table 2. The remaining 93 flocks were kept as the validation sample.
Table 2. Definition and distribution of explanatory variables for the condemnation rate retained at the univariate analysisFootnote * before the imputation of missing data, chicken broiler flocks, France, 2005
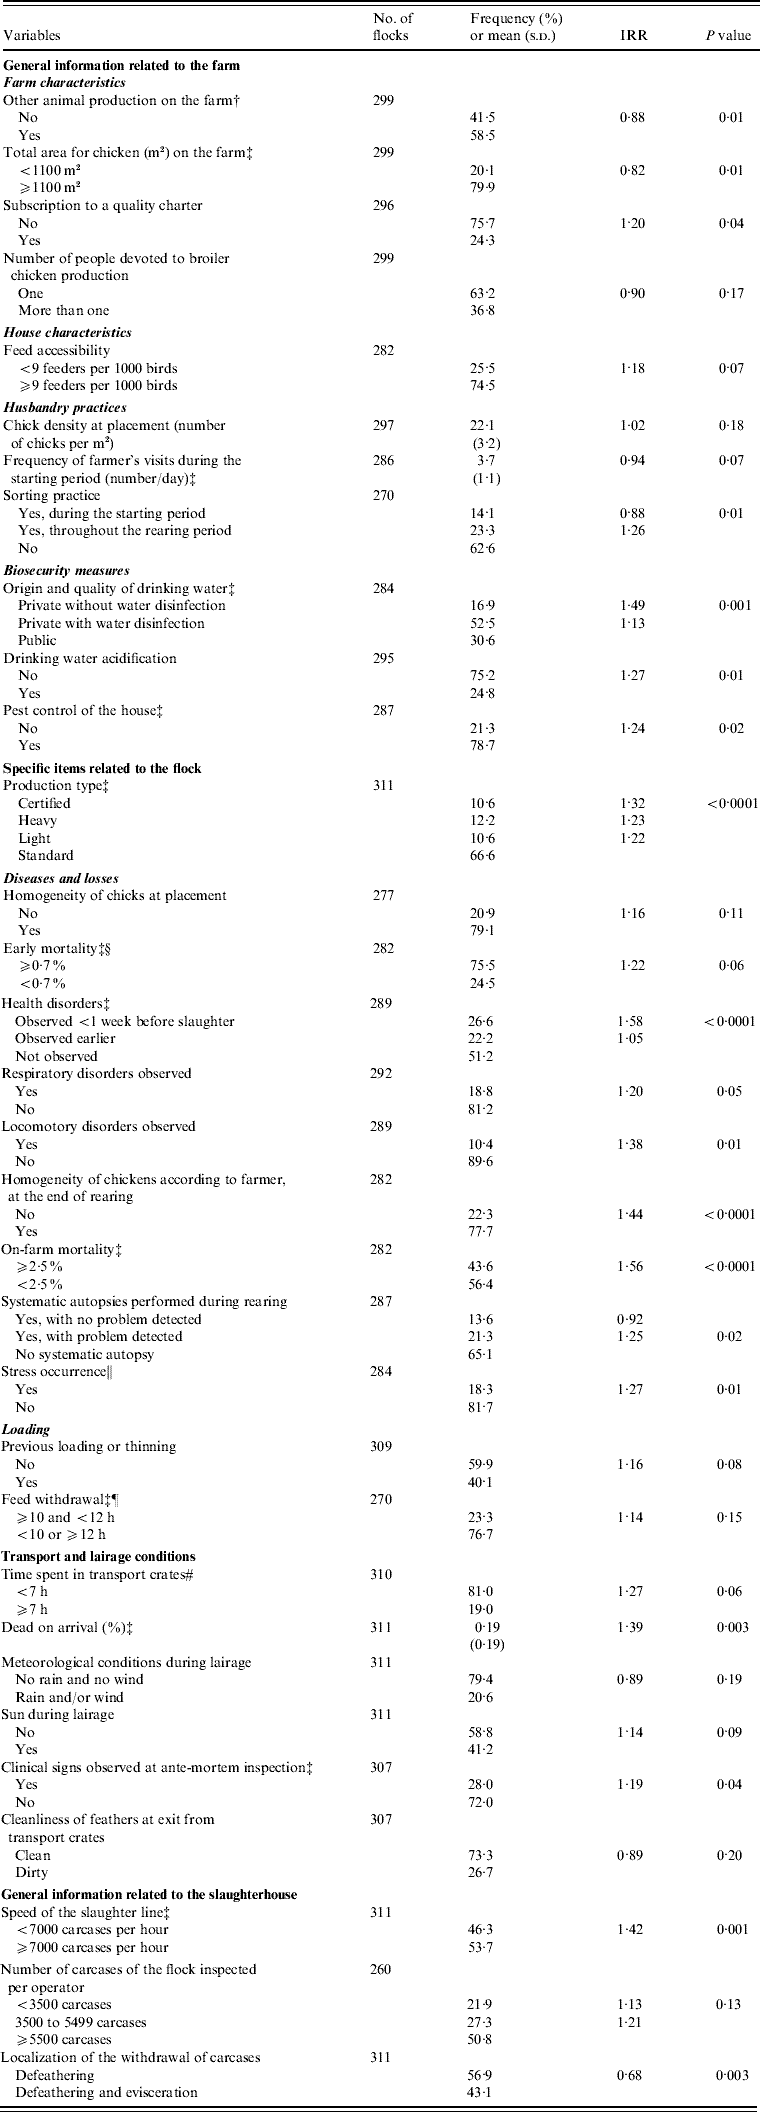
s.d., standard deviation; IRR, incidence rate ratio.
* Mixed Poisson regression adjusted for production type.
† Cattle, pigs, sheep, goats, rabbits or other poultry productions.
‡ Variables introduced in the multivariate model.
§ During the first 10 days following placement.
∥ For example: heat stress, feed chain failure.
¶ Average time between removal of feeders and slaughter of birds.
# Average time between departure from farm and slaughter of birds.
The average condemnation rate, accounting for sampling design, was 0·89% (95% CI 0·80–0·99, range 0·03–5·67) for the development sample, and 0·85% (95% CI 0·71–0·99, range 0·08–3·57) for the validation sample. The average condemnation rate for the 29 non-participating flocks was 0·69% (range 0·03–2·78). Neither average condemnation rate nor other flock characteristics on arrival at the slaughterhouse, showed any significant variation in regard to farmer participation status (Mann–Whitney U test, P=0·72).
Factors associated with condemnation
After adjusting for production type, 32 variables were associated with condemnation rate at the univariate analysis step (Table 2). Eleven of these variables were related to information pertaining to the farm management, structure and practices, 12 were related to the specific on-farm history of the flock and its features, six were related to flock transport and lairage conditions, and three were related to slaughterhouse features.
The final model consisted of six explanatory variables (Table 3). The risk of condemnation was increased for certified and heavy production types (i.e. production types with a longer rearing period) and when a health disorder occurred shortly before slaughter. Similarly, a high total on-farm mortality rate and a high mortality rate in the transport crates were associated with an increased risk of condemnation. Conversely, the more the farmer visited his flock during the starting period, the lower the risk of condemnation was. A low slaughter-line speed was also associated with a higher risk of condemnation. No statistical interactions were detected between the variables in the final model whereas confounding between production type and slaughter-line speed was noted.
Table 3. Final multivariable mixed Poisson model for the condemnation rateFootnote *, chicken broiler flocks (n=311), France, 2005
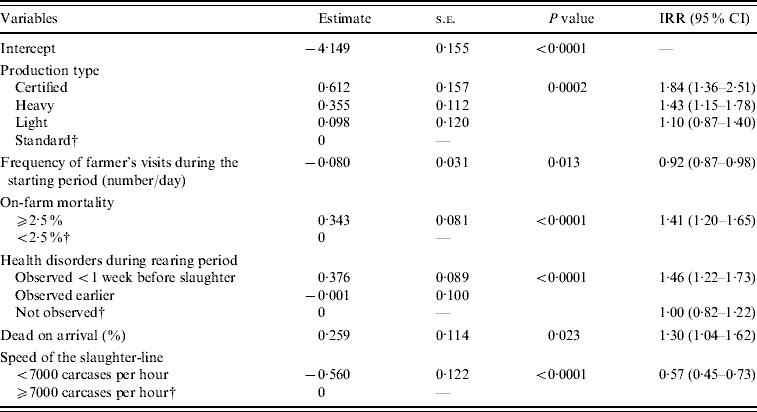
s.e., Standard error; IRR, incidence rate ratio adjusted on the other variables introduced in the model; CI, confidence interval.
* Generalized χ2=11 989, model d.f.=305, random effect (variance between slaughterhouses)=0·187, s.e.=0·045.
† Reference group.
The Pearson residuals, plotted against the predicted values of condemnation rate, showed a random distribution and the Q–Q plot of the Pearson residuals showed an approximate normal distribution for the residuals.
Flocks with extreme residuals had higher condemnation rates (P=0·03), but did not significantly differ from the correctly predicted flocks for other characteristics (e.g. season, average weight at slaughter, sequence number in the slaughtering schedule).
Model performance evaluation
The association between predicted and observed values of condemnation rate is shown in Figure 1 for apparent validity and internal validation. A greater level of disagreement was apparent between the observed and predicted values at high condemnation rates than at low condemnation rates. Pearson correlation coefficients of 0·62 (P<0·0001) and 0·40 (P<0·0001) between predicted and observed values were found in the development sample and the validation sample, indicating a marked and a moderate degree of correlation respectively.
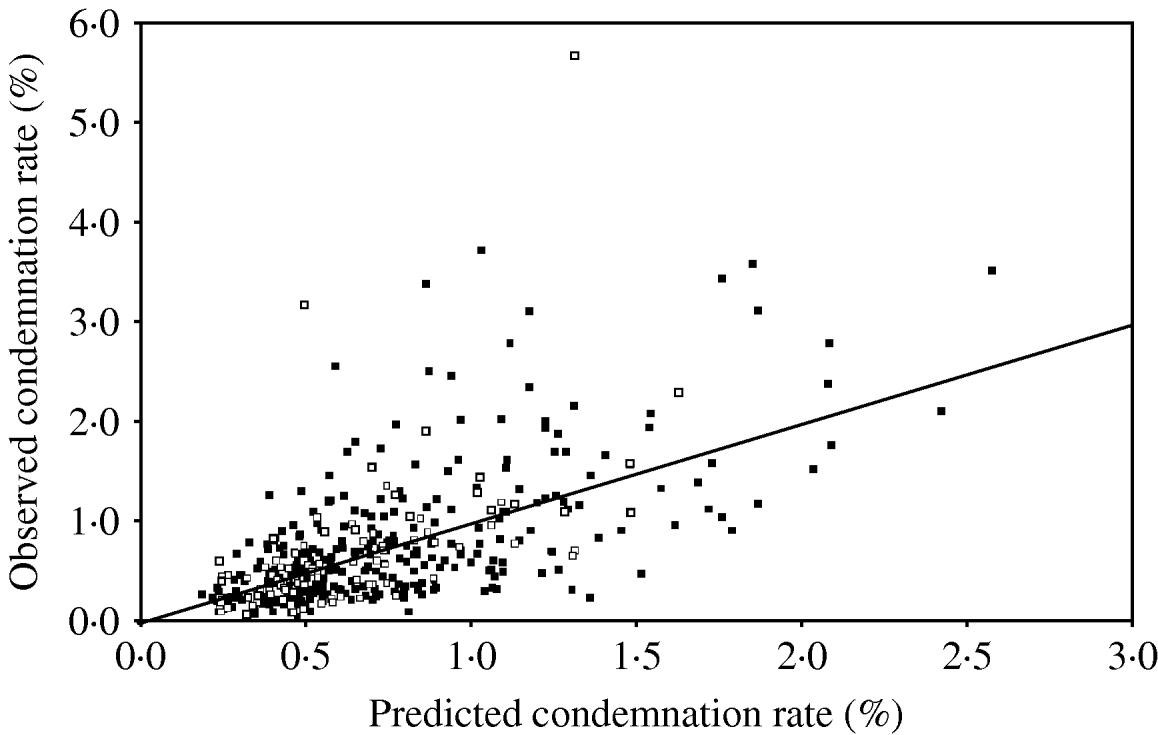
Fig. 1. Apparent validity (▪; n=311) and internal validation (□; n=93) of the model, given by plotting the observed and the predicted condemnation rates of broiler chicken flocks, France, 2005 (data must overlay solid line for perfect agreement).
Comparison of the predicted and observed cumulative density functions showed that extreme values of condemnation rate were under-predicted by the model (Figs 1 and 2). The mean squared error of the model was 0.27 for the development sample and 0.37 for the validation sample.
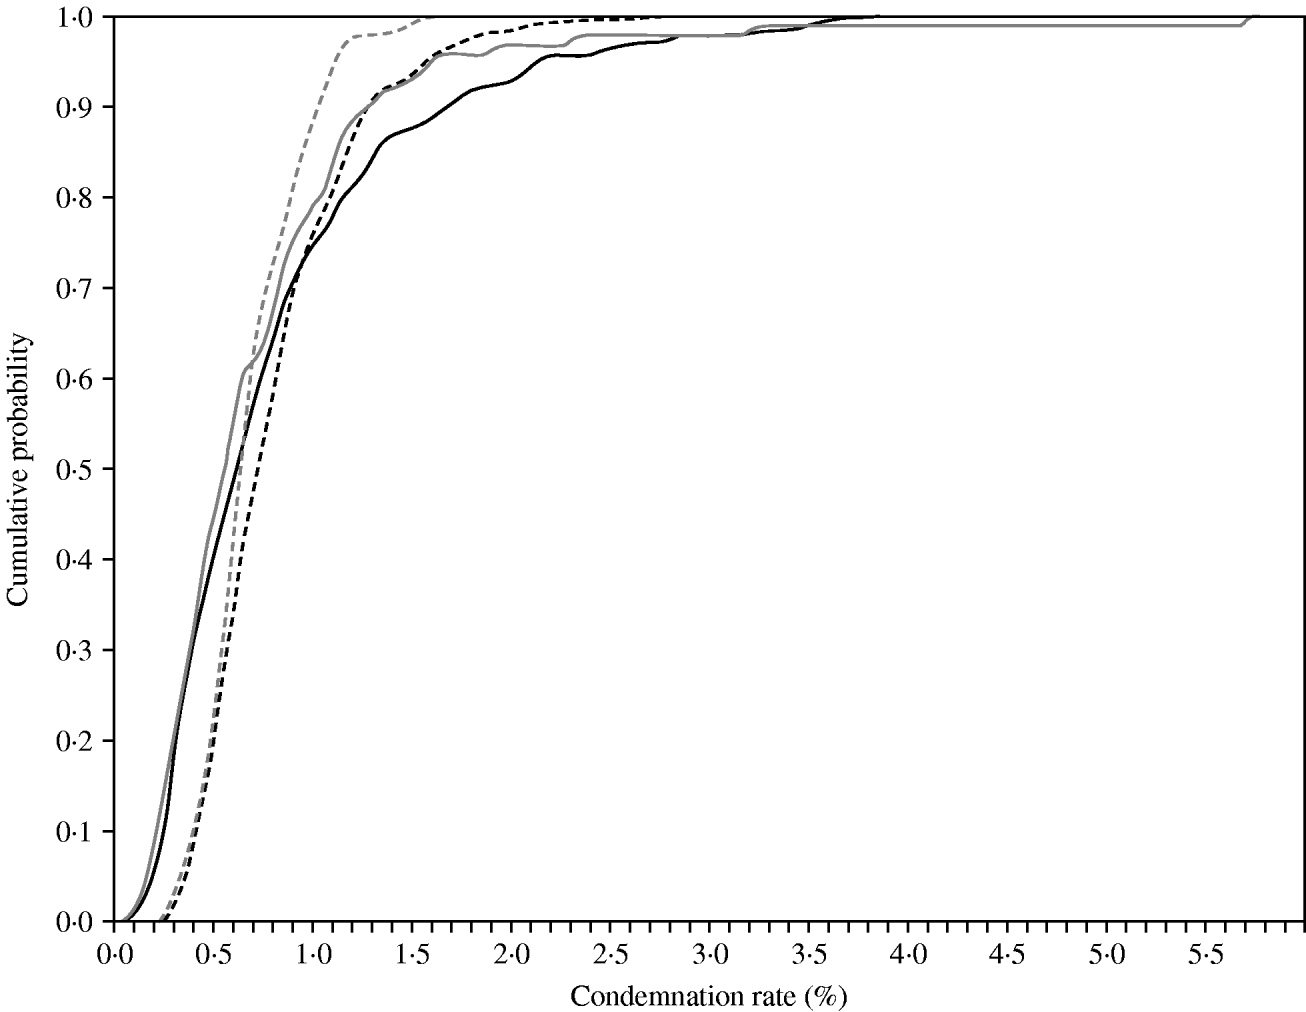
Fig. 2. Apparent validity (black lines, n=311) and internal validation (grey lines, n=93) of the model, given by the comparison of observed (solid lines) and predicted (dashed lines) cumulative density functions for condemnation rate of broiler chicken flocks, France, 2005.
The optimal combination of model sensitivity and specificity was 0·77 and 0·78, respectively, corresponding to a cut-point of 0·6% for the condemnation rate. The overall correct classification probability was 77·4%.
DISCUSSION
Study design and limitations
The study involved 404 chicken broiler flocks representing about 1·7% of the total flocks processed in the 15 participating European Union-licensed slaughterhouses that slaughter about 60% of the national production [21]. A representative sample of chicken broiler flocks was obtained by a two-stage random-sampling method to ensure data representativity and limit selection bias at the slaughterhouse [Reference Lupo22].
Multiple imputation of missing data has allowed us to use all collected information, to conduct analysis without any loss of statistical power or bias introduction, and to obtain parameter estimates with an appropriate measure of uncertainty [Reference Rubin33]. The high farmer participation rate has minimized the potential impact of the missing data. Neither condemnation rate nor flock data collected at the slaughterhouse showed any significant variation according to farmer participation status, therefore we assumed that the sample of flocks from participating farmers was representative of the initial sample.
The well-known recommendations to ensure good data collection [Reference Martin, Meek and Willeberg34] were applied to minimize information bias. All the investigators (i.e. at the slaughterhouse and on-farm) were experienced. Several investigators were involved in data collection, notably at the slaughterhouses, and all had received prior training in questionnaire completion. The questionnaires were standardized, pilot versions that had been tested before the study and a guide to questionnaire completion was available.
Given the declarative nature of the data collected during the on-farm interview and to reduce recall bias, the visit to the farmer was scheduled during the down-time before arrival of the new flock. The validity and reliability of the declared data were assessed by cross-comparison with information from the farm book or invoice records.
Previous results have shown a significant variation in condemnation rate according to broiler production type [Reference Lupo22, Reference Herenda and Jakel27], which is closely correlated with several variables related to chicken age and average weight at slaughter, farm characteristics, certain husbandry practices (e.g. chick density at placement) or loading features (e.g. thinning practice). Potential confounding bias was addressed by forcing the production type to remain in the model in all steps of the analysis, leading to an IRR adjusted to production type for each explanatory variable. Moreover, the specific and indivisible practices related to production type were introduced as a single variable in order to build the most parsimonious model.
Lack of independence of observations arose from the significant heterogeneity for risk of condemnation between slaughterhouses, since the flocks were brought in from different geographic localities or from different producers using similar farm management strategies. The differences may also be attributable to potential inconsistencies in condemnation diagnosis between inspectors at different slaughterhouses [Reference Edwards12, Reference Lupo22, Reference Saint-Hilaire and Sears35]. A GLM model incorporating both fixed and random effects was used to handle such dependent data.
Factors associated with condemnation
Little information has been published on the factors associated with overall condemnation in broiler chickens [Reference Habtemariam and Cho15]. Previous publications have mostly dealt with condemnation for cellulitis [Reference Elfadil, Vaillancourt and Meek36–Reference Schrader, Singer and Atwill38], which is not an official condemnation reason in France, and caution is required in any direct comparison of the results.
The multifactorial origin of condemnation [Reference Saint-Hilaire and Sears35] was emphasized by the fact that six variables contributed to the variations in condemnation rate in the present study: one was related to husbandry practices, three to flock characteristics or health history, one to transport features and one to slaughterhouse characteristics.
Numerous visits by the farmer during the starting period were associated with a decreased risk of condemnation. The frequency of visits may reflect the farmer's attention to ensure adequate rearing conditions, and his general ability to breed chickens, this variable being notably correlated with the application of biosecurity measures (e.g. pest control of the chicken house).
Certified and heavy production types presented higher condemnation rates. These are reared for longer than light and standard production types [Reference Lupo22]. Similar differences in overall condemnation rates were previously observed between three production types, with organic chickens, reared under similar production conditions to the French certified type, presenting a higher condemnation rate than standard chickens [Reference Herenda and Jakel27].
The condemnation rate was higher in flocks in which a health disorder had occurred shortly before slaughter. The resulting lesions, particularly if they were recent and probably related to acute evolution of a disease, would lead to a higher condemnation rate at the slaughterhouse than health disorders occurring earlier in life.
The condemnation rate was higher in flocks with a high on-farm mortality rate. A similar association was observed in French male turkey broiler flocks (C. Lupo et al., unpublished observations) and in a univariate analysis of Canadian chicken broilers [Reference Elfadil37]. A high on-farm mortality rate would indicate poor flock health status and be more likely to lead to condemnation at the slaughterhouse. This is consistent with the disease rate variable derived from necropsies of poultry, which is reported as one predictor in a model of the condemnation prevalence for disease conditions in broiler chickens [Reference Habtemariam and Cho15].
Flocks with a high rate of mortality during transport in crates had a higher condemnation rate, in agreement with Canadian results at the univariate analysis [Reference Elfadil37]. In-crate mortality was reported to be related to poor conditions of transport, such as high stocking density within the crates [Reference Nijdam39]. In addition to losses due to mortality, the flocks transported under poor conditions may be likely to present congested carcases, leading to higher condemnation rates at meat inspection.
The condemnation rate was higher when the slaughter-line speed was low. The rapidity of the slaughter-line might imply that meat inspectors need to remain constantly alert and make quick decisions. At higher speeds, the inspector may have less time to detect abnormalities, leading to lower rates of condemnation. However, a confounding effect was observed between production type and slaughter-line speed. Of note, all light chickens were processed in slaughterhouses with the highest slaughter-line speeds. This may be due to the specialization of some slaughterhouses in light-chicken production for specific commercial markets.
The resulting model consisted of simple, consistent and biologically relevant factors, which could easily and routinely be collected in the field. In addition, as only three of the six variables had missing data, the final model was considered to be robust with any potential selection bias minimized as much as possible. Given the sample size in this study (n=311), the global modelling analysis was able to detect a 20% variation in condemnation rate with a satisfactory power of 85%. The magnitudes of variation in condemnation rate for all variables in the final model were >20% (i.e. IRR<0·80 or IRR>1·20), except for the frequency of farmer's visits during the starting period, for which a smaller variation in condemnation rate (8%) was observed. Thus, although the six factors in the final model did not constitute an exhaustive list of the markers for condemnation risk in chicken broiler flocks, this study has still provided a reliable set of acute variables related to the risk of condemnation.
The applicability of the model for prediction purposes then required testing in order to determine its reliability.
Predictive modelling of the condemnation rate
The model gave correct performance measures for the average predictions but under-predicted the extreme values of condemnation rate, reflecting differences between flocks which were not captured by the characteristics of the current model. This miscalibration could not be reduced by examining the poorly predicted flocks, as no specific collected characteristics different from those of the correctly predicted flocks were identified.
Thus it was not entirely possible to accurately predict the condemnation rate for a given flock based on information about primary production. Similarly, it was not been feasible to predict the percentage of post-mortem abnormalities in deliveries of pigs [Reference Harbers, Smeets and Snijders13].
The condemnation rate was kept as a continuous outcome in the adopted modelling strategy whereas it would have been categorized initially. Indeed, it was considered important to allow for modification of the cut-point value, in order to provide a variety of options depending on the aims of the model application. Based on the optimal performances of the model, about 80% of the chicken flocks would be classified in the correct condemnation group. Discriminating groups of animals, ranging from low to high condemnation rates, had been previously suggested and various conclusions were drawn. Different linear discriminatory models with different arbitrary thresholds were proposed to classify a chicken flock into a high or low condemnation group at the time of processing, and the probability of overall correct classification was very high, ranging from 91·9% to 94·6% [Reference Habtemariam and Cho15]. Lower discriminatory ability was observed for a similar model in French male turkey broiler flocks, in which sensitivity and specificity were 80·0% and 74·4%, respectively (C. Lupo et al., unpublished observations). In pigs, fattening herds could be classified according to the expected presence or absence of post-mortem abnormalities [Reference Harbers19], whereas the predictability of the appropriate decision for meat inspection provided by information about the health status of pig herds was poor [Reference Meemken16]. Similarly, in lambs the feasibility of using information about health and farm management to formally predict the risk of presence or absence of abnormalities at meat inspection was not fully demonstrated [Reference Edwards12].
The overall condemnation rate captures several reasons for condemnation [Reference Lupo22] for which the sets of predictors may differ, as previously observed in other animal production [Reference Edwards12]. The identification of significant predictors might be more efficient if focusing on homogenous reasons for condemnation. Improvement of the modelling approach would benefit from accounting for the composite nature of the condemnation process. However, with regard to the study objective, the overall percentage of carcases condemned for sanitary reasons was considered as the outcome to model as an indicator of carcases unfit for human consumption, i.e. requiring an intervention to be withdrawn from the food chain.
Although this study has not produced an absolutly accurate predictive model for the risk of condemnation in chicken broiler flocks, it does provide useful information for the scientific understanding of its determinants. Due to the multifactorial aspect of condemnation, these findings could be used at all stages of chicken production. Provision of feedback on flock classification and condemnation rate to the farmer should help in monitoring or improving husbandry practices on the farm [Reference Edwards12], as previously demonstrated in lambs [Reference Paton40]. Measures to minimize the impact of transport conditions could also be implemented. Finally, this model may help to anticipate the inspection organization, by adjusting logistics features (e.g. modulation of the slaughter-line speed) or by optimizing the allocation of inspection resources [Reference Hathaway and McKenzie8], according to the expected number of carcases to withdraw from the food chain. Classifying flocks between high- or low-condemnation risk categories [Reference Stark14], even grossly, may allow meat inspectors' attention to focus on the examination of carcases in which adverse conditions are suspected [Reference Edwards12, Reference Harbers, Smeets and Snijders13]. The risks markers may be easily and routinely retrieved for modelling before birds are processed from an existing regulatory document, which transmit food chain information and must be provided before flock arrival at the slaugtherhouse [2]. The reliability of such information and the impact of declaration bias on the classification model performance would therefore need to be evaluated.
ACKNOWLEDGEMENTS
The authors thank the French Ministry of Agriculture and Fisheries and the Office de l'Elevage for funding this research project, the Official Veterinary Services for the extensive data collection, and the farmers and the slaughterhouses for their participation in the survey.
DECLARATION OF INTEREST
None.


