The prevalence of obesity has been increasing steadily in both the developed and the developing world(Reference Ogden, Flegal and Carroll1, Reference Costa, Cintra and Fisberg2). In the latter, the increase in obesity in most countries has been concomitant with a decrease in undernutrition and mortality from infection(3). Several studies have dealt with the burden of obesity in national health systems. Obesity is a risk factor for diabetes, hypertension and CVD, and has been shown to impose a heavy burden in terms of disability-adjusted life years lost to the disease(Reference Must, Jacques and Dallai4).
In Chile, malnutrition has all but disappeared. During the last four decades, infant mortality dropped from 150/1000 live births in 1970 to less than 7/1000 in 2007(3). The causes for this decline are multiple, including improvement in sanitation, a decrease in fertility, the implementation of feeding programmes for women and children, and others. The nutrition survey conducted by the Interdepartmental Committee on Nutrition and National Defence (ICNND) in 1960 showed that 8·3 % of children aged 15–24 years were obese (weight/height index >120 %)(5). Data from the Ministry of Education, which measures weight and height of all children entering basic school (age 6–7 years) in the country, show that their obesity prevalence (BMI >95th percentile) has trebled in the last 20 years, rising from 5·5 % to 22·2 % between 1988 and 2007, respectively(6).
Data on the prevalence of obesity in older Chilean children are scarce. The National Health Survey held in 2003 showed that 27 % of people aged 17 years and older were obese (BMI > 30 kg/m2) and 38 % were overweight (BMI = 25–30 kg/m2). Children younger than 17 years were not studied(7).
Data on food intake and physical activity (PA) in children are also limited, the majority of studies being done on children of low socio-economic level (SEL) and with qualitative data on food intake. Olivares et al. assessed food intake by means of a quantitative food register in 1700 Chilean children aged 8–13 years. Only five food items were evaluated, showing a high intake of snacks and sweetened beverages and a low intake of dairy products, fruits and vegetables. Children spent at least 3 h daily watching television during weekdays and double that amount during the weekend(Reference Atalah, Urteaga and Rebolledo8, Reference Olivares, Kain and Lera9).
In terms of studies of food consumption in Chile, the first nutrition survey performed at the national level was the ICNND survey in 1960. After that, a national survey was performed in 1974 but it was never published in its entirety. Most information on food consumption in older children comes from relatively small studies that usually are not representative of the population.
Therefore the purpose of the present work was to study the prevalence of overweight and obesity in Chilean children aged 9–12 years from schools from the metropolitan region of Santiago and to correlate this prevalence to SEL, food intake and PA.
Materials and methods
The survey sample consisted originally of 1800 children from the 5th and 6th grade attending public and private schools representative of the population of the metropolitan region of Santiago, Chile. The data were collected from March to June 2007. Sixty-eight children were not measured since they did not comply with the inclusion criteria (mainly due to failure of their parents to sign the informed consent), so the final sample size was 1732 children aged 9–12 years of whom 51·6 % were boys. Schools were selected by the School Vulnerability Index (SVI), which ranks the institutions according to SEL(10). Inclusion criteria were children of both sexes, attending the 5th and 6th grade in basic schools that covered the range of SEL (private, subsidized and municipal schools), who agreed to be assessed and whose parents signed an informed consent. Children who presented with any condition that could alter anthropometric measurements or food intake were excluded from the study. The study was approved by the Human Investigation Committee of the Catholic University of Chile.
Nutritional status
Nutritional status was determined by BMI adjusted for age using the Centers for Disease Control and Prevention/National Center for Health Statistics (2000) growth charts. Cut-off points were: underweight, BMI < 10th percentile; normal, BMI ≥ 10th to <85th percentile; overweight, BMI ≥ 85th to <95th percentile; obese, BMI ≥ 95th percentile(11).
Anthropometry
Weight and height were measured with a DETECTO model 2391 scale (Webb City, MO, USA) with an attached stadiometer (precision 100 g and 0·1 cm, respectively). Skinfold thickness was measured with a Harpenden calliper (West Sussex, UK), range 0–100 mm, which exerts a constant pressure of 10 g/mm2. Triceps skinfold thickness was determined in the middle point between the acromion and the olecranon in the relaxed forearm. Subscapular skinfold thickness was measured under and inside the scapula with relaxed arm and shoulder. All measurements were made by a nutritionist (Y.L.) certified by the International Society for the Advancement of Kinathropometry.
Fat mass was calculated by the Slaughter formula which considers age, triceps and subscapular skinfold thicknesses(Reference Slaughter, Lohman and Boileau12). This formula was chosen since it represents the best correlation with measurements obtained by dual-energy X-ray absorptiometry, considered the ‘gold standard’ to measure body fat mass(Reference Rodríguez, Moreno and Blay13).
Food intake
Food consumption was measured by means of a 24 h recall that was quantified and analysed in the Food Processor 7·9 software program (ESHA Research, Salem, OR, USA), which has previously been validated for Chilean foods(Reference Castillo, Rozowski and Muñoz14). All interviews were performed by the same nutritionist in a personal meeting with the children. Energy intake was compared with the FAO/WHO/United Nations University recommendations to assess adequacy(15). Macro- and micronutrient intakes were compared with the recommendations of the Food and Nutrition Board, Institute of Medicine(16–19). Food intake was compared with the recommendation of the Chilean Ministry of Health(3).
Physical activity
For determination of the level of PA, a questionnaire previously validated by Burrows et al. was used(Reference Burrows, Diaz and Sciaraffia20). This survey is composed of five activities (recumbent, seated, walking, playing outdoors, sports) which translate into a PA score of 0–10 points to classify levels of activity as bad (score = 0–3), regular (score = 4–6) or good (score = 7–10) according to the hours spent in different activities. The PA score was compared with a 3 d accelerometer measurement in seventy-seven of ninety-three children (thirty-five obese and forty-two non-obese). Accelerometry was significantly associated with PA score (P = 0·008), playing outdoors (P = 0·0009) and practising sports (P = 0·003).
Socio-economic level
The schools were classified according to the SVI, calculated by the Chilean National Organization for School Help and Fellowships (JUNAEB), which measures the SEL of each school as an institution. In addition to the SVI we applied the European Survey (ESOMAR) socio-economic scale to each child, which is restricted to activity and education of the breadwinner(21). This instrument classifies SEL as very high (a), high (b), middle-high (ca), middle (cb), middle-low (d) and low (e). The results are shown as a+b, ca, cb, d and d+e.
Statistical analyses
Continuous variables are shown as mean and standard deviation, while categorical variables as the number of cases and percentage. Student’s t test and the χ 2 test were performed for comparison of mean and proportions, respectively. For the comparison of more than two variables, one-way ANOVA and the t test for multiple comparisons with Hochberg correction were performed. Significant P value was set at 0·05. Data processing and statistical analyses were done with the SPSS statistical software package version 15·0 (SPSS Inc., Chicago, IL, USA).
Results
A general description of the children in the study is shown in Table 1. There were no significant differences between males and females except in height and percentage fat mass. Based on the BMI cut-off points shown above, 59 % of the children were classified as normal weight, 22 % as overweight, 17 % as obese and 2 % as underweight. When children were separated by gender, boys were significantly more obese than girls (21·2 % v. 12·4 %, respectively; Fig. 1).
Table 1 General characteristics of the sample: children aged 9–12 years (n 1732), metropolitan region of Santiago, Chile, March–June 2007
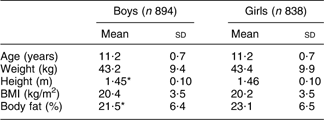
Mean values were significantly different from those of girls (Student t test): *P < 0·005.
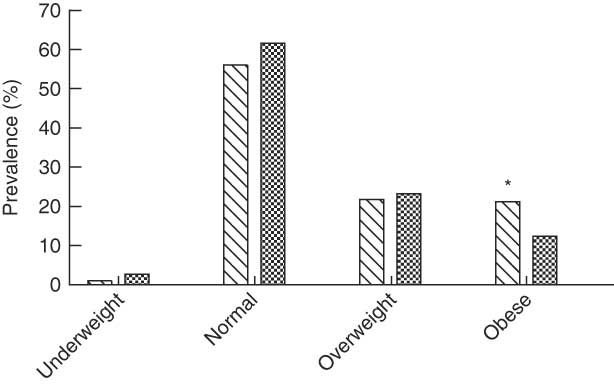
Fig. 1 Nutritional status according to sex among boys (![]() ) and girls (
) and girls (![]() ) aged 9–12 years (n 1732), metropolitan region of Santiago, Chile, March–June 2007. Nutritional status determined according to BMI-for-age using the Centers for Disease Control and Prevention/National Center for Health Statistics (2000) growth charts, cut-off points were: underweight, <10th percentile; normal weight, ≥10th to <85th percentile, overweight, ≥85th to <95th percentile; obese, ≥95th percentile. Prevalence was significantly different from that in girls: *P < 0·05
) aged 9–12 years (n 1732), metropolitan region of Santiago, Chile, March–June 2007. Nutritional status determined according to BMI-for-age using the Centers for Disease Control and Prevention/National Center for Health Statistics (2000) growth charts, cut-off points were: underweight, <10th percentile; normal weight, ≥10th to <85th percentile, overweight, ≥85th to <95th percentile; obese, ≥95th percentile. Prevalence was significantly different from that in girls: *P < 0·05
When classified by the ESOMAR socio-economic scale, 17·6 % of the sample belonged to very high and high SEL (a+b), 14·3 % to middle-high SEL (ca), 34·6 % to medium SEL (cb) and 33·5 % belonged to low or very low SEL (d+e). Figure 2 shows the nutritional status of the children in relation to SEL. Obesity was more prevalent among those with lower SEL (cb and d+e) while overweight was more prevalent in the middle-high SEL group (ca). The group with highest SEL (a) showed a 76·6 % prevalence of normal weight. The prevalence of underweight, although low in general, was double in the groups with lower SEL compared with those of higher SEL.
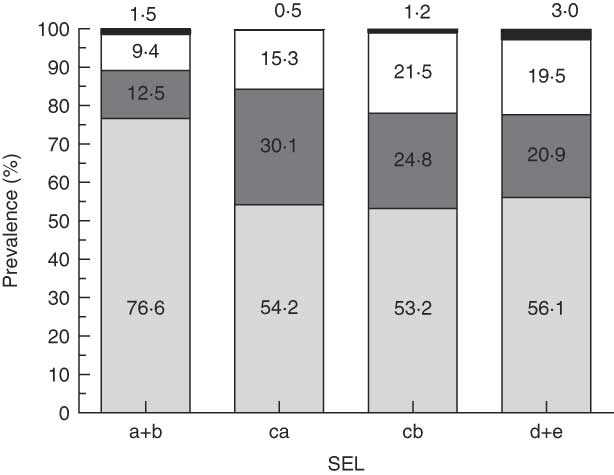
Fig. 2 Nutritional status (![]() , underweight;
, underweight; ![]() , normal weight;
, normal weight; ![]() , overweight;
, overweight; ![]() , obese) according to socio-economic level (SEL; a+b, very high and high; ca, middle-high; cb, middle; d+e, middle-low and low) among children aged 9–12 years (n 1732), metropolitan region of Santiago, Chile, March–June 2007
, obese) according to socio-economic level (SEL; a+b, very high and high; ca, middle-high; cb, middle; d+e, middle-low and low) among children aged 9–12 years (n 1732), metropolitan region of Santiago, Chile, March–June 2007
The PA score was very low for all populations studied. Figure 3 shows that 65·4 % of the total population was sedentary, 33·9 % had regular PA and only 0·7 % showed a good level of PA, with no significant differences between boys and girls. Children from high SEL were significantly more active than children from lower SEL. No significant differences were observed in PA related to nutritional status (data not shown).
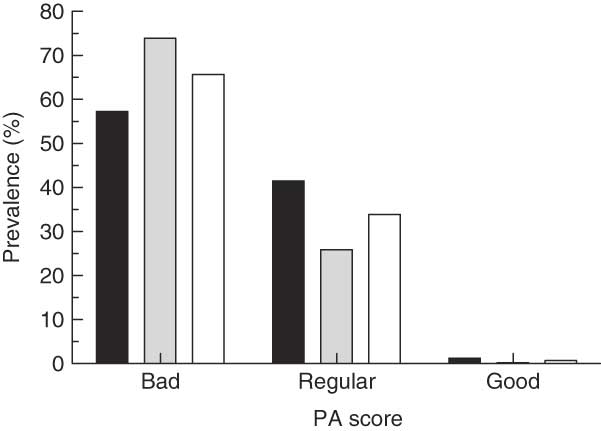
Fig. 3 Level of physical activity (PA) according to sex (![]() , boys;
, boys; ![]() , girls) and in the total population (
, girls) and in the total population (![]() ) among children aged 9–12 years (n 1732), metropolitan region of Santiago, Chile, March–June 2007. PA score derived from a survey of five activities (recumbent, seated, walking, playing outdoors, sports), translating into a PA score of 0–10 points, to classify levels of activity as bad (score = 0–3), regular (score = 4–6) or good (score = 7–10) according to the hours spent in the different activities
) among children aged 9–12 years (n 1732), metropolitan region of Santiago, Chile, March–June 2007. PA score derived from a survey of five activities (recumbent, seated, walking, playing outdoors, sports), translating into a PA score of 0–10 points, to classify levels of activity as bad (score = 0–3), regular (score = 4–6) or good (score = 7–10) according to the hours spent in the different activities
Table 2 shows the consumption of energy and macronutrients according to PA. Higher PA score was significantly associated with a higher intake of energy, protein, total fat and MUFA. High PA also correlated with a higher intake of Ca, P, K, Zn, vitamin A, niacin, vitamin B6, vitamin B12 and vitamin D (data not shown).
Table 2 Energy and micronutrient consumption according to level of physical activity (PA) among children aged 9–12 years (n 1732), metropolitan region of Santiago, Chile, March–June 2007

a,bMean values within a row with unlike superscript letters were significantly different (ANOVA with Hochberg correction). P < 0·05.
†ANOVA.
Table 3 shows the relationship between energy and macronutrient intake and SEL. Energy intake was higher in both extremes of the SEL classification, while the consumption of protein, total fat, MUFA, PUFA, Ca, Mg, P, K and Zn was significantly higher in the high SEL group compared with the other groups. The lowest SEL group had a higher intake of carbohydrate, Fe, Se and Na. Paradoxically, obese children reported lower energy intake than all the other categories. Obese children also reported decreased intakes of protein, carbohydrate, fibre, total fat, SFA, MUFA, PUFA and cholesterol (data not shown).
Table 3 Energy and macronutrient consumption according to socio-economic level (SEL) among children aged 9–12 years (n 1732), metropolitan region of Santiago, Chile, March–June 2007

†a+b, very high and high; ca, middle-high; cb, middle; d+e, middle-low and low.
a,bMean values within a row with unlike superscript letters were significantly different (ANOVA with Hochberg correction): P < 0·05.
Macro- and micronutrient consumption correlated with the intake of specific foods (Table 4). Poorer groups consumed significantly more bread, sugar and legumes than the richer groups, and significantly less of other foods. No relationship was found between SEL and consumption of sweetened beverages, candy and fish. Overweight and obese children reported less consumption of dairy products, cereals, bread and fat than children of normal weight (P < 0·001; data not shown).
Table 4 Food consumption (g/d; except for sugared beverages, ml/d) according to socio-economic level (SEL) among children aged 9–12 years (n 1732), metropolitan region of Santiago, Chile, March–June 2007
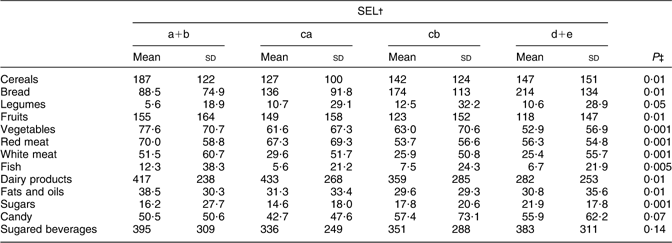
†a+b, very high and high; ca, middle-high; cb, middle; d+e, middle-low and low.
‡ANOVA.
The adequacy of food intake in boys and girls according to the recommendations of the Chilean Ministry of Health(Reference Jury, Urteaga and Taibo22) is shown in Tables 5 and 6. A low adequacy of consumption of legumes, fruits, vegetables, fish and dairy products was found in all groups.
Table 5 Adequacy of food consumption according to the recommendations of the Chilean Ministry of Health(Reference Jury, Urteaga and Taibo22) among boys aged 9–12 years (n 894), metropolitan region of Santiago, Chile, March–June 2007

Table 6 Adequacy of food consumption according to the recommendations of the Chilean Ministry of Health(Reference Jury, Urteaga and Taibo22) among girls aged 9–12 years (n 838), metropolitan region of Santiago, Chile, March–June 2007

Discussion
The prevalence of obesity found in the present study was higher in lower SEL groups while overweight was more prevalent in higher SEL groups (middle-high and high SEL). In the higher income groups normal weight was found in 80 % of children, while in the lower income groups only 56 % had normal weight. The relationship between SEL and obesity has been reviewed by Lioret et al.(Reference Lioret, Touvier and Lafay23). In Chilean schoolchildren aged 8–13 years, Olivares et al. reported that those with better SEL had less obesity than those with lower SEL(Reference Olivares, Bustos and Lera24). This pattern has been observed in many developed countries, but in developing countries the opposite is true; that is, obesity and overweight are more frequent in high income groups(Reference Groeneveld, Solomons and Doak25). In Chile, an advanced developing country in terms of the nutrition transition, we find a pattern similar to the one observed in developed countries. This may be explained by the propensity of the population to follow an occidental pattern of living, with high income groups worrying more about physical appearance than the poorer groups, especially in women(Reference Lera, Olivares and Leyton26).
Reported PA was very low in this population. Only 34·6 % reported an acceptable level of PA while 65·4 % had sedentary behaviour. PA levels were better in higher income children (60·4 %). These results coincide with those reported by Burrows et al. in a smaller group of children, who found that PA had a direct relationship with SEL(Reference Burrows, Diaz and Sciaraffia20). One explanation for these results is that children in higher SEL groups have more secure facilities for PA, so they are less constrained by their parents to stay in a secure environment like home.
In the present study we used the ESOMAR questionnaire to assess SEL. This instrument asks only two questions: (i) the type of job and position of the breadwinner; and (ii) the highest level of schooling in the adults.
No relationship was observed between nutritional status and PA in our study. However, Gillis et al. showed that self-reported PA was inversely related to obesity(Reference Gillis, Kennedy and Gillis27) and Kain et al. obtained similar results when they applied an endurance test in children (Navett test)(Reference Kain, Olivares and Romo28). A possible explanation for this discrepancy could be that Kain et al. measured endurance while we obtained our results by questionnaire.
Food intake in the present study was determined by a 24 h recall, which has been demonstrated to have a large intra-individual variation. Nevertheless, when applied to a large number of individuals, it gives a good estimation of food intake(Reference Serra Majem and Ribas29).
The majority of foreign studies on obesity have focused on finding a characteristic eating pattern in children. Muñoz et al. applied a 24 h recall to 3307 US children aged 2–19 years and also collected two food registers from these children. The authors found that only 30 % of them consumed the recommended amounts of fruits, cereals, meat and dairy and only 36 % had an adequate intake of vegetables, while just 1 % of the children fulfilled all recommendations(Reference Muñoz, Krebs-Smith and Ballard-Barbash30). Díez-Gañán et al. evaluated 1852 Spanish children from 5 to 12 years old, applying two 24 h recalls, and concluded that about 50 % of the children did not fulfil the recommendations for fruits and vegetables(Reference Díez-Gañán, Galan and León31).
Several studies in relatively small groups in Chile have shown an inadequate eating pattern in the population. Atalah et al.(Reference Atalah, Urteaga and Rebolledo8) and Yañez et al.(Reference Yáñez, Olivares and Torres32) found similar results to ours in terms of consumption by applying an FFQ in a sample of children from low SEL. This has been confirmed recently by Olivares et al.(Reference Olivares, Kain and Lera9). In a more recent study Olivares et al. measured food intake by means of an FFQ in 204 girls of medium-high SEL and 358 girls of high SEL(Reference Olivares, Bustos and Lera24). They showed that girls from high SEL groups consumed more milk, and less bread, snacks and sugared beverages, which could explain in part the reduced prevalence of obesity in this group compared with girls from lower SEL groups.
The results presented here agree with studies performed in Chile and abroad, showing a reduced consumption of fruits and vegetables, legumes, fish and dairy products and a high consumption of cereals, red and white meat, and fats and oils. An interesting aspect of our study is the marked difference in food consumption according to SEL. Children in the high SEL group, who presented less obesity prevalence, reported a healthier consumption pattern, while low SEL children consumed more bread, sugar, legumes and showed a tendency to a higher intake of sugar and other caloric sweeteners.
The eating pattern found in the present study showed that boys had a higher consumption of energy and macronutrients than girls, most certainly due to the difference in size, as has been shown in other studies(Reference Aeberli, Kaspar and Zimmermann33, Reference Crespo, Smit and Troiano34).
The differences observed in nutrient intake were reflected when we determined the total energy value of the diet. Children in high SEL groups consumed a higher proportion of energy from protein and fats (mainly mono- and polyunsaturated) than low SEL children (protein 15·4 % v. 13·0 %; fat 28·5 % v. 26·6 %, respectively) and a lower proportion from carbohydrate (56·6 % v. 60·9 %, respectively), which has also been described in other countries in Latin America(Reference Gamboa, López and Vera35). This pattern has a direct relationship with family income since the foods that provide protein and fat have a higher price, while those foods that are cheaper contain a higher proportion of carbohydrate. Actually, foods that contribute a high proportion of carbohydrate show a closer relationship with the development of obesity in infants and children(Reference Malik, Schulze and Hu36–Reference Stefanik, Heald and Mayer38).
In the present study obese children reported less energy consumption than lean ones. This has also been reported by Fisher et al.(Reference Fisher, Johnson and Lindquist39). These results could be associated with errors in the estimation of portion sizes, the use of inaccurate methods of measurements of food intake or false report of consumption. It also could be due to advice received by them to reduce energy intake. We used a 24 h recall survey applied by a trained nutritionist who interviewed all the children to minimize possible errors. Nevertheless, it is possible that obese children, consciously or unconsciously, may forget foods eaten between meals or consuming high-energy snacks.
Compared with FAO recommendations the intake of macronutrients was deficient except for protein. Although a 75 % adequacy does not mean that the diet is necessarily deficient, fibre intake was only about half of the recommended amount.
The adequate intake of micronutrients has been given importance in recent years in developing countries since a high consumption of energy does not guarantee an appropriate intake of micronutrients(Reference Troiano, Briefel and Carroll40–Reference Troiano and Flegal42). There are very few studies in Chile that have looked at micronutrient intake in children. Actually, international studies are also scarce. Using a 24 h recall survey and two food registers in 150 Swiss children aged 6–14 years, Aeberli et al. found a deficient intake (25 % adequacy) of vitamin D(Reference Aeberli, Kaspar and Zimmermann33). On the other hand, Muñoz et al. used the same methodology in 3307 North American children aged 2–19 years and found that only 1 % had adequate food consumption(Reference Muñoz, Krebs-Smith and Ballard-Barbash30). In Colombia, Gamboa et al. reported a low intake (50 % adequacy) of Ca and vitamin B6 in 258 schoolchildren of low SEL using a 24 h recall(Reference Gamboa, López and Vera35). In our study the adequacy of micronutrients was good, except in the case of Ca, K, biotin, vitamin A and vitamin D in both sexes. The low consumption of Ca reported here has also been observed in other studies in Chile(Reference Yáñez, Olivares and Torres32).
Consumption of micronutrients according to SEL showed a higher intake of Ca, P, K and Zn in the high SEL (a+b) children, while children from the lowest SEL groups (d+e) showed a higher intake of Fe, Se and Na. The high SEL groups showed a higher intake of vitamins A, C, D, E, B6, B12 and biotin while lower SEL children had a higher intake of thiamin and folate. These differences can be explained by a different pattern of consumption according to SEL. Bread is a major staple in low SEL, and by law it is fortified with thiamin, riboflavin, niacin, Fe and folic acid.
School should be a preferred site to impart nutrition education and increase PA in children. Nevertheless, these efforts are impaired by the neglect of physical education classes in favour of other subjects considered more important by teachers like maths or history, and by the presence of kiosks which tend to offer high-fat and high-sugar snacks and beverages. Although the Chilean Ministry of Education is addressing the problem to a certain extent, it is necessary to commit more resources to achieve this goal.
The limitations of the study are based on having realized only one 24 h recall in the children and measuring PA by questionnaire, both necessary due to the resources available. Another limitation is that Tanner stage was not evaluated in children, which could explain to some extent the similar results between boys and girls.
In conclusion, our study shows that on the average a high prevalence of overweight and obesity is present in Chilean schoolchildren aged 9–12 years. This is produced by a combination of reduced PA and inadequate diet. Prevalence of obesity was higher in children from low SEL, probably due to a higher consumption of carbohydrate. Although the diet seemed to be adequate in terms of macro- and micronutrients except for fibre, there was a low consumption of fruits and vegetables, fruits and dairy products.
Acknowledgements
The study was funded by the International Life Sciences Institute (ILSI), South Andean. There is no conflict of interest. Y.L. was involved in data collection, data interpretation, manuscript preparation and literature search. O.C. was involved in data collection, data interpretation and manuscript preparation. V.E. was general coordinator of the study. L.V. performed the statistical analysis. J.R. did the study design, was involved in data interpretation and manuscript preparation, and obtained funding. The authors would like to thank Marisol Caceres for her help in data input.


