


Introduction
During crop harvest, seeds from weeds that were not controlled during the season will enter into the combine and be spread back out across the field (Walsh et al. Reference Walsh, Newman and Powles2013). Harvest weed seed control (HWSC) is a method that targets weed seeds for control as they pass through the combine (Shergill et al. Reference Shergill, Schwartz-Lazaro, Leon, Ackroyd, Flessner, Bagavathiannan, Everman, Norsworthy, VanGessel and Mirsky2020). HWSC was originally developed in Australia to help control herbicide-resistant rigid ryegrass (Lolium rigidum Gaudin) populations in wheat (Triticum aestivum L.) (Walsh et al. Reference Walsh, Newman and Powles2013). Lolium rigidum has developed resistance to 12 herbicide modes of action, reducing the effective chemistry for controlling this problematic weed species and necessitating nonchemical control solutions (Boutsalis et al. Reference Boutsalis, Gill and Preston2012; Heap Reference Heap2024). HWSC allows farmers to reduce the number of weed seeds being returned to the soil seedbank without using herbicides, which has led to its rapid adoption in Australian small grain cropping systems (Walsh et al. Reference Walsh, Powles and Rengel2022).
There are multiple ways to implement HWSC, such as chaff carts, bale direct system, chaff lining, and narrow windrow burning (Shergill et al. Reference Shergill, Schwartz-Lazaro, Leon, Ackroyd, Flessner, Bagavathiannan, Everman, Norsworthy, VanGessel and Mirsky2020; Walsh et al. Reference Walsh, Broster, Schwartz-Lazaro, Norsworthy, Davis, Tidemann, Beckie, Lyon, Soni, Neve and Bagavathiannan2018b). While these are good methods, all but chaff lining requires additional work outside harvest, such as disposing of chaff, removing bales, or igniting windrows. Chaff lining is a one-pass system that does not require maintenance after harvest, but it does not kill the weed seeds like the other methods and does not evenly distribute the residue. Seed impact mills are another way to implement HWSC (Walsh et al. Reference Walsh, Broster and Powles2018a). They are modifications that are attached directly to the combine and process the chaff fraction during harvest (Walsh et al. Reference Walsh, Broster and Powles2018a). The seed impact mill kills the weed seeds as they exit the combine and then distributes the harvest residue back out into the field (Walsh et al. Reference Walsh, Broster and Powles2018a); they address the previous concerns, because they are a one-pass system that also kills weed seeds.
Testing seed impact mills in Australia has revealed promising results. A study revealed that seed impact mills, narrow windrow burning, and chaff carts were similarly effective against L. rigidum, resulting in an average population reduction of 60% across all tested sites (Walsh et al. Reference Walsh, Aves and Powles2017). Evaluation of the Harrington Seed Destructor (HSD) in wheat, lupin (Lupinus angustifolius L.), and barley (Hordeum vulgare L.) revealed that >90% of L. rigidum seeds were killed in all chaff types (Walsh et al. Reference Walsh, Harrington and Powles2012). Even at the lowest and highest operating speed for the mill, L. rigidum seed kill was >85% and >94%, respectively (Walsh et al. Reference Walsh, Harrington and Powles2012). Modifications to the HSD resulted in the integrated Harrington Seed Destructor (iHSD), resulting in a mill that was integrated into the combine rather than being towed behind it. These modifications led to an increase in efficacy, with Walsh et al. (Reference Walsh, Broster and Powles2018a) reporting that the iHSD killed >95% of all weed seeds tested. Additionally, problematic species like L. rigidum and wild radish (Raphanus raphanistrum L.) were killed at 96% and 99%, respectively (Walsh et al. Reference Walsh, Broster and Powles2018a). Seed impact mills have also been evaluated in North America, but little testing exists in small grain crops. Testing with the Redekop Seed Control Unit (SCU) indicated that volunteer canola (Brassica napus L.) seed kill was an average of 99.5% in various conditions (Tidemann et al. Reference Tidemann, Kubota, Reid and Zuidhof2020). Even with varying rates of wheat chaff flowing into the mill, seed kill was not affected and remained >99% (Tidemann et al. Reference Tidemann, Kubota, Reid and Zuidhof2020). Other research in Canada indicated that the HSD delivered high seed kill rates ranging from 97.7% to 99.8% for a variety of species (Tidemann et al. Reference Tidemann, Hall, Harker and Beckie2017). Even in various chaff types (canola as a crop, pea [Pisum sativum L.], and barley), the HSD was able to kill >98% of B. napus seeds (Tidemann et al. Reference Tidemann, Hall, Harker and Beckie2017).
While there is tremendous potential for HWSC adoption in North America for cropping systems such as wheat, the practice has had little adoption to date (Shergill et al. Reference Shergill, Schwartz-Lazaro, Leon, Ackroyd, Flessner, Bagavathiannan, Everman, Norsworthy, VanGessel and Mirsky2020). Several knowledge gaps need to be addressed to potentially alleviate growers’ concerns with this technology. Testing a wider range of weed species and understanding how chaff flow rate and chaff moisture affect seed kill and horsepower draw are key areas that need more research, especially considering that previous research has indicated that chaff moisture can affect seed kill. Walsh et al. (Reference Walsh, Broster and Powles2018a) reported that seed kill of L. rigidum decreased from 92% to 88% when chaff moisture increased from 10% to 16%. In North America, chaff moisture during harvest is commonly higher than in Australia, mostly due to climatic differences (Walsh et al. Reference Walsh, Powles and Rengel2022). During wheat harvest, Australia typically is more hot and dry with little to no rainfall, while North America is generally colder and damper (Walsh et al. Reference Walsh, Powles and Rengel2022). Because of this difference, a more comprehensive chaff moisture range needs to be tested. Increasing the chaff flow rate and chaff moisture could affect the operational efficiency of the seed impact mill. Farmers have observed that harvest residues can plug or stop the mills during less than ideal harvest conditions. Farmers who have adopted seed impact mills have also mentioned that horsepower used increased with the mill (Shergill et al. Reference Shergill, Schwartz-Lazaro, Leon, Ackroyd, Flessner, Bagavathiannan, Everman, Norsworthy, VanGessel and Mirsky2020). Because seed impact mills are integrated into the back of the combine, they are directly powered by the combine (Shergill et al. Reference Shergill, Schwartz-Lazaro, Leon, Ackroyd, Flessner, Bagavathiannan, Everman, Norsworthy, VanGessel and Mirsky2020). If the amount of chaff increases or the chaff moisture increases, more power would be required by the mill to process it, ultimately resulting in increased fuel consumption by the combine (Flessner et al. Reference Flessner, Mirsky, Schwartz-Lazaro, Bagavathiannan, VanGessel, Shergill, Ackroyd and Rubione2021). Additionally, if the combine lacks adequate engine capacity, harvest speed may decrease, leading to potential economic losses for farmers due to a delayed or prolonged harvest season. Therefore, it is important to understand how variable chaff moisture and flow rate conditions affect horsepower draw by the seed impact mill.
The aim of this research was to evaluate the effectiveness of two seed impact mills, SCU and iHSD, using stationary test stands with three objectives being evaluated. The first objective was to test the seed kill percentage of economically important weed species in wheat. The second objective was to determine how chaff flow rate into the seed impact mill affects weed seed kill and the amount of horsepower needed to power the mill. The third objective was to determine how chaff moisture percentage affects weed seed kill and the amount of horsepower needed to power the mill.
Materials and Methods
Stationary test stands for the SCU (Redekop Manufacturing, Saskatoon, SK, Canada) and the iHSD (de Bruin Engineering, Mount Gambier, SA, Australia) were provided by each manufacturer for testing (Figure 1). Both mills were powered by a John Deere 6140D tractor with a 115-horsepower rating at the power take-off (PTO) stub (Deere & Company, Moline, IL, USA). Three variables were tested in this study: seed kill (SK), chaff flow rate (CF), and chaff moisture (CM). Six species were used to test SK: Italian ryegrass [Lolium perenne ssp. multiflorum (Lam.) Husnot; weedy biotype), B. napus, hairy vetch (Vicia villosa Roth), Italian ryegrass (syn.: annual ryegrass [L. perenne ssp. multiflorum]; domesticated biotype), wild mustard (Sinapis arvensis L.), and cereal rye (Secale cereale L.). Only L. perenne ssp. multiflorum (weedy biotype), B. napus, and V. villosa were used for CF and CM.
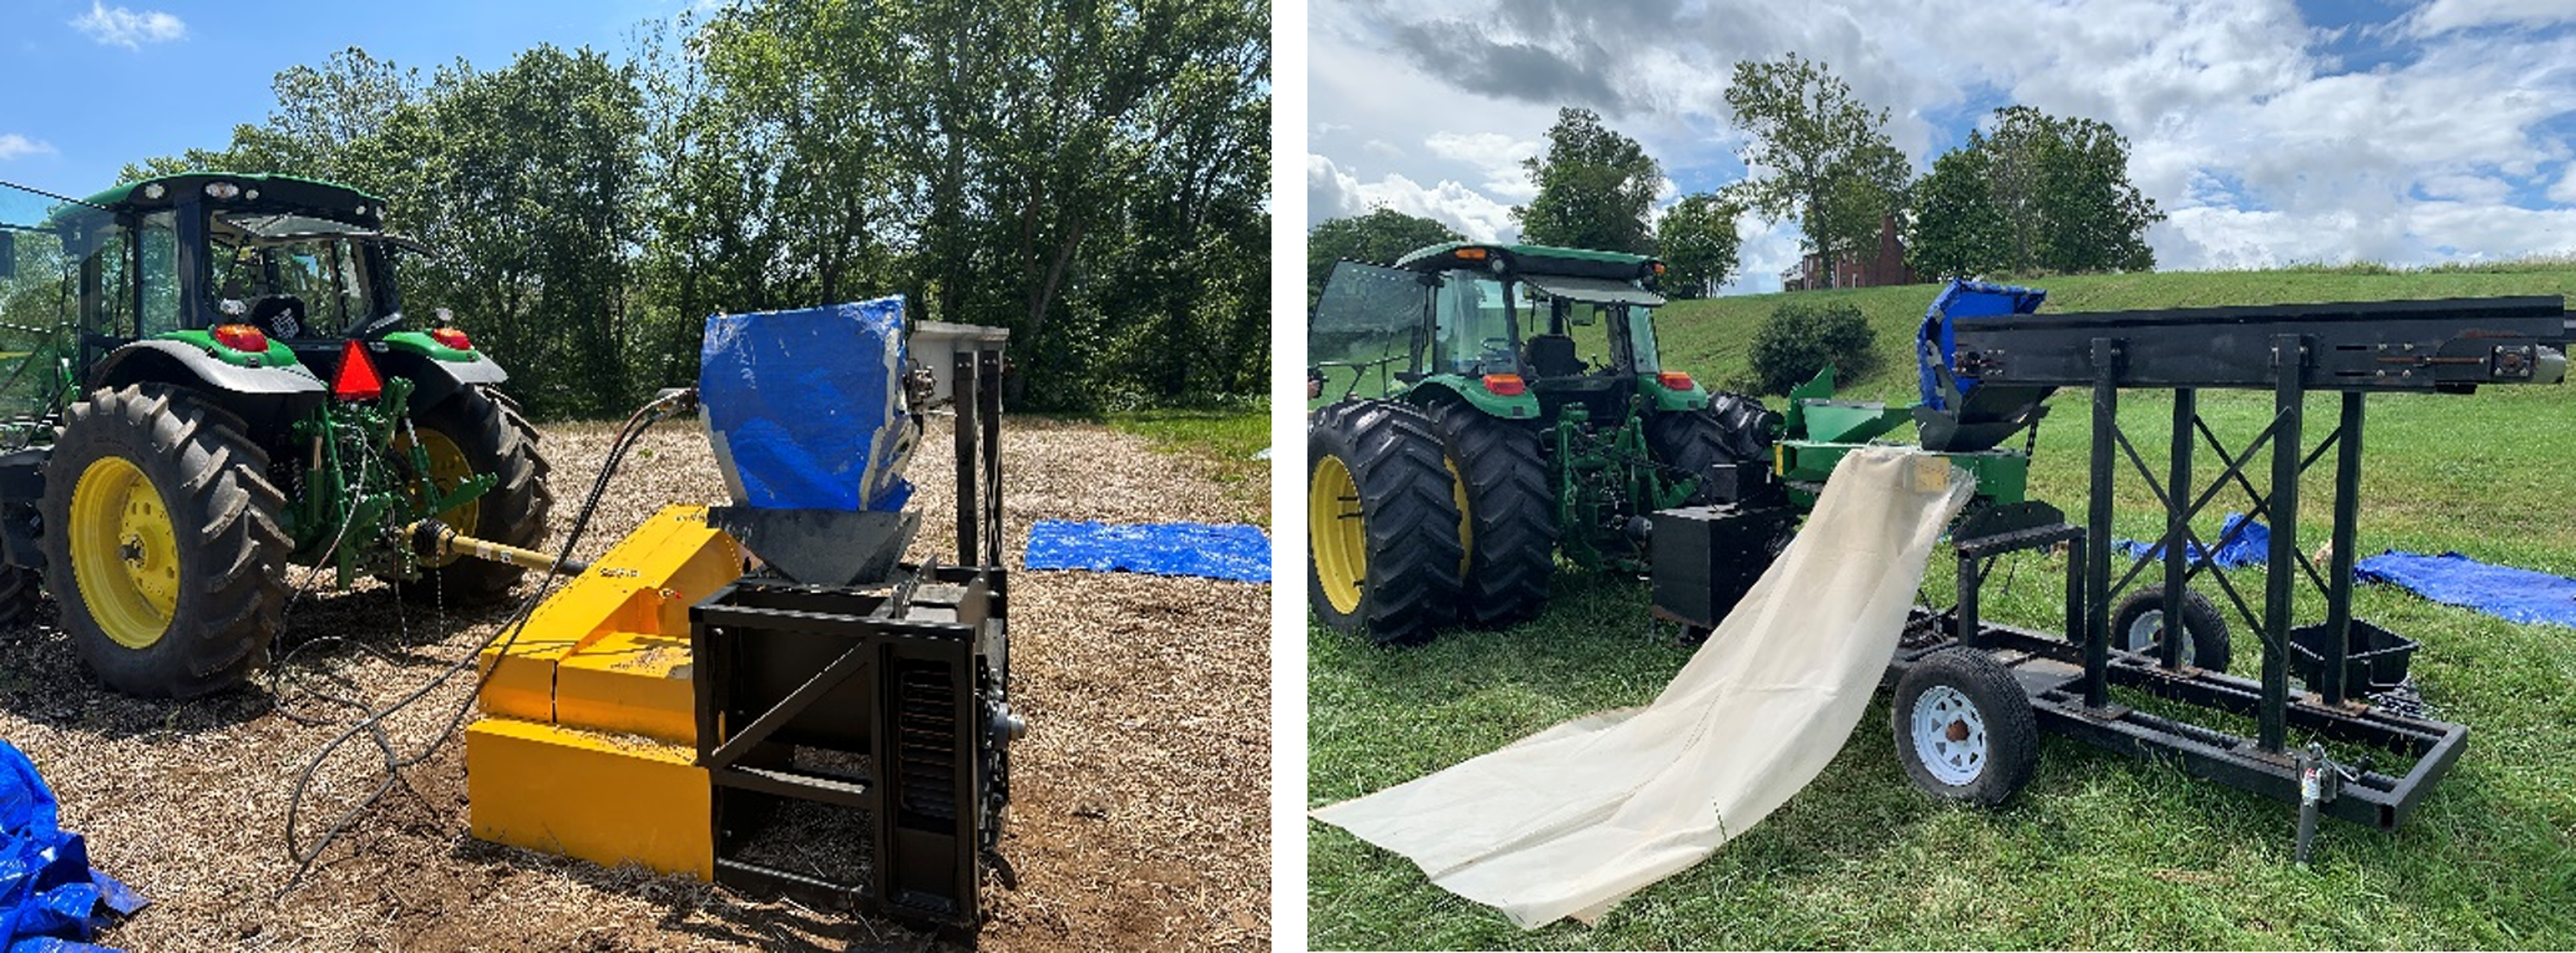
Figure 1. Setup for the integrated Harrington Seed Destructor (iHSD) (left) and Redekop Seed Control Unit (SCU) (right) test stands. Chaff was loaded on the conveyor belt and fed into the mill that was powered by the tractor power take-off (PTO). The process chaff and weed seeds were captured by the mesh bag (example right) as it exited the mill.
Petri dish germination assays were conducted on the seed lots to determine the germination rate before seed impact mill testing. Five sets of 50 seeds were placed between two pieces of dampened filter paper (VWR International, Radnor, PA, USA) inside a petri dish (VWR International). The petri dishes were sealed with parafilm (Bemis Company, Neenah, WI, USA) and placed on the lab bench for 2 wk at 22 ± 2 C. After 2 wk, seeds with emerged radicles were counted, and an average germination rate was calculated for each species. Additionally, an average of 100-seed weights was calculated by weighing 10 sets of 100 seeds for each species. Equation 1, which used the germination rate and the average 100-seed weight, was used to calculate the weight of seed that was needed for each objective.
 $${\rm{Grams \ of \ seed \ needed}} = \left( {{\rm{average }}\ 100 - {\rm{seed \ weight }}\ \left( {\rm{g}} \right)/100} \right){\rm{ }}*{\rm{ }}\left( {3,000/\, \% \ {\rm{ germination}}} \right)$$
The target seed goal for each replicate was 3,000 germinable seeds for each species. The number of seeds used was based on previous research that evaluated the number of seeds needed for impact mill testing (Tidemann et al. Reference Tidemann, Hall, Harker and Beckie2017; MJ Walsh, personal communication). A commercial combine’s optimum chaff flow rate is 3.0 kg s−1, which is normally processed by both mills from the twin mill system (Walsh et al. Reference Walsh, Broster and Powles2018a). However, we only tested a single mill, so the optimum chaff flow rate used was 1.5 kg s−1.
Chaff was collected from a wheat field in Virginia that was in commercial production. The field selected for chaff collection was weed-free at the time of harvest to eliminate weed seed contamination in the chaff. A chaff cart was connected to the back of the combine and was used to collect the chaff as it exited the combine during harvest. Large residues that exited the combine through the straw chopper were not collected. Once the chaff was collected, it was transferred into tote bags and stored in ambient conditions until it was needed for testing.
Seed Kill
For SK, there were five replicates, and two replications for each species tested. For testing, 1.5 kg of chaff was evenly fed into the mill via a conveyor belt in a 1-s increment to achieve the 1.5 kg s−1 flow rate that Walsh et al. (Reference Walsh, Broster and Powles2018a) used. The chaff was loaded on the conveyor belt and evenly spread out. The weed seeds were added on top of the chaff, within the middle 80%, and lightly mixed in. The mill was powered and brought to the correct speed. A photo tachometer (CEN-TECH, Camarillo, CA, USA) was used to ensure the mill was operating within ±2% of the proper operating speed as indicated by the mill’s manufacturer. Once the mill was up to speed, the conveyor belt was engaged, and the chaff was fed into the mill. The chaff was caught using a 500-micron mesh bag as it exited the mill, which allowed for the collection of processed residues without restricting airflow (Figure 1). This collected processed material was weighed and taken to the greenhouse for additional testing, as described later.
Chaff Flow Rate
For CF, four different rates were tested. The flow rates were 0.5×, 1×, 1.5×, and 2×, based on the standard flow rate for a commercial combine described by Walsh et al. (Reference Walsh, Broster and Powles2018a). The corresponding chaff rates for testing a single mill were 0.75, 1.5, 2.25, and 3.0 kg s−1. Five replicates were conducted, and two replications were conducted for each treatment.
The mill was brought up to speed for testing, and the conveyor belt was loaded and operated as previously described for SK. For all rates, the testing interval was 1 s, and the amount of chaff on the conveyor belt varied depending on the chaff rate (Walsh et al. Reference Walsh, Broster and Powles2018a). Once the mill was up to speed, a log of the horsepower required to power the mill was recorded using a Tractor PTO Shaft Monitoring System (Datum Electronics, East Cowes, UK) that generated 90 to 100 data points s−1. After the mill had reached optimum operating speed, the horsepower was logged for 5 to 10 s, then the conveyor belt was turned on, and the chaff was fed into the mill. After the chaff was processed, the PTO monitor continued to log data for another 5 to 10 s. Processed residues were collected, weighed, and taken to the greenhouse for additional testing, as described later.
Chaff Moisture
For CM, five replicates were conducted, and two replications were conducted for each treatment. Four different rates of chaff moisture, 10.7%, 16.4%, 22.1%, and 27.8%, were tested. Chaff moisture values span what is typically found during wheat harvest, including moisture levels that are higher than what is normally harvested in commercial production. Chaff flow rate was the standard flow rate of 1.5 kg s−1 with only the percent moisture varying. Initial chaff moisture was determined by oven-drying three chaff samples for 4 d. Then, using before and after weight, the ambient moisture of the chaff was calculated. To achieve the correct moisture content, 1.5 kg of chaff was weighed and placed in a plastic bag. Water was added to the bag to raise the chaff moisture to the desired test value. These bags were sealed, mixed, and allowed to sit for 24 h so that the chaff had ample time to absorb the water and homogenize. Bags remained sealed until they were loaded onto the conveyor belt, just before testing. Mill operation and horsepower monitoring were conducted as previously described.
Greenhouse Testing
After processing, the SK, CF, and CM samples were brought back to the greenhouse, and used in exhaustive germination studies. Processed chaff was added in a 1:1 ratio with Miracle-Gro® moisture control potting mix (Scotts, Marysville, OH, USA) in 25.4 cm by 50.8 cm trays (Greenhouse Megastore, Danville, IL, USA) (Schwartz-Lazaro et al. Reference Schwartz-Lazaro, Norsworthy, Walsh and Bagavathiannan2017). For each replicate, the processed chaff and weed seeds were homogenized, and equal amounts were added to four trays to ensure an adequate amount of chaff was tested. Depending on the objective and treatment, the total percentage of chaff sampled ranged from 20% to 100%. Three check trays were also established for each objective. Check trays consisted of a 1:1 ratio of potting mix and seed-free chaff that the mill had processed (Schwartz-Lazaro et al. Reference Schwartz-Lazaro, Norsworthy, Walsh and Bagavathiannan2017). The check trays were spiked with 100 seeds of each tested species from the same seed lot. All trays were placed randomly in the greenhouse and mixed to ensure good seed-to-soil contact. Trays were watered once daily by hand. Seedlings were counted, recorded, and removed from the trays once per week. Every third week, trays were mixed to ensure that seeds at the bottom were brought to the surface. The trays remained in the greenhouse for 12 wk. After 12 wk, data collection ceased, and the counts were compiled.
Statistical Analysis
Seed kill data from SK, CF, and CM were recorded and compiled, and each seed impact mill was analyzed separately. Equation 2 was used to determine the number of germinable seeds sampled.
 $${\rm{Germinable \ seeds \ sampled}} = {\rm{total \ no}}{\rm{. \ seeds \ tested}}*\% \ {\rm{ germination}}*\% \ {\rm{ chaff sampled}}$$
Equation 3 was then used to determine the seed kill percentage.
 $${\rm{Seed kill}} = 100-{\rm{ }}({{{\rm{no}}.\;\;{\rm{of}}\;{\rm{emerged}}\;{\rm{weeds}}} \over {{\rm{no}}.\;{\rm{of}}\;{\rm{germinable}}\;{\rm{seeds}}\;{\rm{sampled}}}}*100)$$
To account for any variability at a given data point for horsepower draw, the data were smoothed within GraphPad Prism (Dotmatics, Boston, MA, USA), which used 20 data points surrounding each point (Savitzky and Golay Reference Savitzky and Golay1964). The highest point was used to determine the horsepower draw required for each replicate at the tested chaff flow rate or chaff moisture percentage. Empty mill tests were also conducted to establish a baseline horsepower draw. Using the empty mill horsepower requirements, percent increase was calculated for each chaff flow rate and chaff moisture percentage tested. Replications were treated as random effects. Seed kill and horsepower draw for each replicate were analyzed using ANOVA in JMP v. 16.2 (SAS Institute, Cary, NC, USA). Means and SEs of seed kill percentages and horsepower draw for all objectives tested were generated using JMP v. 16.2. Mean separations were generated using Tukey’s Honestly Significant Difference (0.05) (HSD). Seed kill and horsepower draw data were presented using graphs generated by GraphPad Prism. Linear regressions of seed kill and horsepower draw were conducted using GraphPad Prism with CF and CM as single predictors.
Results and Discussion
Seed Kill
Rates of seed destruction were high (>91%) for both mills for all tested species. When seed kill was compared for all species for each mill, weedy and domesticated L. perenne L. ssp. multiflorum had the lowest seed kill rate, while the broadleaves and S. cereale had significantly higher kill rates in both mills (Table 1). Weedy L. perenne ssp. multiflorum proved harder to kill, with seed kill being 91.4% and 93.6% for the iHSD and SCU, respectively, while domesticated L. perenne ssp. multiflorum was easier to kill, with seed kill being 94.1% and 95.8% for the iHSD and SCU, respectively. There was no significant difference between domesticated B. napus and S. arvensis for either mill.
Table 1. Mean seed kill (±SE) of tested species by the integrated Harrington Seed Destructor (iHSD) and Redekop Seed Control Unit (SCU).
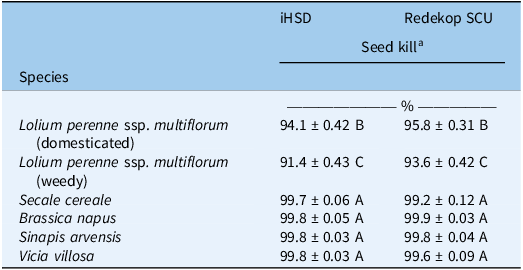
a Letters indicate differences between species within the tested mill, according to Tukey’s HSD(0.05).
The seed kill rates that we observed are similar to previous testing. A 95% kill rate was observed for L. rigidum with the tow-behind Harrington Seed Destructor (HSD) (Walsh et al. Reference Walsh, Harrington and Powles2012). Also, the HSD delivered 99% and >98% seed kill of R. raphanistrum and B. napus (Tidemann et al. Reference Tidemann, Hall, Harker and Beckie2017; Walsh et al. Reference Walsh, Harrington and Powles2012). Testing with the iHSD in Australia revealed that seed kill was 96% for L. rigidum (Walsh et al. Reference Walsh, Broster and Powles2018a). Testing in Canada with the SCU indicated that it was able to deliver an average seed kill rate of 99.5% for B. napus (Tidemann et al. Reference Tidemann, Kubota, Reid and Zuidhof2020). These studies also support that Lolium spp. are harder to kill than broadleaf species like R. raphanistrum and B. napus. Seed coat morphology and seed shape could be contributing factors for this reduced seed kill for Lolium spp. The high seed kill rates (>91%) that we observed indicate that these mills have potential to reduce soil seedbank inputs from problematic weed species.
Chaff Flow Rate
Chaff flow rate had a significant effect (P < 0.05) on seed kill for weedy L. perenne ssp. multiflorum for the iHSD and on seed kill for weedy L. perenne ssp. multiflorum and B. napus with the SCU. Seed kill had a significant linear relationship (P < 0.05) for weedy L. perenne ssp. multiflorum and V. villosa for the iHSD and for weedy L. perenne ssp. multiflorum for the SCU (Figure 2). Seed kill decreased by 7.9% and 0.09% for every 1-kg increase in chaff flow rate for weedy L. perenne ssp. multiflorum and V. villosa, respectively, with the iHSD. Seed kill decreased by 3.4% for every 1-kg increase in chaff flow rate for weedy L. perenne ssp. multiflorum with the SCU. Similar to our results for B. napus, previous research has reported that chaff flow rate had little to no effect on B. napus seed kill (Tidemann et al. Reference Tidemann, Hall, Harker and Beckie2017, Reference Tidemann, Kubota, Reid and Zuidhof2020). While seed kill was affected by changes in chaff flow, overall high kill rates (>77%) at high chaff flow rates indicate the potential for these mills to still kill seeds in less than ideal harvest conditions.
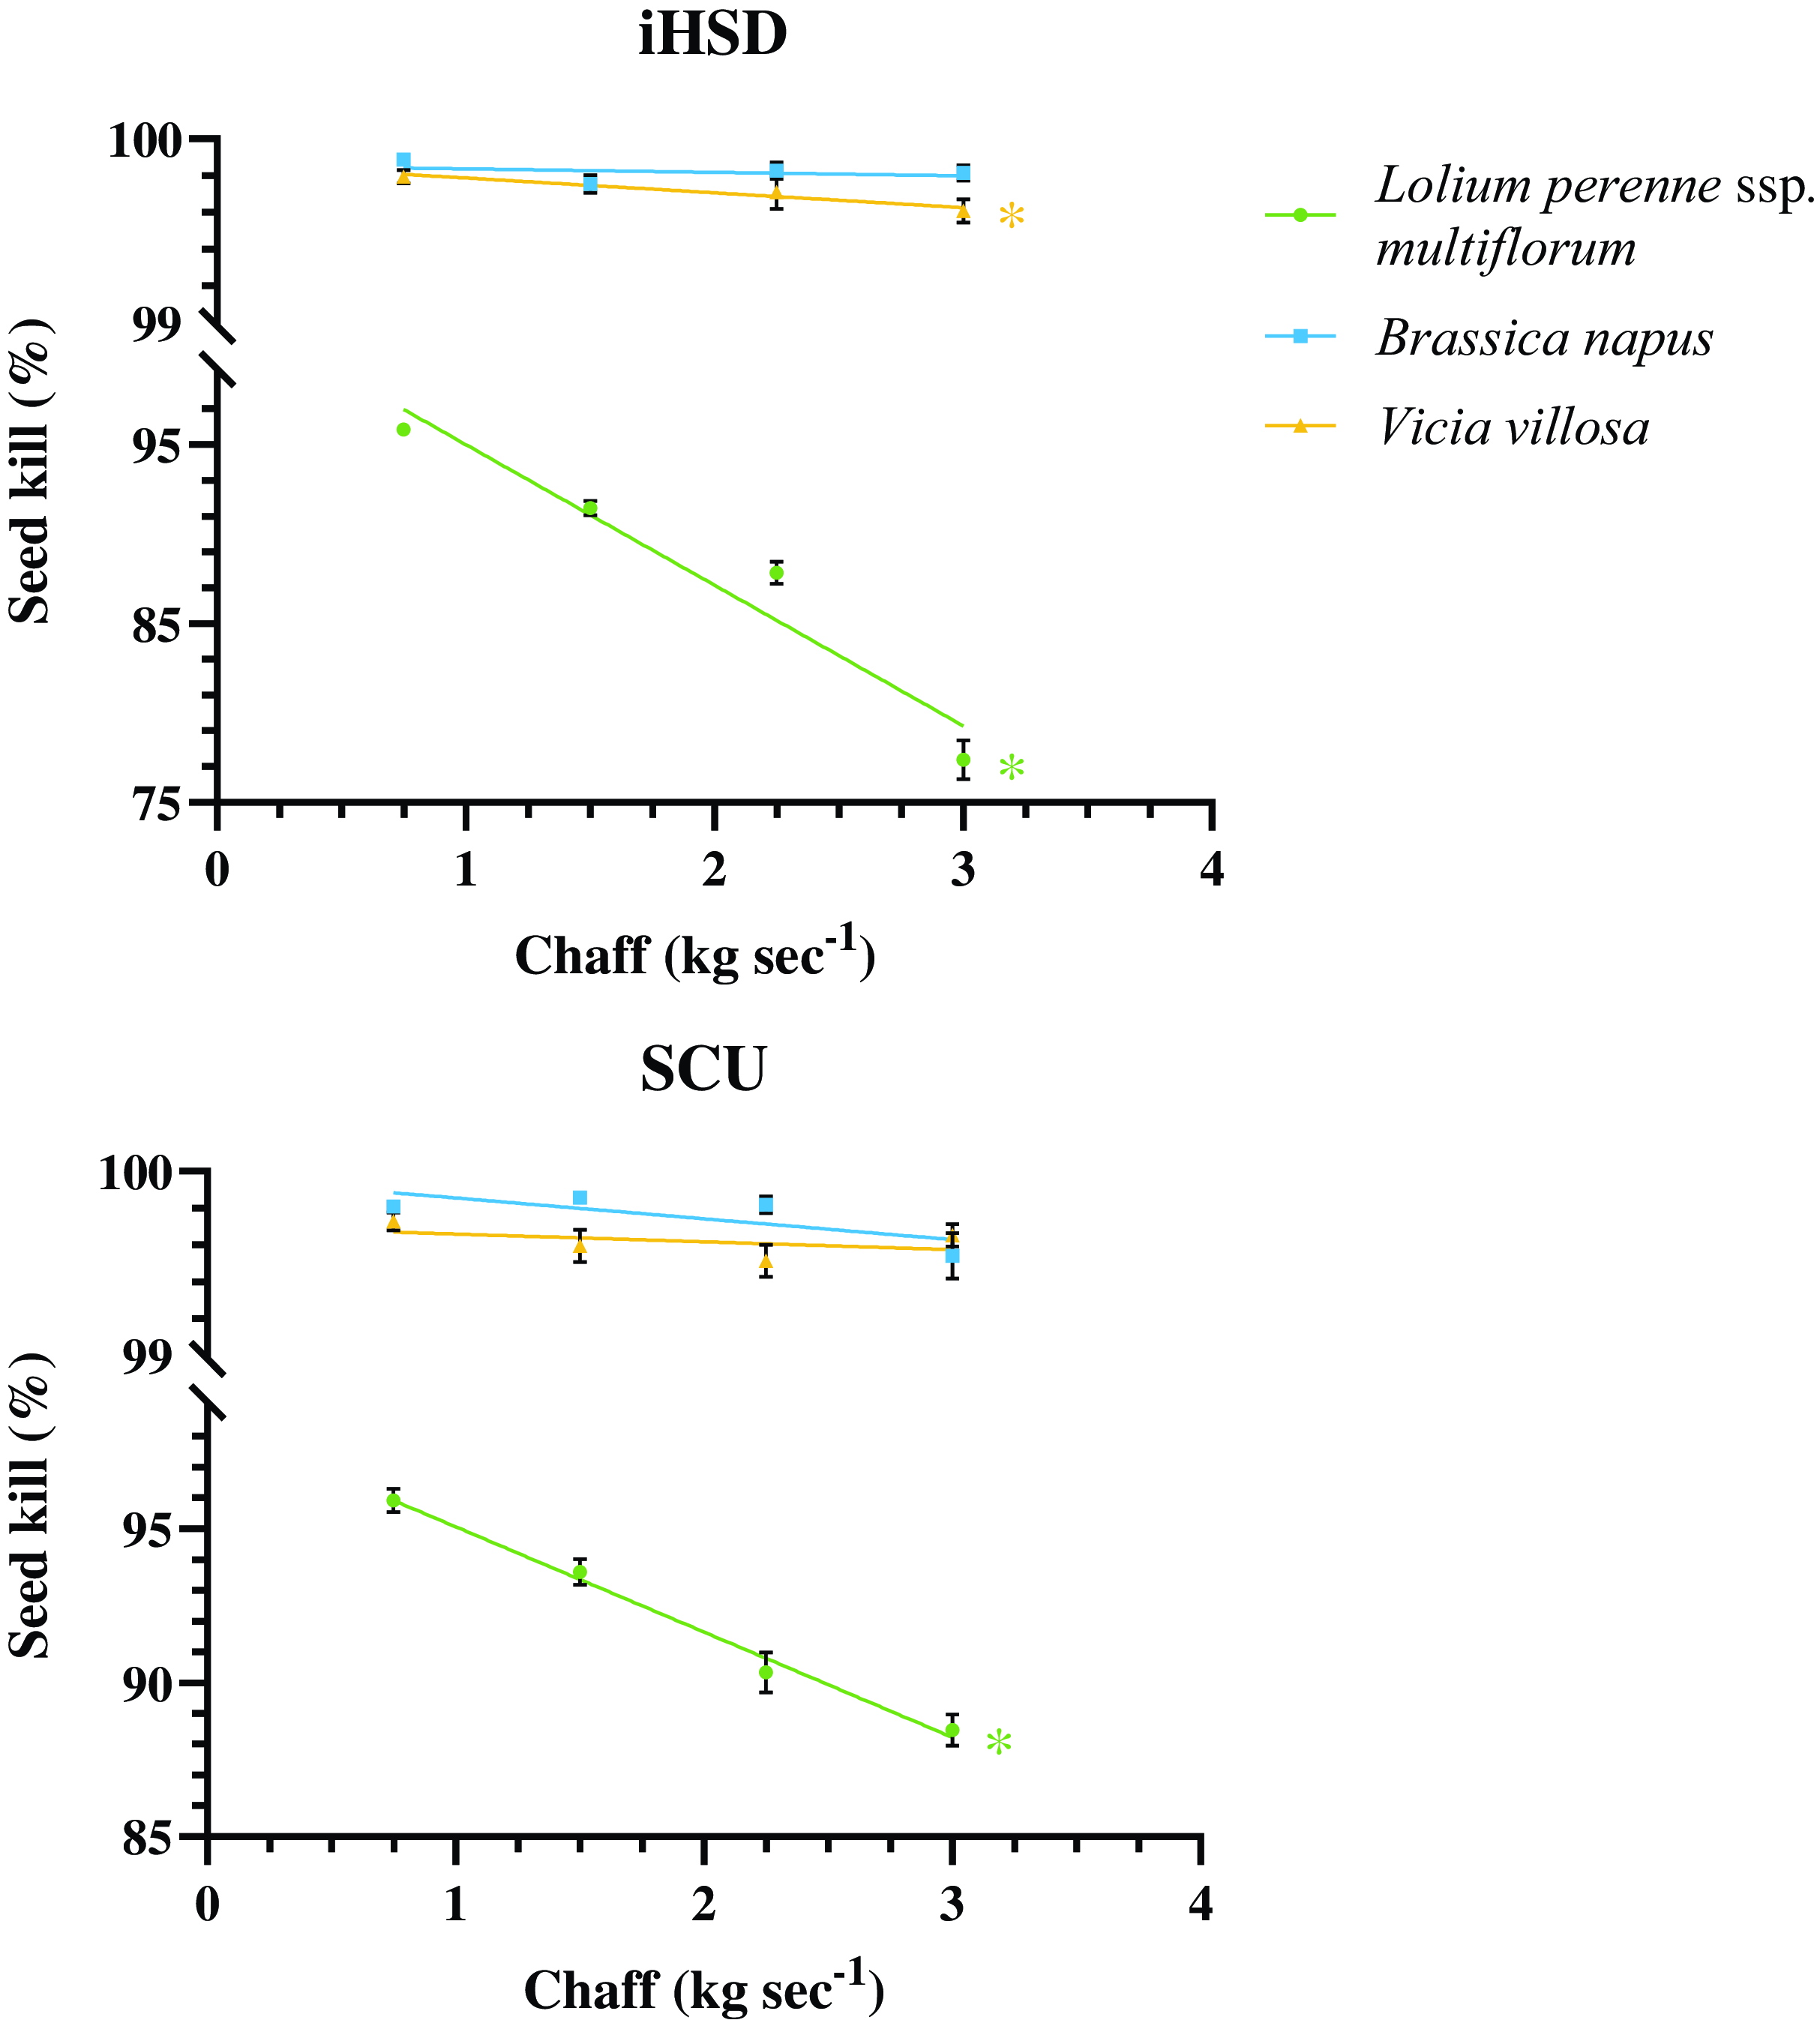
Figure 2. Seed kill of problematic weed seeds by the integrated Harrington Seed Destructor (iHSD) (top) and Redekop Seed Control Unit (SCU) (bottom) as chaff flow rate increases. Standard flow rate is 1.5 kg s−1. Points represent the mean, bars represent the SE, and lines with asterisks (*) represent significant linear regressions (P < 0.05). n = 40 per mill and per species.
The chaff flow rate had a significant effect (P < 0.05) on the horsepower draw for both mills. At the standard flow rate, peak horsepower usage increased by 136% and 167% for the iHSD and SCU, respectively, compared with an empty mill (Figure 3). Linear regression analysis indicated a significant increase in horsepower use, which increased by 57.7% and 92.1% for the iHSD and SCU, respectively, for every 1 kg s−1 increase in chaff flow rate. So the data indicate that horsepower requirements increase with increasing chaff flow, which would result in more fuel use by the combine during harvest. This is important for growers, because it could influence how they manage combine throughput during harvest to better balance additional horsepower consumption by the mill. To the best of our knowledge, there are no prior studies that evaluate horsepower use of seed impact mills.
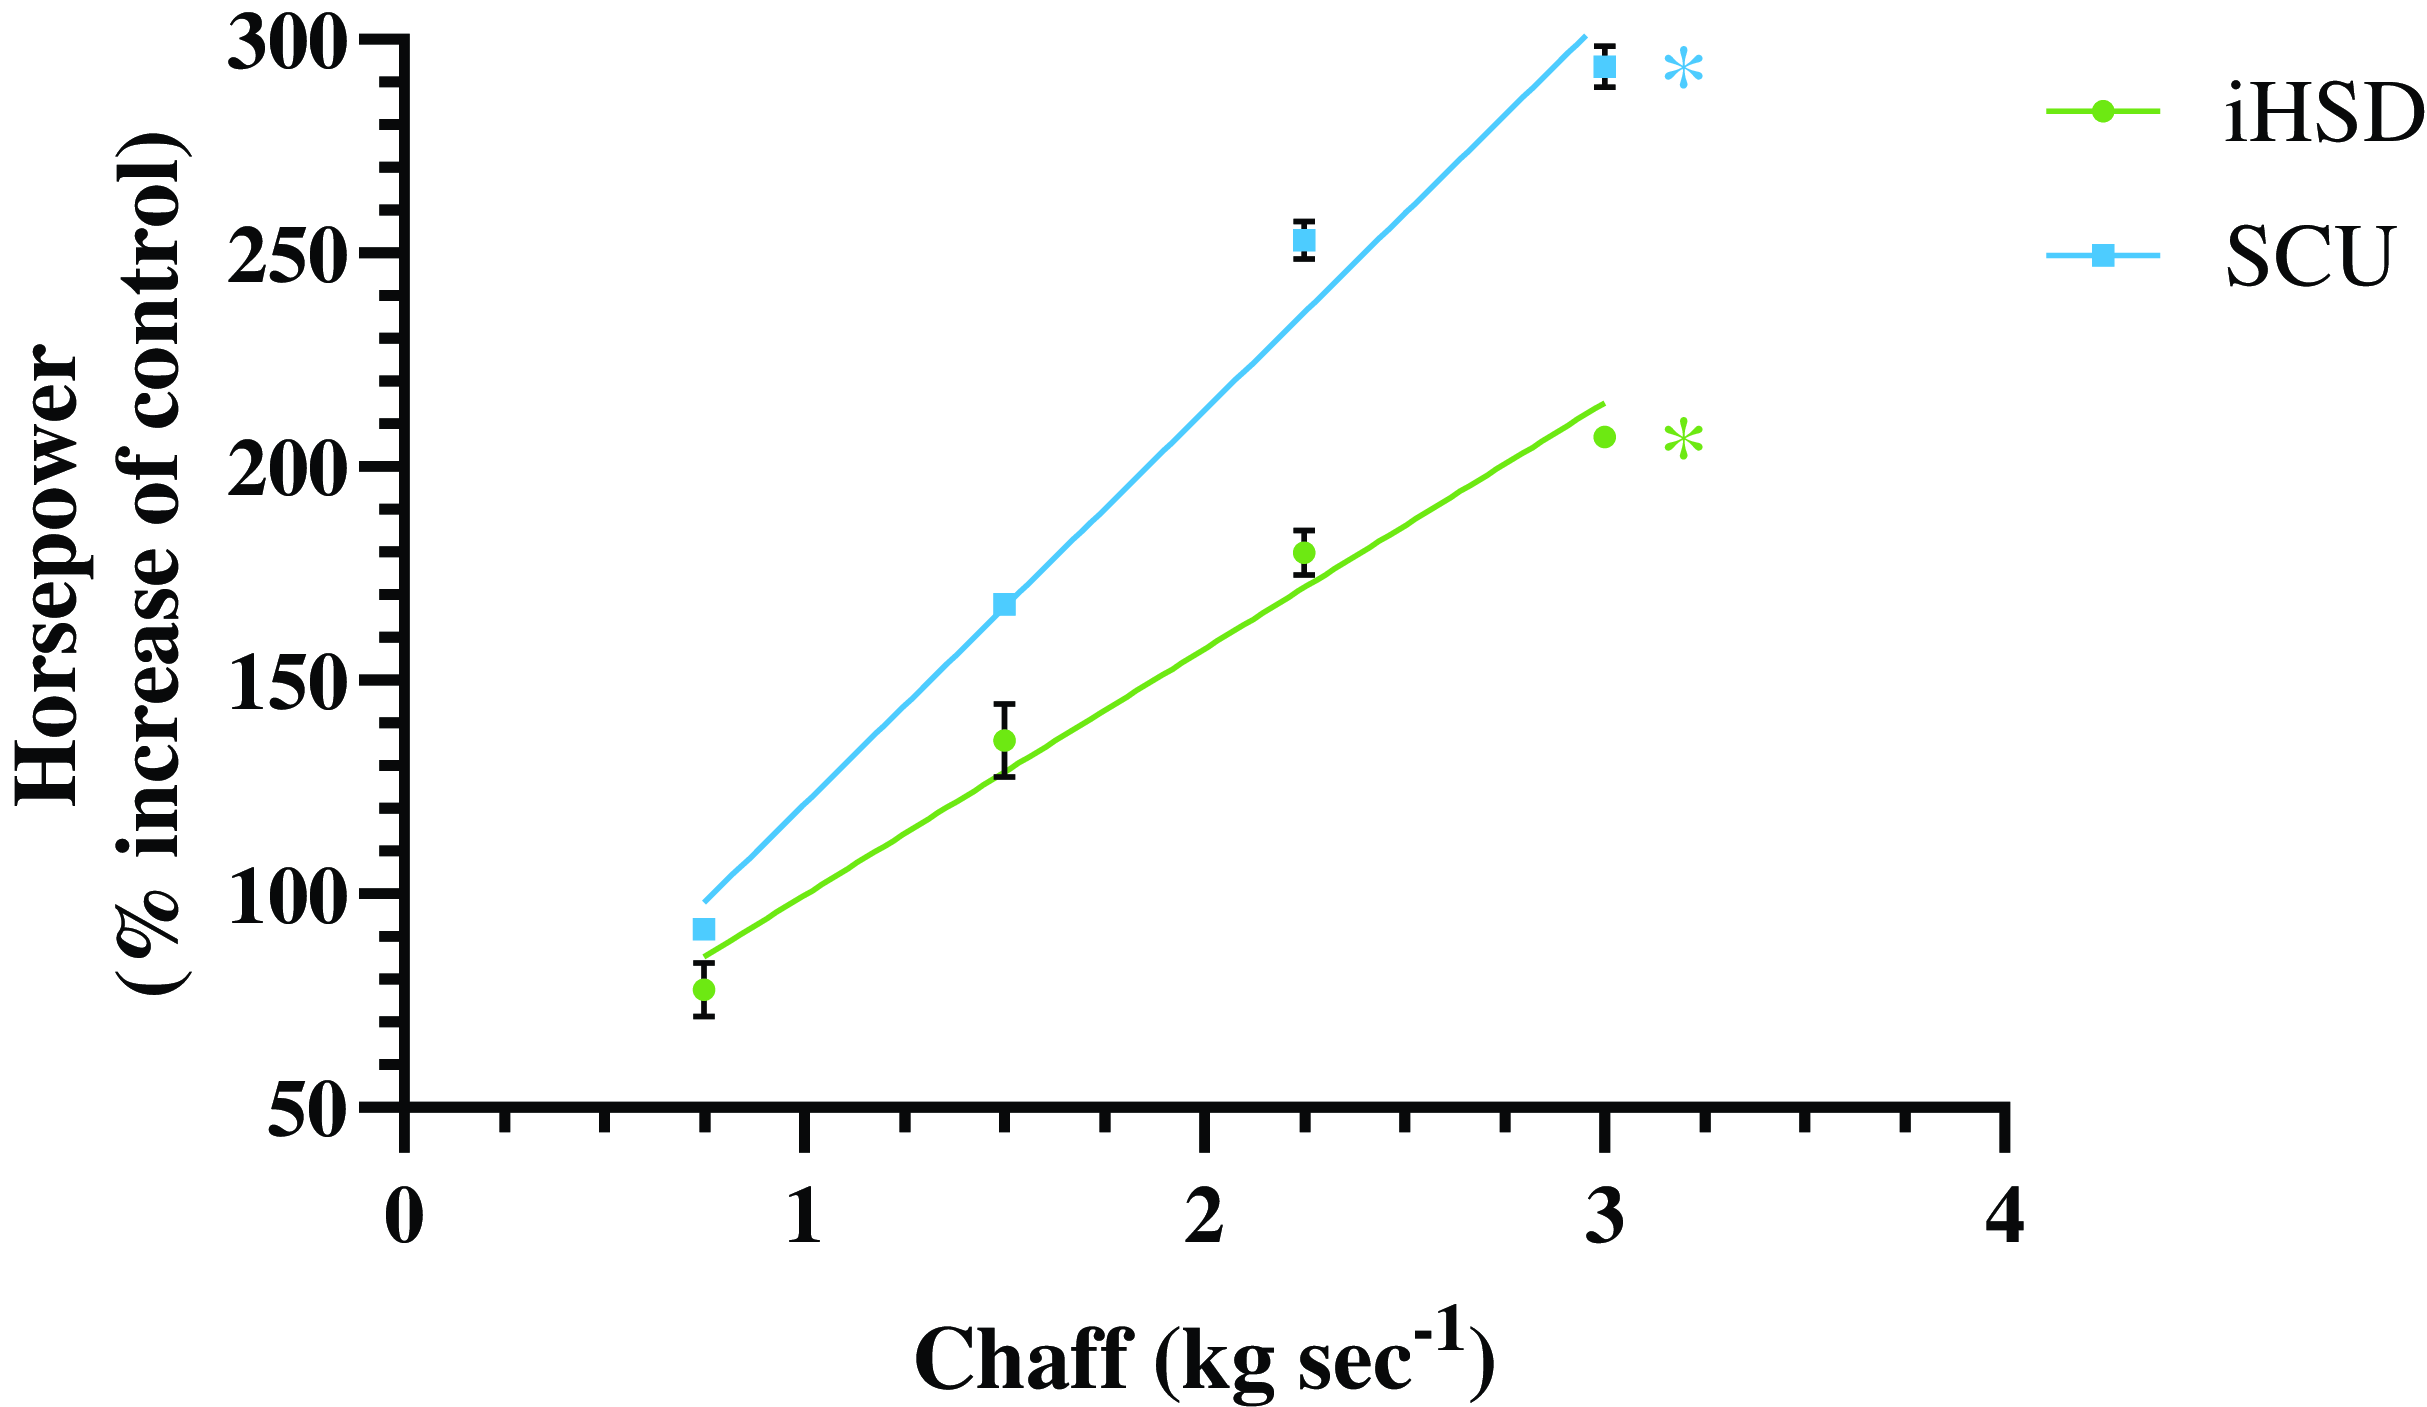
Figure 3. Horsepower required to power the integrated Harrington Seed Destructor (iHSD) and Redekop Seed Control Unit (SCU) as chaff flow rate increases. The data presented represent a percent increase from the horsepower required to power an empty mill (i.e., control). Points represent the mean, bars represent the SE, and lines with asterisks (*) represent significant linear regressions (P < 0.05). n = 40 per mill.
Chaff Moisture
Chaff moisture had a significant effect (P < 0.05) on seed kill for weedy L. perenne ssp. multiflorum for both mills and on V. villosa with the iHSD and for B. napus for the SCU (Figure 4). Seed kill decreased by 0.43% and 0.015% for every 1% increase in chaff moisture for weedy L. perenne ssp. multiflorum and B. napus, respectively, with the SCU. Chaff moisture did affect seed kill of weedy L. perenne ssp. multiflorum at higher levels with the iHSD and SCU delivering 74.3% and 82.0% seed kill, respectively, at 27.8% chaff moisture (Figure 4). Similar to our results, chaff moisture did have an effect on L. rigidum seed kill, which resulted in a 4% reduction in seed kill from 92% to 88% when chaff moisture increased from 10% to 16% (Walsh et al. Reference Walsh, Broster and Powles2018a). Our testing indicated lower kill rates and a bigger decrease in seed kill, but our testing covered a wider range of chaff moisture, which could explain the differences. Additionally, it is important for growers to consider the effect chaff moisture would have on seed kill efficacy before choosing to harvest in potentially higher moisture conditions.
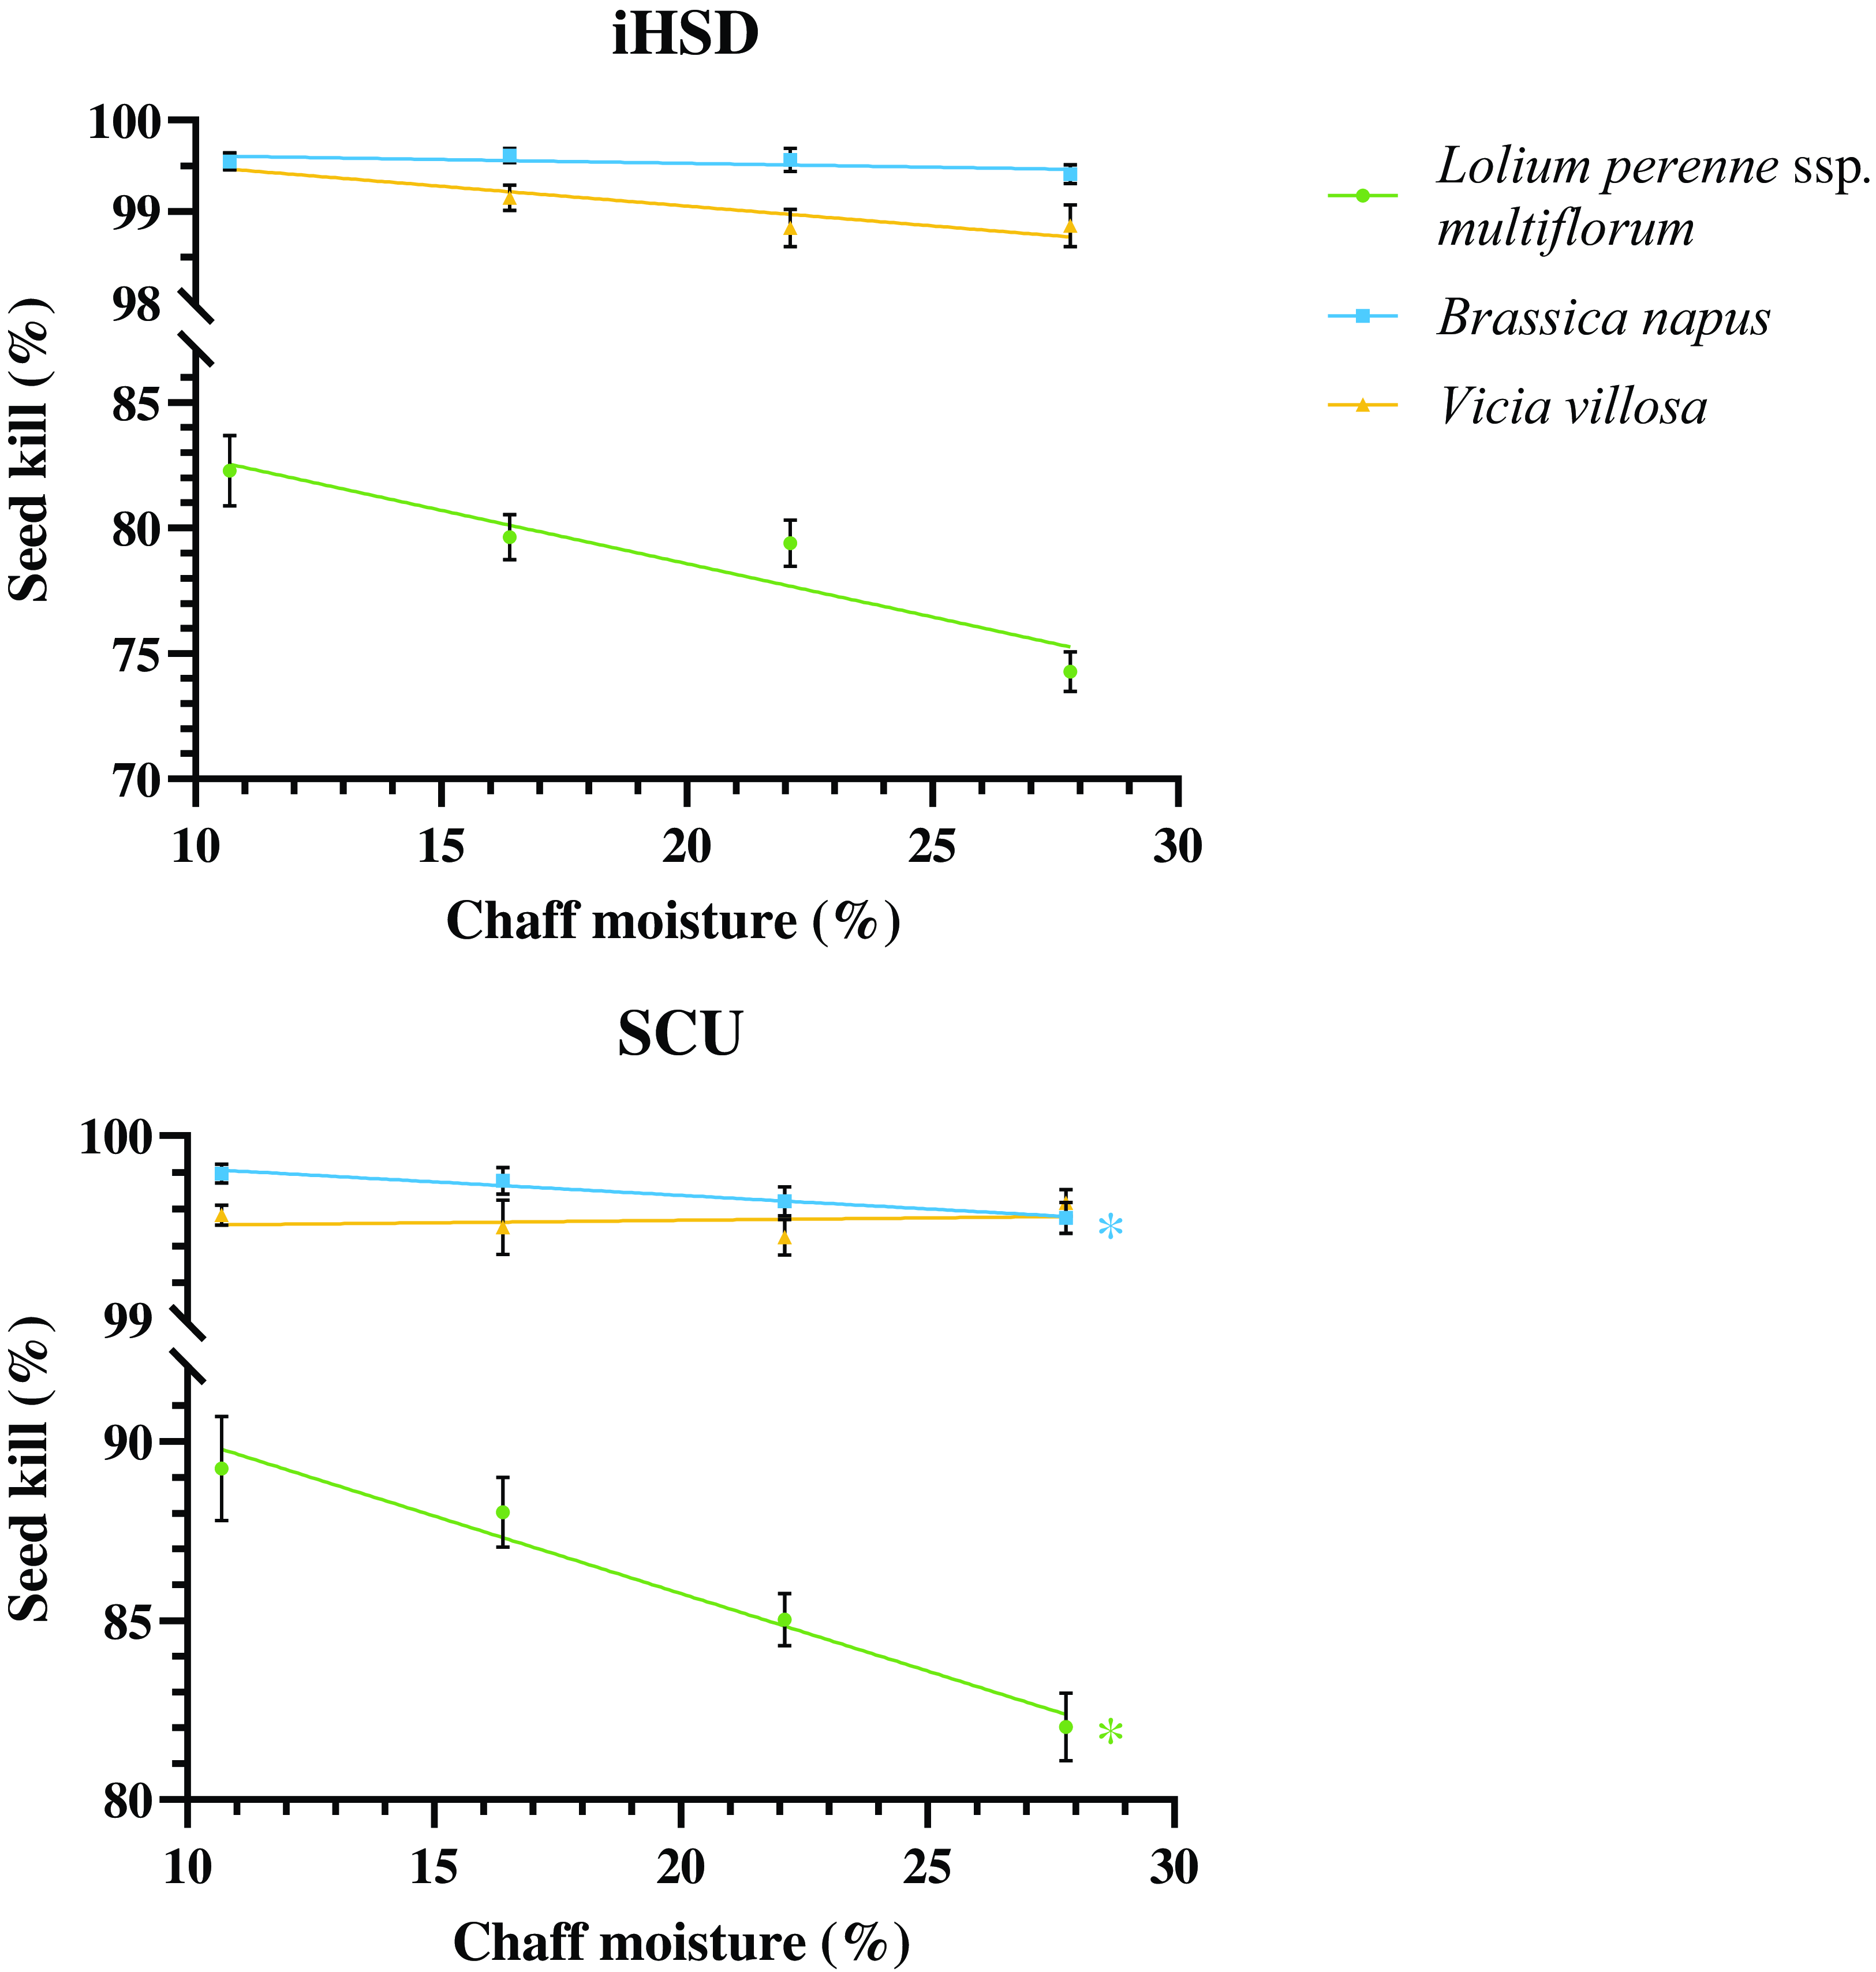
Figure 4. Seed kill of problematic weed seeds by the integrated Harrington Seed Destructor (iHSD) (top) and Redekop Seed Control Unit (SCU) (bottom) as chaff moisture increases. Points represent the mean, bars represent the SE, and lines with asterisks (*) represent significant linear regressions (P < 0.05). n = 40 per mill and per species.
Chaff moisture had a significant effect (P < 0.05) on horsepower draw for both mills compared with an empty mill. At the highest tested moisture level of 27.8%, horsepower usage increased by 263% and 93% for the iHSD and SCU, respectively, compared with an empty mill (Figure 5). The linear regression analysis indicated that the horsepower used increased significantly by 4.2% for every 1% increase in chaff moisture for the iHSD. As horsepower requirements increase with increasing chaff moisture, the amount of fuel used by the combine will also increase. So it is important for growers to understand how chaff moisture affects horsepower consumption by the mill, as it could result in a more expensive harvest. After reviewing the available literature, there were no studies that addressed horsepower usage by seed impact mills.
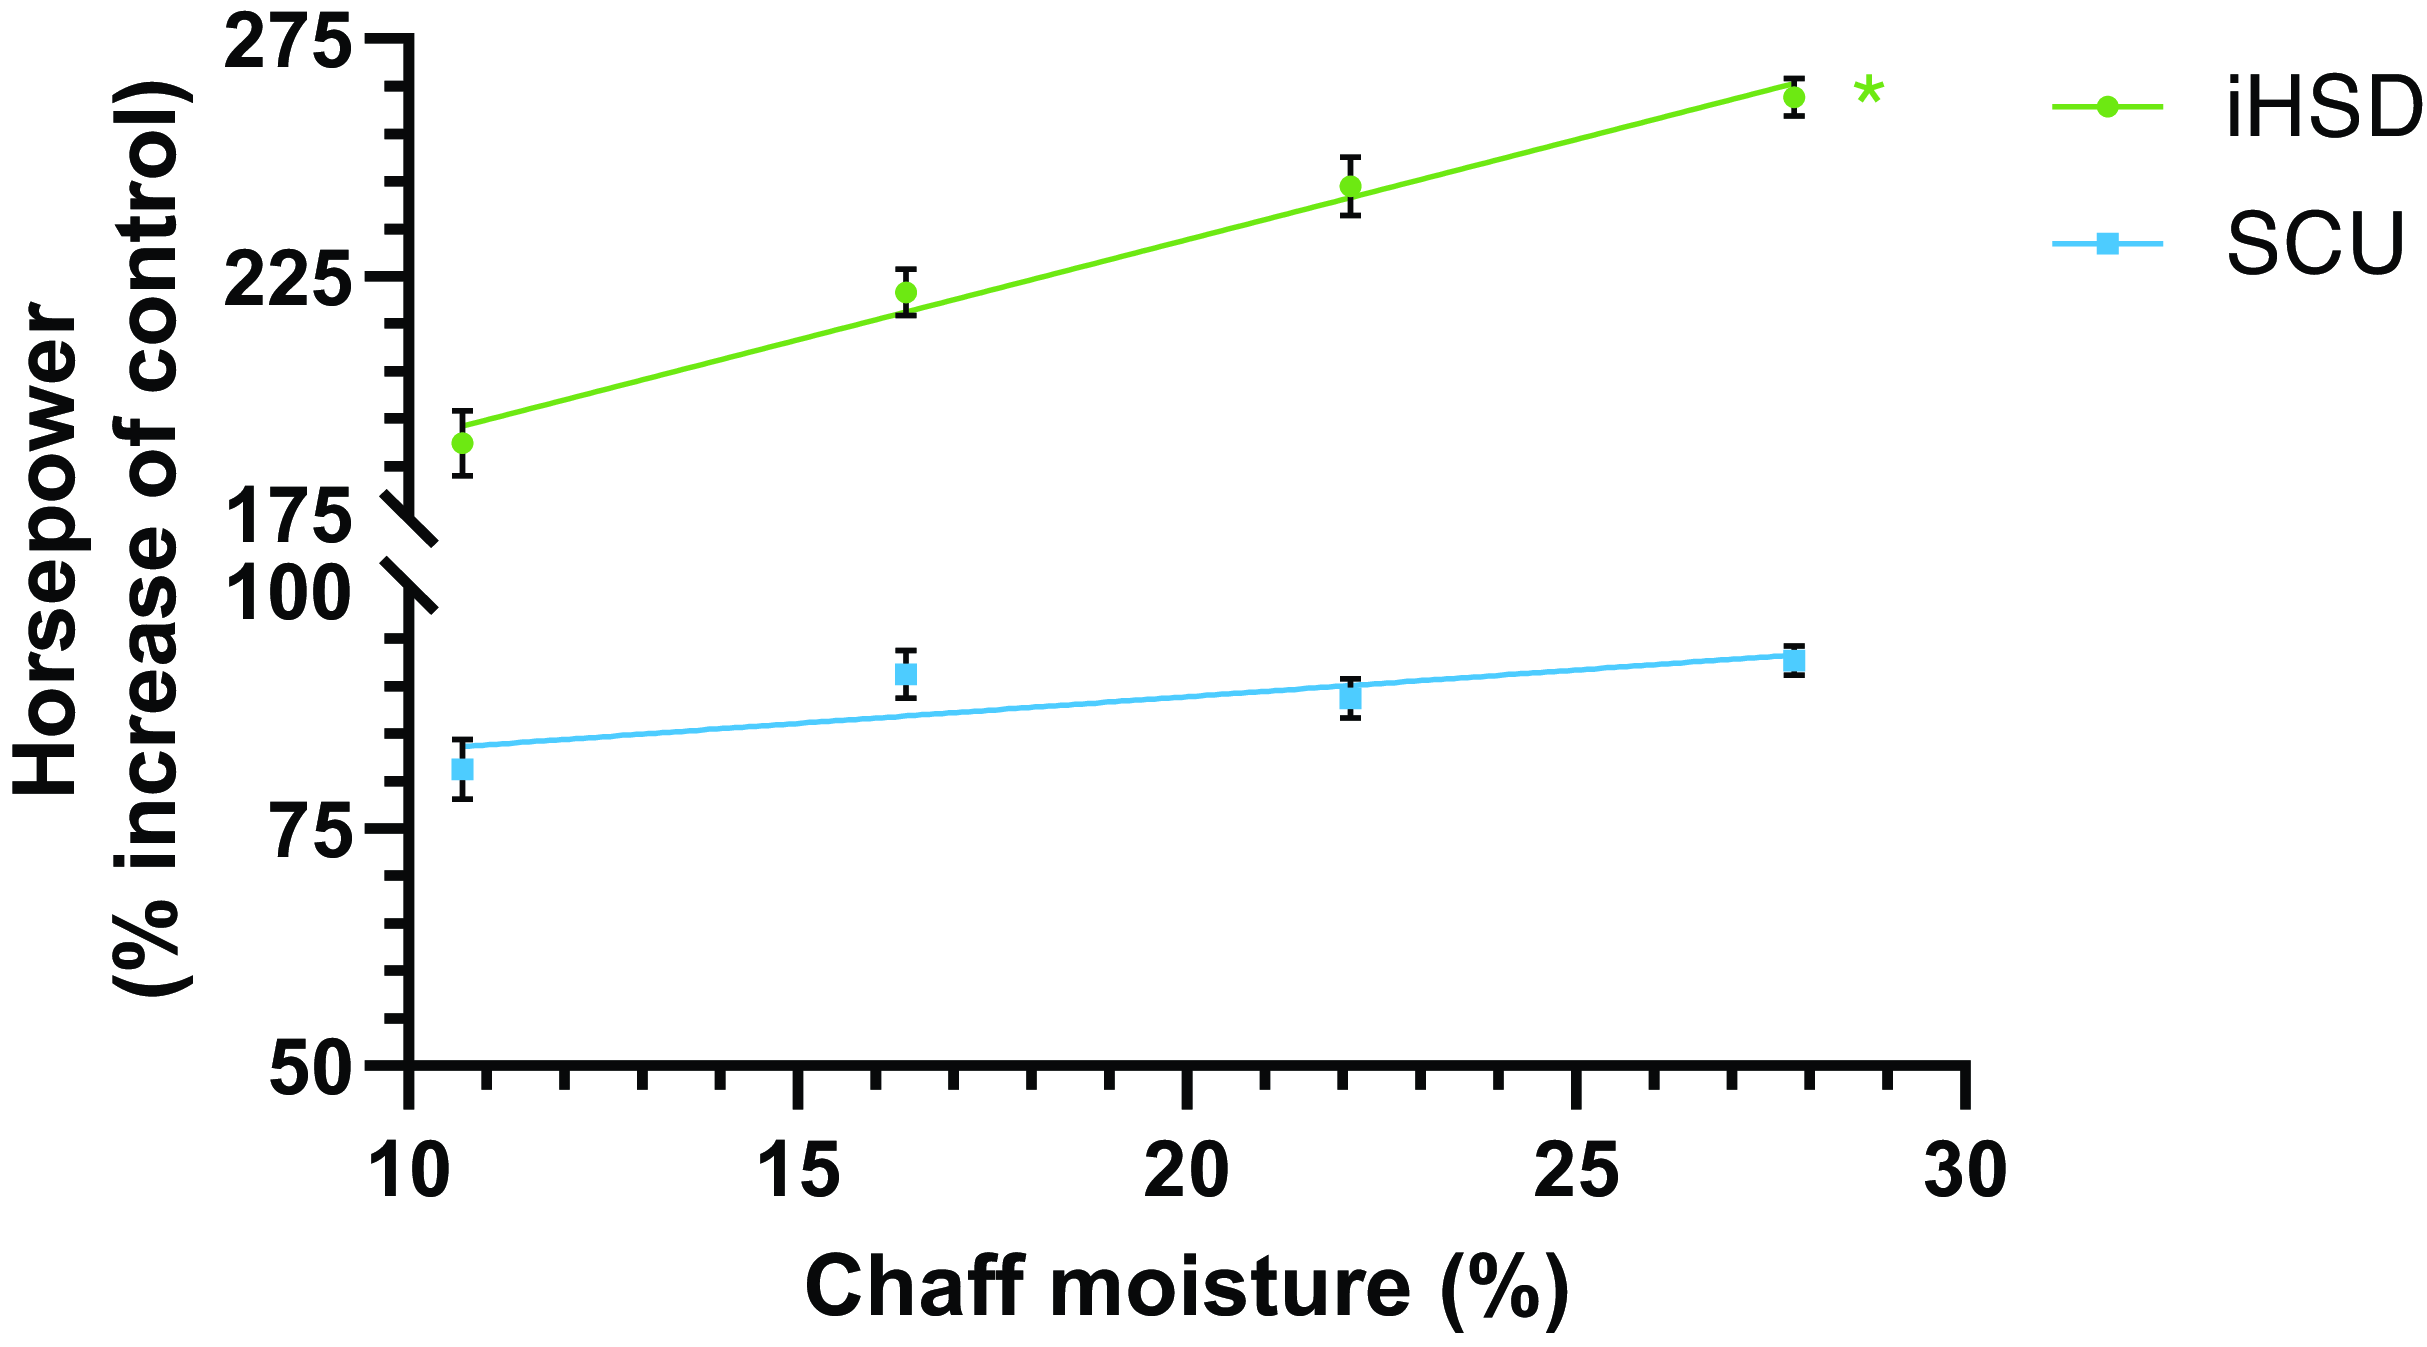
Figure 5. Horsepower required to power the integrated Harrington Seed Destructor (iHSD) and Redekop Seed Control Unit (SCU) as chaff moisture increases. The data represent a percent increase from the horsepower required to power an empty mill (i.e., control). Points represent the mean, bars represent the SE, and lines with asterisks (*) represent significant linear regressions (P < 0.05). n = 40 per mill.
In conclusion, as the data from this study indicate, seed impact mills have the potential to be useful tools in commercial wheat production in North America. The high seed kill rates (>91%) that we observed for problematic weed species provide an opportunity for farmers to kill these seeds before they can be returned to the soil seedbank. However, the relatively lower seed kill for weedy L. perenne ssp. multiflorum in adverse harvest conditions, such as high chaff moisture, could pose a threat to adoption. Overall, seed impact mills show promise; however, further studies evaluating the morphological characteristics that make Lolium spp. hard to kill and how less-than-ideal harvest conditions at commercial scale affect seed impact mill use are needed.
Acknowledgments
The authors appreciate the help of Kevin Bamber and various undergraduate employees for their assistance in this work. The authors are grateful to Redekop Manufacturing for providing the Seed Control Unit test stand and de Bruin Engineering for providing the Integrated Harrington Seed Destructor test stand.
Funding statement
Funding was provided in part by the U.S. Department of Agriculture–Agricultural Research Service (agreement no. 58-8042-1-049), U.S. Department of Agriculture–National Institute of Food and Agriculture (award no. 2021-70006-35760), the Virginia Soybean Board, and the Virginia Small Grains Board.
Competing interests
The authors declare no conflicts of interest.


 Open access