


Policy Significance Statement
This article presents a groundbreaking augmented intelligence-driven prediction model developed to forecast multidimensional vulnerability levels across Afghanistan with a high predictive accuracy. It not only contributes to enhancing the UN Early Warning (EW) Mechanisms but also underscores the potential of augmented intelligence in addressing intricate challenges in conflict-ridden regions. The research also proposes a holistic platform to enhance policy decisions (EPDs) through augmented intelligence, including an EW mechanism to significantly improve EW processes. The EPD platform can provide vital tools for navigating the complexities of sustainable development and resilience, empowering decision-makers with data-driven insights. Furthermore, the EPD platform ensures that human control remains central to the decision-making process in line with the UN’s core values.
Introduction
This article aims to demonstrate that the augmented intelligence-driven prediction model offers a breakthrough solution tailored for data-limited conflict zones such as Afghanistan. It derives its conclusions from a joint pilot project by the United Nations Development Program (UNDP) and the United Nations Assistance Mission in Afghanistan (UNAMA) to predict multidimensional vulnerability levels (MVLs) across Afghanistan using augmented intelligence. The experimental conceptual framework seamlessly integrates human expertise with machine learning (ML), achieving a high level of prediction accuracy even in the absence of extensive data or a well-established empirical blueprint. It further proposes the creation of a comprehensive platform, termed the “enhanced policy decision-making (EPD) platform,” utilizing the augmented intelligence model. This platform includes an EW mechanism designed to significantly enhance EW processes within the UN institutions. The goal is to improve policy decisions in the field, facilitating proactive measures to avert or mitigate potential challenges and simulate various strategic outcomes for forward planning.
The UN institutions face several challenges in conflict zones, which necessitate the use of augmented intelligence. Since 2017, the UN (2023) has been strategizing to execute structural reforms for “a modern United Nations system, rejuvenated by a forward-thinking culture, and empowered by cutting-edge skills fit for the twenty-first century.” To this end, augmented intelligence can address interconnected challenges, inter alia, climate, displacement, poverty, drought, and food security while bolstering the UN sustainable development goals (SDGs) by addressing vulnerabilities and enabling informed decision-making in critical areas. The unique value proposition of the augmented intelligence model can help overcome several challenges that the UN field missions and institutions face:
Supplementing human capabilities using augmented intelligence instead of substituting them as aimed by artificial intelligence (AI): In the UN’s intricate operational landscapes, the expertise of UN staff remains a critical element in ML processes. This synergy ensures that human judgment, ethical considerations, and contextual understanding complement augmented intelligence capabilities.
Merging of machine competence and human comprehension: Augmented intelligence amalgamates human understanding (causation-driven) and machine proficiency (correlation-based) to yield optimal and effective outcomes.
Addressing data scarcity in conflict zones: Augmented intelligence adeptly predicts without extensive data or a well-established empirical conceptual framework, crucial in data-limited conflict zones where UN institutions and field missions operate.
Providing insights for sustainable solutions: Augmented intelligence, which combines human expertise with AI, provides more transparent and interpretable insights compared to traditional “black box” models like deep learning. This transparency is crucial for policy and decision-makers, especially within organizations such as the UN, since augmented intelligence offers explanatory insights (diagnostic) that help understand the underlying causes of a problem. This is in contrast to the often opaque outcomes provided by deep learning models, which can be challenging to interpret. Understanding the “why” behind data patterns enables more informed and justifiable decisions while enhancing the accountability and trust since the decision-makers need to justify their actions to various stakeholders, including affected communities and member states. Clear explanations of augmented intelligence-driven insights help in formulating policies that are more precise and effective. Policymakers can evaluate potential outcomes and impacts more accurately when they understand the causal relationships and contributing factors highlighted by augmented intelligence. They can communicate their decisions and the rationale behind them to the public and other stakeholders fostering accountability and trust, as stakeholders can see and understand the basis of their decisions.
Promoting ethical use of technology in the UN: Integration of augmented intelligence does not relinquish ethical obligations to the algorithms. It ensures “meaningful human control” over technological processes. As explained above, it creates transparency by answering the why question as opposed to black box models. It prevents the creation of noise and wrong correlations, which black box models may produce while making explicit of the way the system is trained by integrating human intervention in the process, ensuring minimization of the risk of bias.
The pilot project conducted by UNDP and UNAMA aimed to accomplish three overall objectives: strengthening data-driven practices, piloting human-machine teaming methodology to significantly improve EW processes, and creating best practices applying ML in UN EW mechanisms.
With a view to assessing the capabilities of the augmented intelligence model to accomplish the abovementioned objectives, the pilot project focused on a complex use case: prediction of levels of multidimensional vulnerability and its principal components (PCs), which are economic, financial, essential services and environmental, across Afghanistan. In doing so, the UNDP aimed at supporting the SDGs effectively, such as ending poverty and hunger, by categorizing and prioritizing regions based on their MVLs with a higher confidence; and identifying the areas where vulnerability levels will likely deteriorate in the coming months even though they are not currently considered high-risk areas.
The overarching objective of the pilot project remains to enhance the predictive capabilities of the system, ensuring robust and accurate forecasts across all dimensions of vulnerability. As the findings demonstrate, further research is needed to refine both the models and the conceptual framework of MVL, given the divergent patterns in prediction accuracy across different components.
First, this article elaborates on the key concepts such as multidimensional vulnerability and augmented intelligence. Second, it discusses the key challenges that UN institutions in the field face, such as data scarcity and the absence of well-established empirical conceptual frameworks discommoding the integration of AI in the daily workflow. Third, it demonstrates the methodology used in the pilot project to overcome the challenges and forecast the MVL. This article concludes with a discussion on the implications of use of augmented intelligence-driven prediction model by the UN institutions in the field, proposing the development of a platform to enhance UN institutions’ policy decisions for sustainable development and resilience, especially in the conflict-ridden areas with scarce data.
Multidimensional vulnerability assessments methods
According to the United Nation Office for Disaster Risk Reduction (2024), the UN-endorsed definition of vulnerability is “the conditions determined by physical, social, economic, and environmental factors or processes that increase the susceptibility of an individual, a community, assets, or systems to the impacts of hazards.”
Interconnected challenges such as climate, displacement, poverty, and food security have necessitated a multidimensional approach to understanding vulnerabilities and their interconnected nature with one another. Maha Ahmed and Franziska Gassmann’s 2010 research on measuring multidimensional vulnerability in Afghanistan compellingly demonstrated the significance of human proficiency in devising a framework to gauge multidimensional vulnerability in complex environments. Utilizing the National Risk and Vulnerability Assessment 2005 data, their method adopted a holistic approach that transcends mere economic parameters methodically assessing various dimensions of vulnerability, including human security, social capital and accessibility (Ahmed and Gassmann, Reference Ahmed and Gassmann2010).
Given its multifaceted nature, multidimensional vulnerability cannot be directly observed but is inferred from a range of observable indicators. These indicators, representing various dimensions of vulnerability, collectively contribute to and reflect the overarching construct of vulnerability. This approach is grounded in latent variable theory as proposed by Borsboom (Reference Borsboom2005). The efforts toward developing multidimensional approaches are best exemplified by the UNDP’s Multidimensional Poverty Index (MPI), and in collaboration with the Oxford Poverty and Human Development Initiative, Multidimensional Vulnerability Index (MVI). These tools provide a comprehensive assessment of economic, environmental, and social factors using 10 and 11 indicators, respectively, addressing the unique structural challenges faced by countries (Alkire and Santos, Reference Alkire and Santos2010; Assa and Meddeb, Reference Assa and Meddeb2021). Various studies, spanning from 2008 to 2020, highlighted the importance of integrating diverse indicators beyond income in measuring poverty (Abraham and Kumar, Reference Abraham and Kumar2008). Examples include research in the Melanesian Small Island Developing States (McDonald and Feeny, Reference McDonald and Feeny2016), the Hindu Kush Himalayas region (Gerlitz et al., Reference Gerlitz and Macchi2017), Haiti (Lachaud et al., Reference Lachaud and Hruschka2020), and Lebanon (Lyons et al., Reference Lyons, Kass-Hanna and Montoya Castano2021), emphasizing the need for nuanced, multidimensional approaches to accurately capture the complexities of poverty and vulnerability across different contexts.
The COVID-19 pandemic prompted countries to rely on multidimensional approaches for a targeted response in 2020. Bhutan (UNDP Bhutan, 2020); Colombia (Multidimensional Poverty Peer Network, 2020); El Salvador (UNDP Latin America and the Caribbean, 2020a); Honduras (UNDP Latin America and the Caribbean, 2020b); and Pakistan (UNDP Pakistan, 2020) utilized various indices, such as the MVI and the MPI, to assess and address the impact of the pandemic. These tools allowed governments to identify vulnerable groups; geographically map multidimensional poverty; and allocate resources efficiently. In 2021, the UNDP’s Small Island Developing States (SIDS) MVI extended its scope, incorporating 11 indicators for 128 countries to evaluate both long-term structural vulnerabilities and those exacerbated by the pandemic, emphasizing the ongoing importance of multidimensional frameworks in responding to global crises (Assa and Meddeb, Reference Assa and Meddeb2021).
Application of ML techniques to assess multidimensional vulnerability
Recent developments in AI have created an opportunity for its utilization not only to conduct assessments with granularity but also to predict more accurately. According to Google Cloud website (2024), AI is broadly described as an “overarching term that covers a wide variety of specific approaches and algorithms enabling a machine or system to sense, reason, act, or adapt like a human.” According to Columbia University Engineering website (2024), ML is a subset of AI that focuses on training algorithms to learn insights and recognize patterns from data and make increasingly better predictions or decisions without explicitly being programmed. In 2020, the introduction of the Vulnerability to MPI (VMPI) and the integration of Bayesian network classifiers by Mauricio Gallardo in his research utilizing the Chile 2017 National Socioeconomic Characterization Survey, represented a significant step toward integrating ML techniques, which sit under the overarching AI umbrella, in economic studies. This approach marked a shift from conventional economic models such as Probit and Logit toward a more complex and nuanced understanding of multidimensional poverty. In that sense, Gallardo’s study paved the way for a broader use of ML techniques in economics, demonstrating its capacity to handle complex problems, model predictions effectively, incorporate elements of uncertainty, and derive insights from large datasets (Gallardo, Reference Gallardo2020a, Reference Gallardo2022). In 2021, another research on the use of ML by applying ML regression models to estimate the MPI in Ecuador marked a notable departure from traditional approaches, showcasing the effectiveness of Random Forest models. This study not only addressed data scarcity issues in the social sciences but also underscored the growing opportunities presented by increased data availability. By demonstrating the applicability of ML regression models in estimating MPI with sociodemographic variables, the research highlighted a shift toward more sophisticated methodologies in social science research. The findings emphasized the potential of interdisciplinary collaboration and the evolving role of data-driven approaches in enhancing our understanding and addressing complex social phenomena like poverty (Ochoa et al., Reference Ochoa, Castro-García and Arias Pallaroso2021). In 2023, in the study by Guberney Muñetón-Santa and Luis Carlos Manrique-Ruiz ML was adeptly applied to estimate the MPI in Medellín, Colombia. By leveraging spatial data from Open Street Maps and European Space Agency’s land use cover, along with algorithms like Catboost, Lightboost, and Random Forest, the research provided a nuanced, street block-level analysis of poverty. This innovative approach not only expanded the granularity of poverty assessment but also highlighted ML’s versatility in addressing complex social issues. The study underscored AI’s growing role in social policy and poverty eradication, particularly in regions with limited data access, and affirms its capacity to enhance human capabilities through the creative use of open-source datasets (Muñetón-Santa and Manrique-Ruiz, Reference Muñetón-Santa and Manrique-Ruiz2023).
The findings of recent studies stress augmented intelligence’s transformative potential in enhancing human decision-making across various fields, confirming AI–human collaboration’s effectiveness, particularly in conflict regions. Matthew Sadiku and a group of researchers who compared augmented intelligence with AI, noted that augmented intelligence does not replace, but rather enhances, human capabilities as a valuable tool for complex decision-making (Sadiku et al., Reference Sadiku, Musa and Ajayi-Majebi2020). A number of researchers explored the synergy between AI and human intelligence, demonstrating its capability to enhance decision-making, problem-solving, predictive accuracy, and business processes in digital transformation, healthcare, and education by using technologies, such as ML and natural language processing (Zohuri and Mossavar-Rahmani, Reference Zohuri and Mossavar-Rahmani2024; Dave and Mandvikar, Reference Dave and Mandvikar2023). These studies support our research by highlighting augmented intelligence’s benefits and the importance of human–AI collaboration. Our work extends these findings to predict multidimensional vulnerability in conflict-ridden, data-limited Afghanistan, filling a critical gap in the literature.
Application of augmented intelligence to assess multidimensional vulnerability
The capability of ML for a more granularized assessment of the multidimensional vulnerability, especially in conflict-ridden regions characterized by data scarcity, has spawned the idea of augmented intelligence, which is considered as the next level in AI (Sadiku et al., Reference Sadiku and Ashaolu2021). It is a synergistic integration of human cognitive capabilities with AI systems to address the intricacies of vulnerability dynamics while ensuring adaptability and ethical considerations in policy formulation and implementation (Sadiku et al., Reference Sadiku and Ashaolu2021; Liu et al., Reference Liu2017). The adaptive learning capabilities of AI allow for real-time updates and recalibrations in response to evolving circumstances crucial where conditions and data availability can rapidly change (Sadiku et al., Reference Sadiku and Ashaolu2021). This approach aligns well with methodologies developed for multidimensional indices, such as MPI and VMPI, emphasizing a comprehensive and nuanced analysis across diverse dimensions (Alkire and Foster, Reference Alkire and Foster2011; Gallardo, Reference Gallardo2020a). Furthermore, the human-in-the-loop aspect of augmented intelligence ensures robust and context-sensitive decision-making under the uncertainties, leveraging human intuition and experience to guide and refine AI outputs (Liu et al., Reference Liu2017). This blend of human expertise and AI’s advanced techniques is necessary not only for a more comprehensive and accurate analysis but also to ensure ethical integrity and adaptability in policy formulation and implementation, particularly crucial in effectively addressing the challenges in complex contexts.
The key difference between AI and augmented intelligence is that the latter does not substitute human capabilities but supplements them, while the main objective of the AI is to mimic human intelligence. The objective of the augmented intelligence is to amalgamate the advantages of the human comprehension with the machine competence to yield optimal and effective outcomes. Human beings can identify cause and effect relations within a system; comprehend and work with complexity; have intuitive reasoning; and a value system, such as feelings like compassion, and principles like “do no harm.” They can also diagnose the nature of a problem or a condition by examining the symptoms. Nevertheless, they can only deal with small quantities of data and recognize strong signals, which are called “indicators.” Because they are strong signals, they are almost always “late warning” in comparison to the capability of the machine due to their capability to recognize weak signals called as “indications and subcomponents” (Carvalho, Reference Carvalho2021), which are large quantities of information that provide insight into a developing trend. That said, although the machine design is a useful tool for hidden patterns and correlations in large quantities of data, they use descriptive analytics as opposed to human beings’ causal models. Figure 1 shows a visualisation of augmented intelligence in practice.
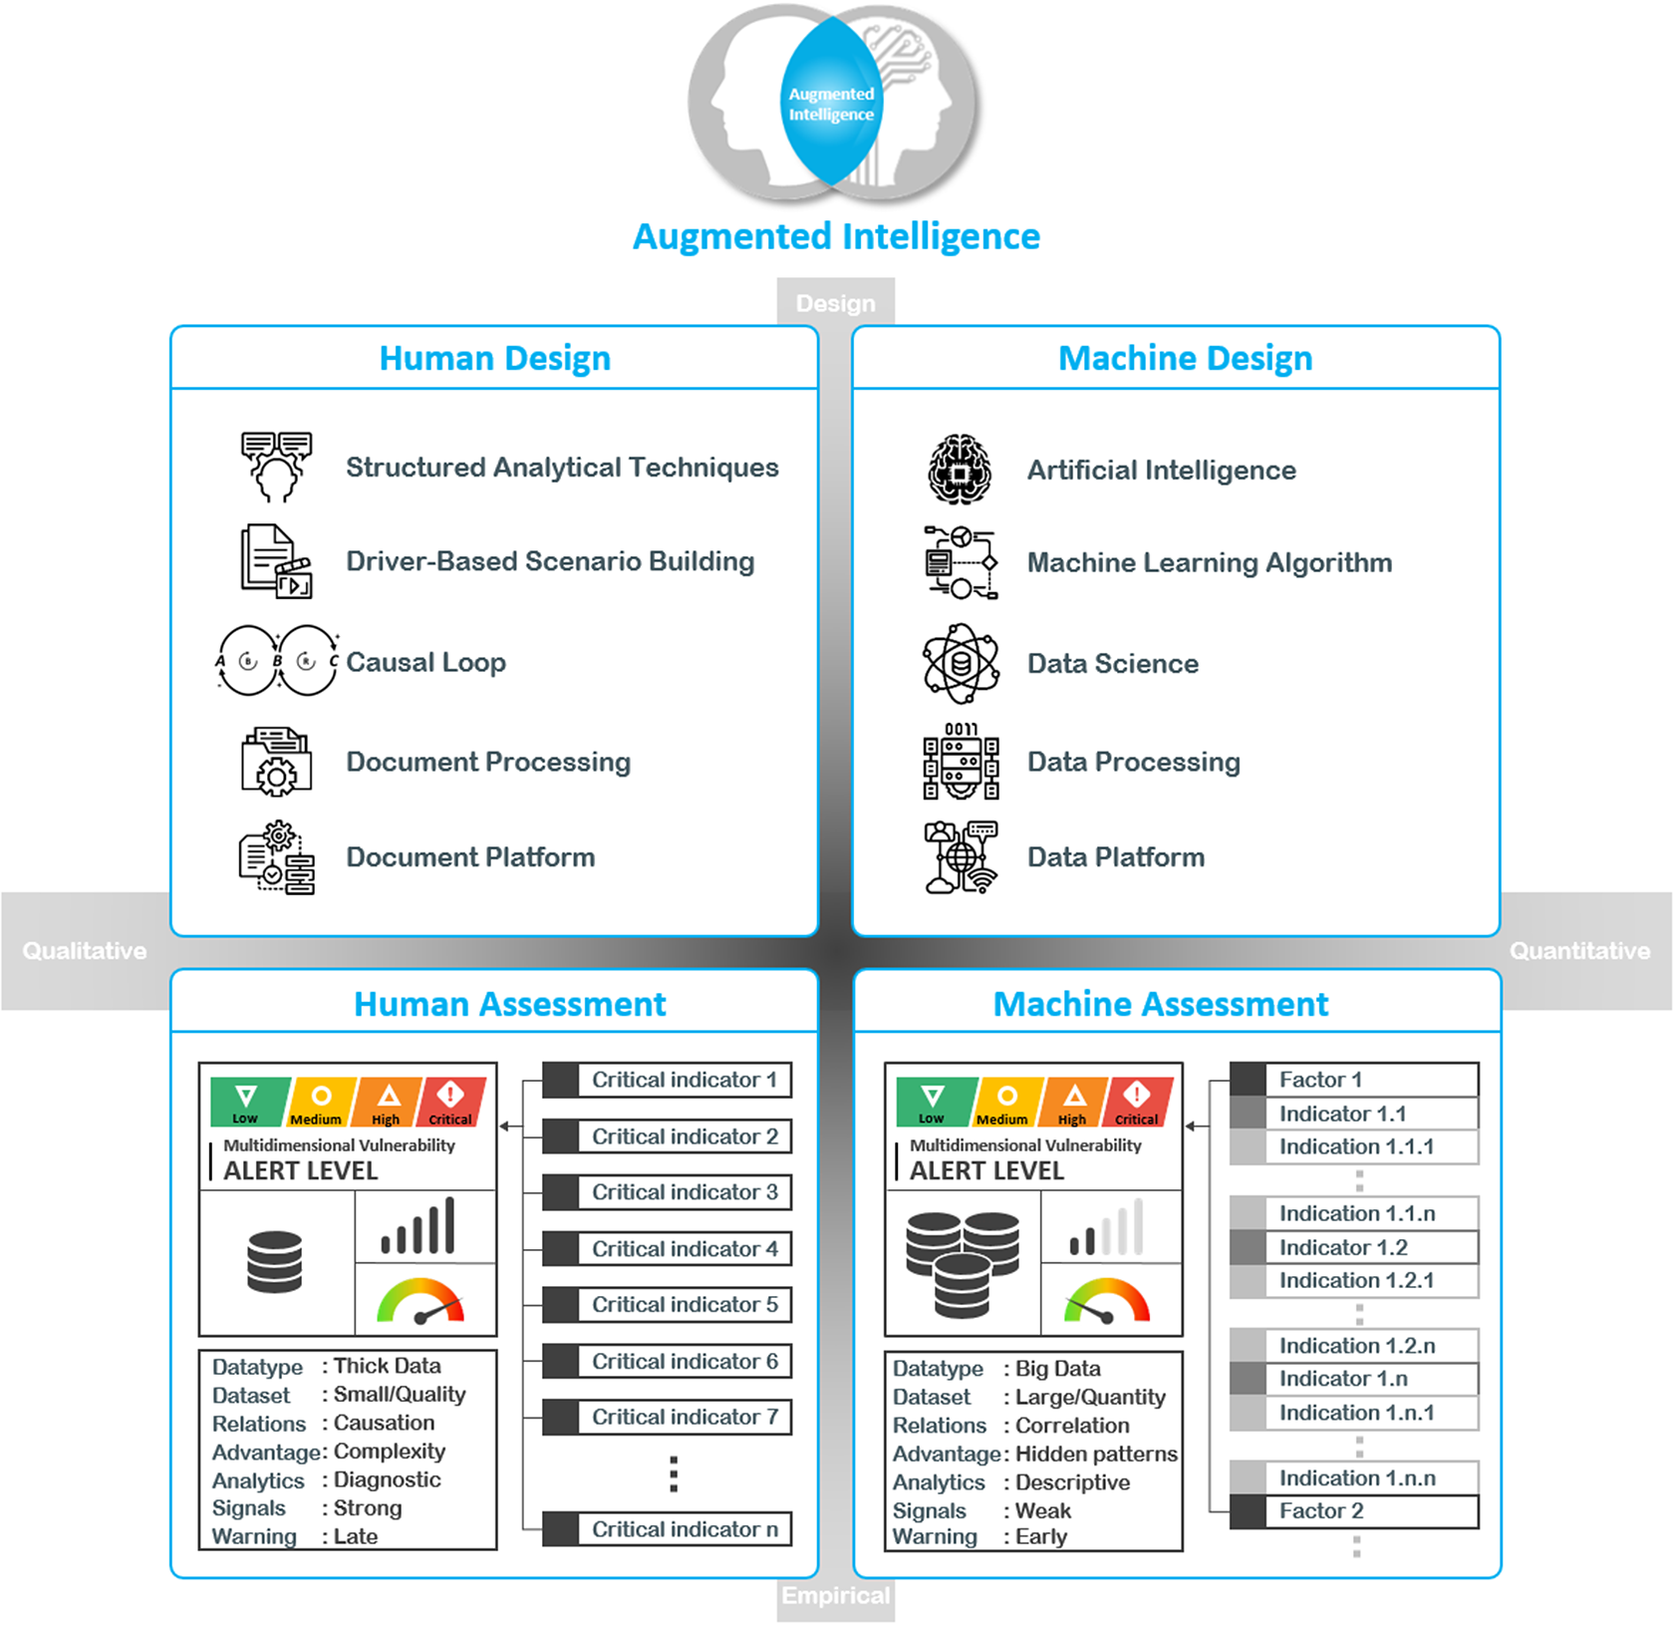
Figure 1. Visualization of augmented intelligence in practice.
Although socioeconomic predictive modeling fundamentally relies on high-quality, extensive datasets, augmented intelligence can adeptly predict without extensive data or a well-established empirical conceptual framework, which is crucial in data-limited conflict zones where UNDP operates. The transparency and explanatory insights provided by augmented intelligence-driven models distinguish it from opaque outcomes generated by AI-generated models, such as deep learning. This transparency is crucial for analysts, policymakers, and decision-makers who require a clear understanding of the reasons behind the outcomes. Moreover, augmented intelligence-driven models align with ethical considerations, ensuring meaningful human control and addressing concerns related to bias and the undisclosed aspects of model training and the nature of data used in black box models.
Defining multidimensional vulnerability as a latent factor
Augmented intelligence-driven prediction model uses the latent variable theory to conceptualize multidimensional vulnerability as it provides a robust framework for understanding the interconnectedness of various factors contributing to susceptibility or exposure to risks. Such a nuanced and multifaceted approach, considering diverse dimensions, such as socioeconomic instability, social disparities, and environmental risks, exemplifies human capability in understanding and addressing the intricate facets of vulnerability in post-conflict countries, such as Afghanistan.
To this end, the statistical method, factor analysis, is particularly suited to identifying underlying structures in datasets with multiple observed variables. By applying factor analysis to the different dimensions of vulnerability, we can uncover the latent factor (or factors) that effectively represent the multidimensional nature of vulnerability. This aligns with the methodological approaches advocated in the latent variable theory (Borsboom et al., Reference Borsboom, Mellenbergh and Van Heerden2003). According to the research conducted by Denny Borsboom, Gideon Mellenbergh and Joop Van Heerden, the relationships between latent factors and its components are likely not unidirectional (Borsboom et al., Reference Borsboom, Mellenbergh and Van Heerden2004). The different dimensions of vulnerability may not only contribute to the overall state of vulnerability but may also be influenced by it, suggesting a reciprocal causation model. This complexity is acknowledged and accommodated within the latent variable framework.
Treating multidimensional vulnerability as a latent variable acknowledges the inherent probabilistic relationships between observable dimensions and the latent construct, consistent with the epistemological considerations in the latent variable theory (Borsboom, Reference Borsboom2005). This approach requires a solid theoretical understanding of the construct and interactions as well as potential reciprocal influences among dimensions and their contributions to the state of vulnerability (Borsboom et al., Reference Borsboom, Mellenbergh and Van Heerden2003). By using factor analysis to conceptualize vulnerability, researchers can identify key dimensions for targeted interventions (Borsboom, Reference Borsboom2006). In conclusion, this methodological approach aligns with the latent variable theory, facilitating a nuanced understanding of the complex interplay among various dimensions of vulnerability and guiding effective research and intervention efforts.
The use case: predicting MVLs across Afghanistan
The UNDP’s (2024) recent 2-year review of the economic situation in Afghanistan underscores the need for a multidimensional approach to understand and address the country’s challenges through the Subsistence Insecurity Index, which demonstrates that 69% of Afghans face subsistence insecurity, providing a comprehensive measure that goes beyond traditional monetary poverty metrics. These data shed light on environmental and economic vulnerabilities exacerbated by factors such as drought and economic shocks while drawing attention to the importance of addressing social dimensions, as evidenced by gender disparities in employment and education. This holistic perspective is crucial for crafting effective policy responses in Afghanistan’s complex context.
To this end, the use of augmented intelligence-driven prediction model indeed holds promise for addressing complex challenges in Afghanistan by synthesizing diverse datasets from economic indicators to social metrics; adapting to dynamic sociopolitical environment; optimizing resource allocation due to shrinking resources; compensating for the erosion of institutional capacities; supporting policy formulation data-driven insights; and making predictions without extensive data.
Human intelligence led process of the augmented intelligence-driven prediction model
UNDP subject matter experts (SMEs’) objective was to predict the four PCs or vulnerabilities that collectively form multidimensional vulnerability across Afghanistan, as illustrated in Figure 2. These PCs encompass economic, financial, environmental, and essential services, across Afghanistan. To this end, a minimum viable product (MVP) was established, aiming for a prediction accuracy of 70%–75% in data-rich regions, with a 3-week lead time. The process commenced with data collection and preprocessing while UNDP SMEs identified PCs. Their goal was to construct a robust conceptual framework for MVL. Additionally, the SMEs devised initial indicators to formulate a PC indicator relevance matrix. This matrix served as a crucial tool, facilitating the identification of an exponential number of indications and subcomponents that surpass human capacity to detect, thereby maximizing the machine’s analytical capabilities.
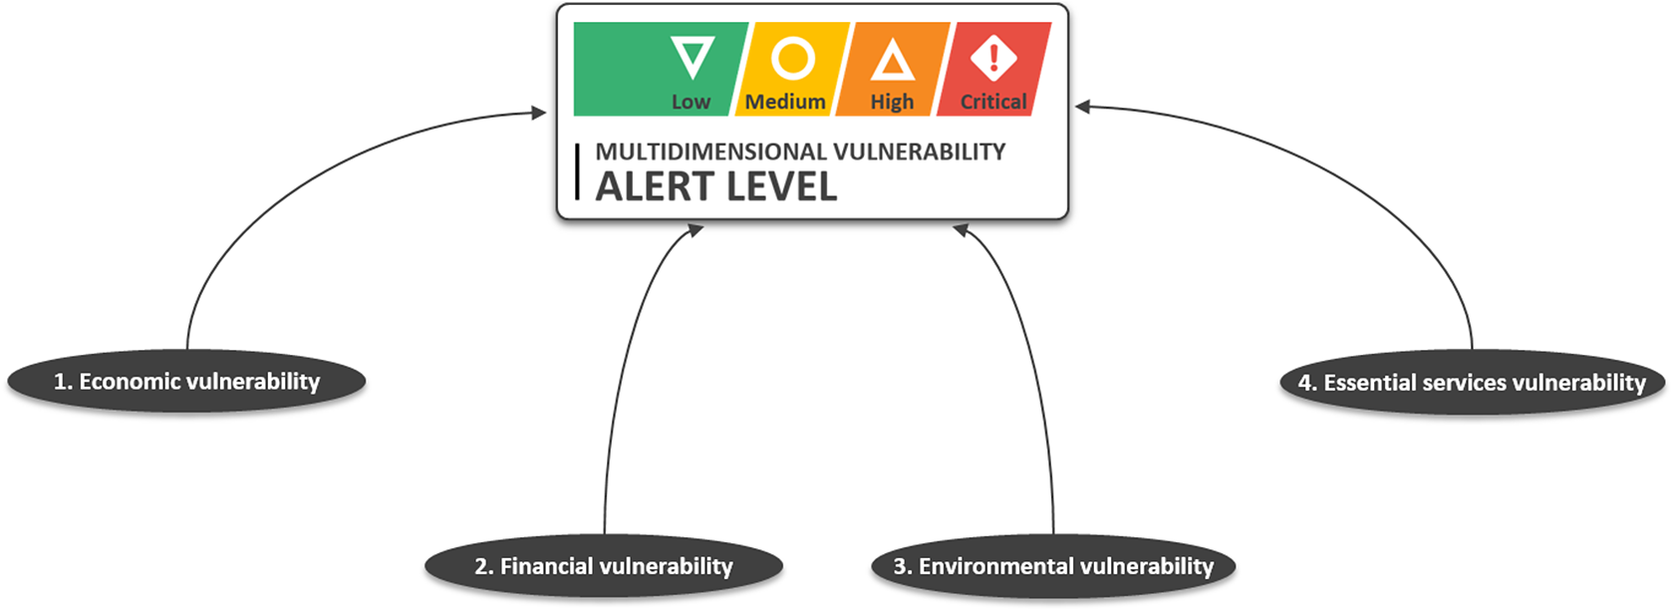
Figure 2. Strategic conceptual framework developed by SMEs—the human intelligence (HI) component of augmented intelligence—for MVL, encompassing four principal components: economic vulnerability (Ec), financial vulnerability (Fi), environmental vulnerability (En), and essential service vulnerability (Es). Causality between the principal components and the value to be predicted (MVL) is assumed.
There are various challenges in applying traditional ML techniques to predict the MVL in Afghanistan since the methodology should address issues, such as data scarcity, missing data, and the absence of a clear definition or labeled dataset for MVL. The traditional supervised ML process is visualized in Figure 3. It includes cleaning and transforming the data into a format suitable for computer processing, while its scaling to a common range might also be necessary. Importantly, labeling the data assigns known outcomes or categories to each data point, providing the basis for the algorithm to learn and make predictions. These labels serve as the ground truth as the model seeks patterns or rules within the labeled data to learn how to make accurate predictions. After training, the program’s performance is evaluated using a separate set of data that it has not seen before. This testing phase assesses the program’s ability to generalize its learning and make predictions on unseen data, which is crucial for its real-world applicability. Nevertheless, this straightforward traditional methodology was unable to yield any meaningful results due to the mentioned challenges, therefore, requiring innovative solutions based on augmented intelligence methodology.
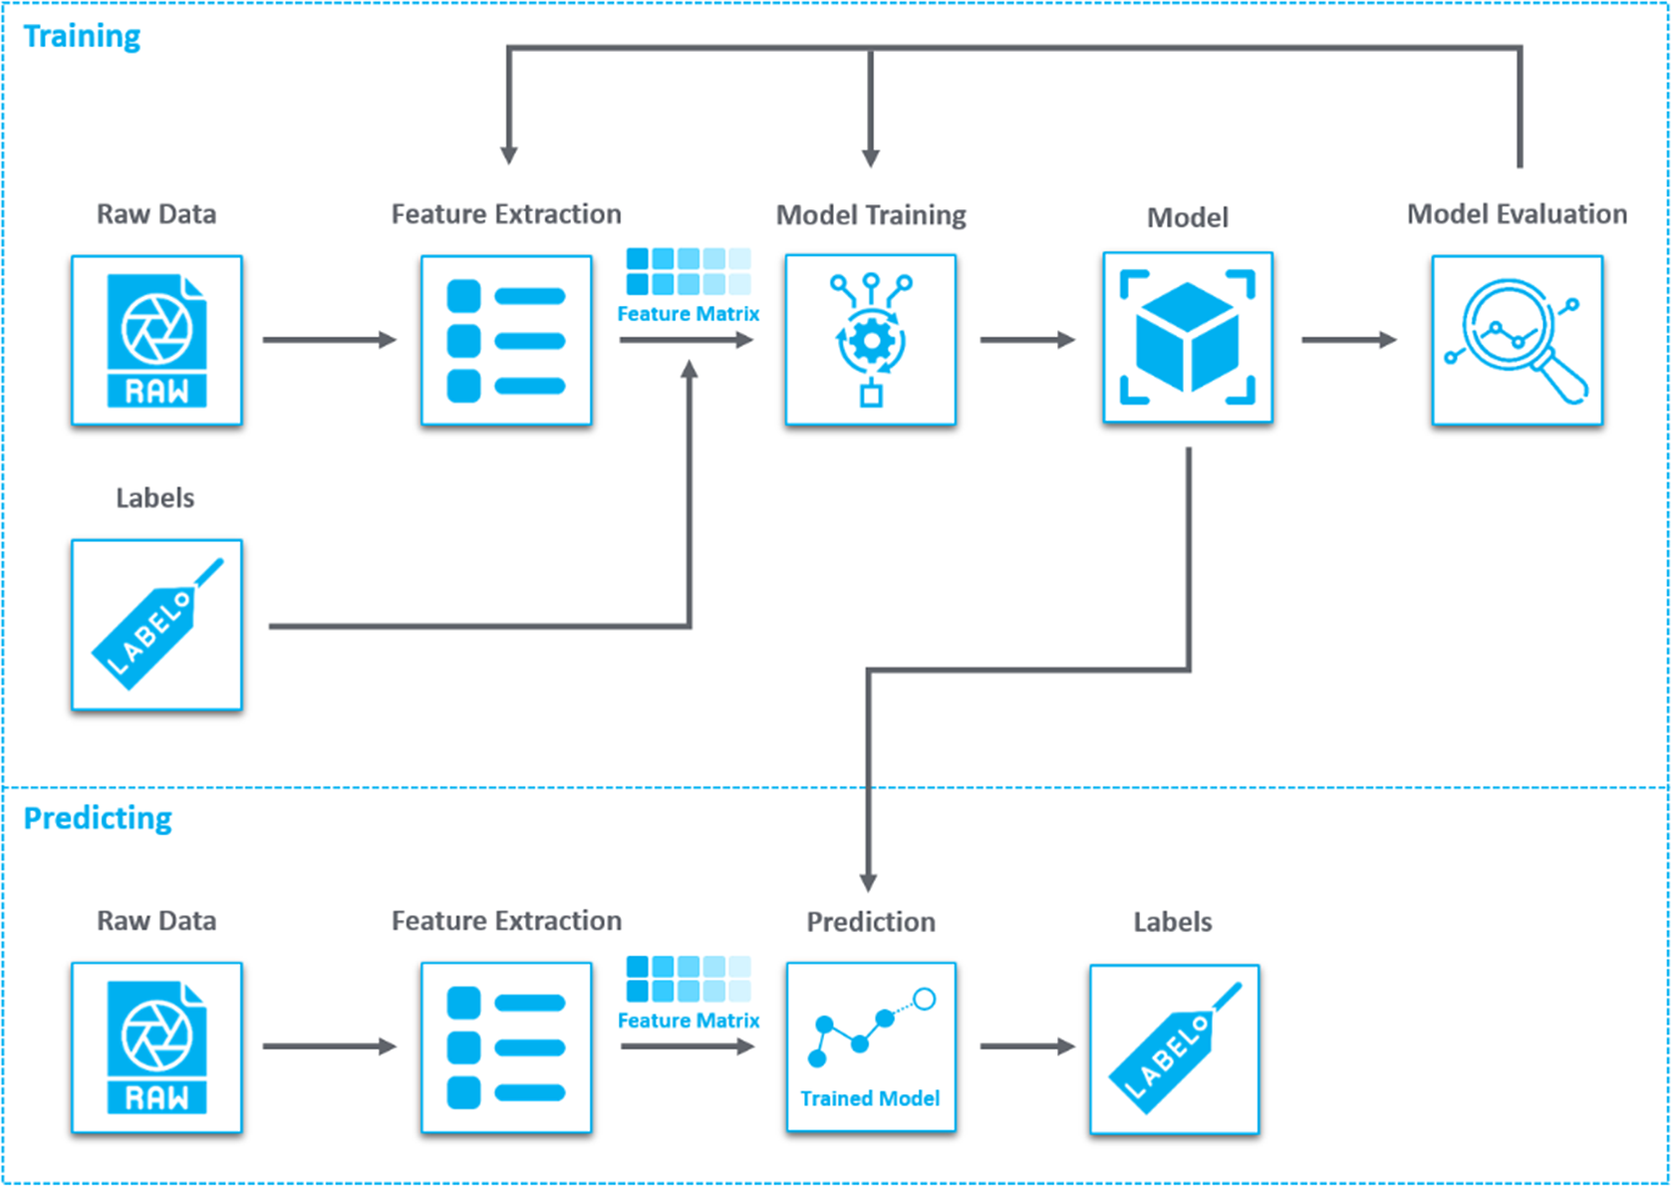
Figure 3. Visualization of a conventional supervised ML training and prediction process utilizing features.
AI led process of the augmented intelligence-driven prediction model
To compute the MVL, a series of methodologies were employed, encompassing recursive feature elimination (RFE), temporal projection, indicator forecasting, confirmatory factor analysis (CFA), PC-indicator score generation, and PC dimension reduction and scaling. These methodological steps are visually depicted in the components of the prediction chain, numbered 1 through 10, as illustrated in Figure 4.
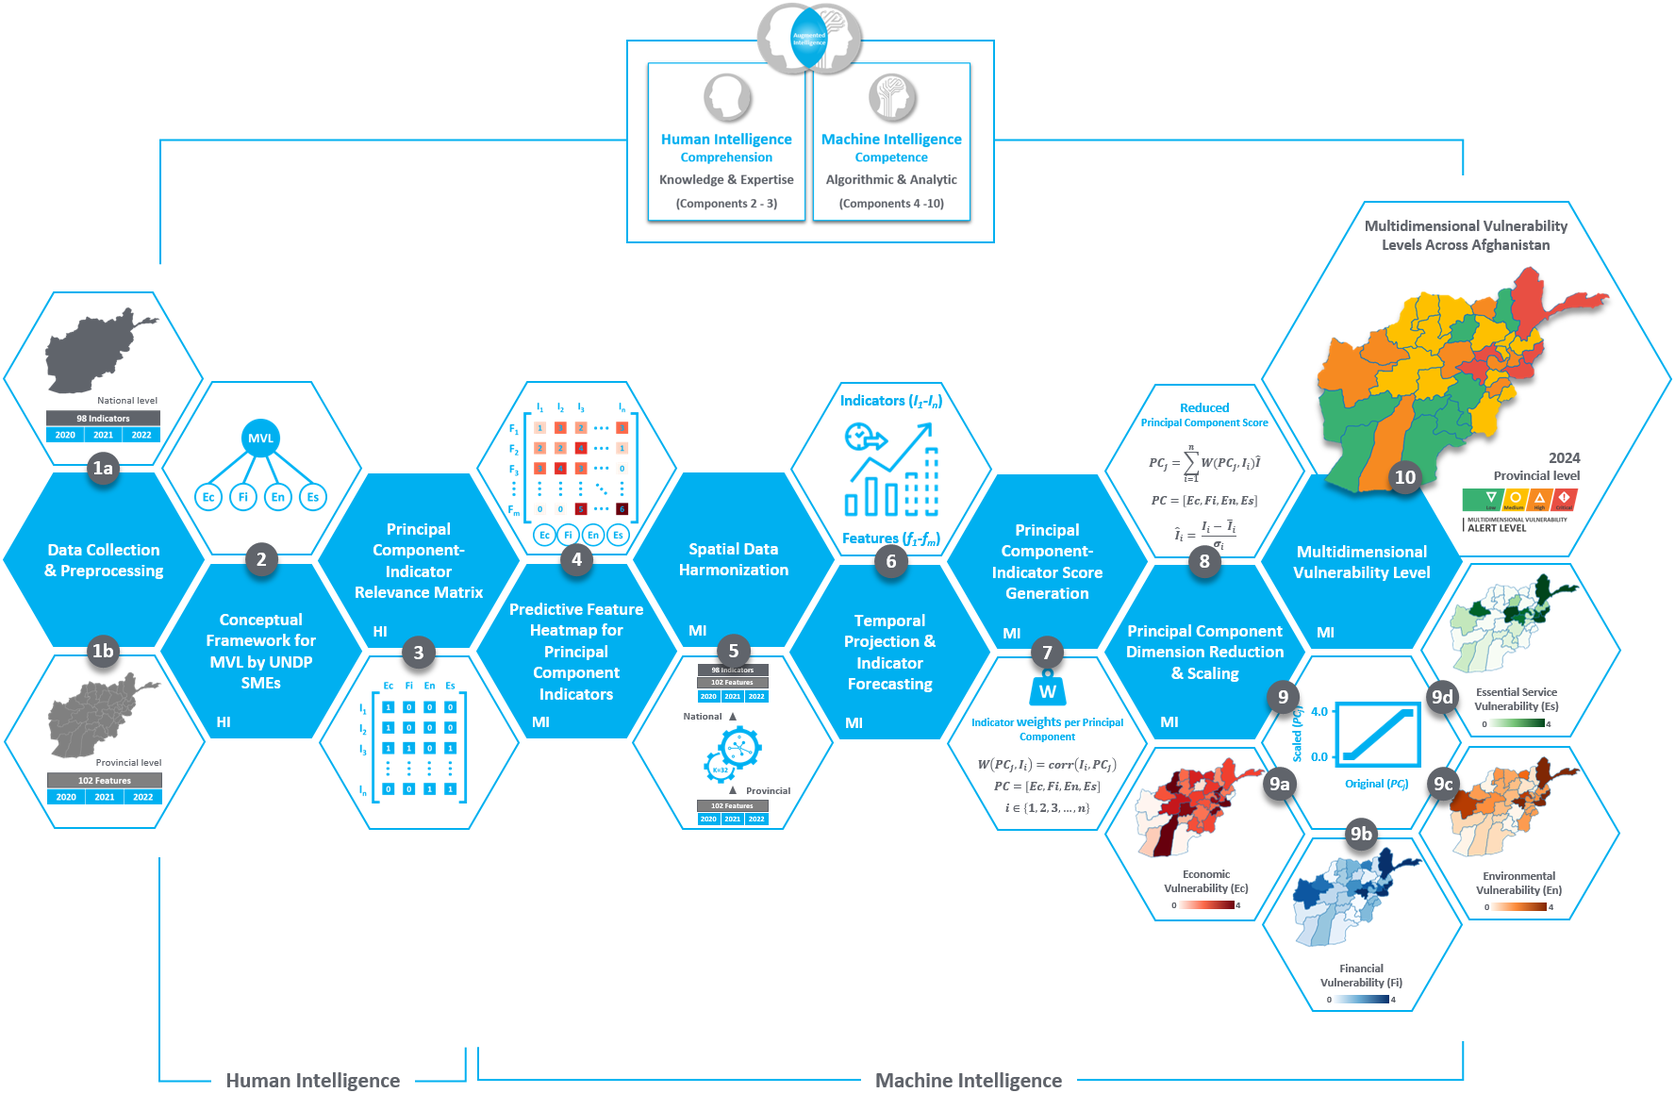
Figure 4. The augmented intelligence-driven prediction model depicted as a prediction chain, illustrating the fusion of human and machine intelligence. Components 2–3 represent human intelligence, embodying human knowledge and expertise, while components 4–10 represent machine intelligence, encompassing algorithmic capabilities and analytic capacity. Together, these components constitute the augmented intelligence within the prediction chain.
Challenges
The absence of existing labels (dependent variable) has been one of the key challenges. Instead of directly predicting MVL, the augmented intelligence-driven prediction methodology modeled MVL as a latent factor using common factor analysis, leveraging human comprehension. Aggregating the weak signal dataset to the national level by taking the weighted average of provincial values relative to population density successfully aligned the datasets of different geographical aggregation levels. This process ensured that both datasets were compatible for effective comparison and analysis. Standardizing the geographical level enabled further analysis and integration of the weak signal dataset with the domain expert-based human framework dataset, facilitating a more comprehensive understanding of the MVL and its predictors.
The absence of well-established empirical models or conceptual frameworks makes the use of traditional ML approaches very difficult in this project. While having an existing framework or model of MVL would simplify labeling, in their absence, augmented intelligence offers a promising alternative. By leveraging human comprehension, to model multidimensional vulnerability as a latent factor was a feasible solution, paving the way for using common factor analysis to construct PCs from the available indicators/indications. This human-centric approach complements ML techniques, allowing for a more nuanced understanding and prediction of MVL in Afghanistan.
The absence of extensive data was one of the biggest challenges for the pilot project. The limited extent of the dataset, spanning only 3 years would pose a challenge for traditional ML approaches, especially for capturing complex relationships inherent in weak signals. Nonetheless, there is an opportunity to utilize the data for predicting the less prominent aspects or “leaves” of the conceptual framework (as depicted in Figure 5), employing the weak signals identified within the machine-generated dataset.
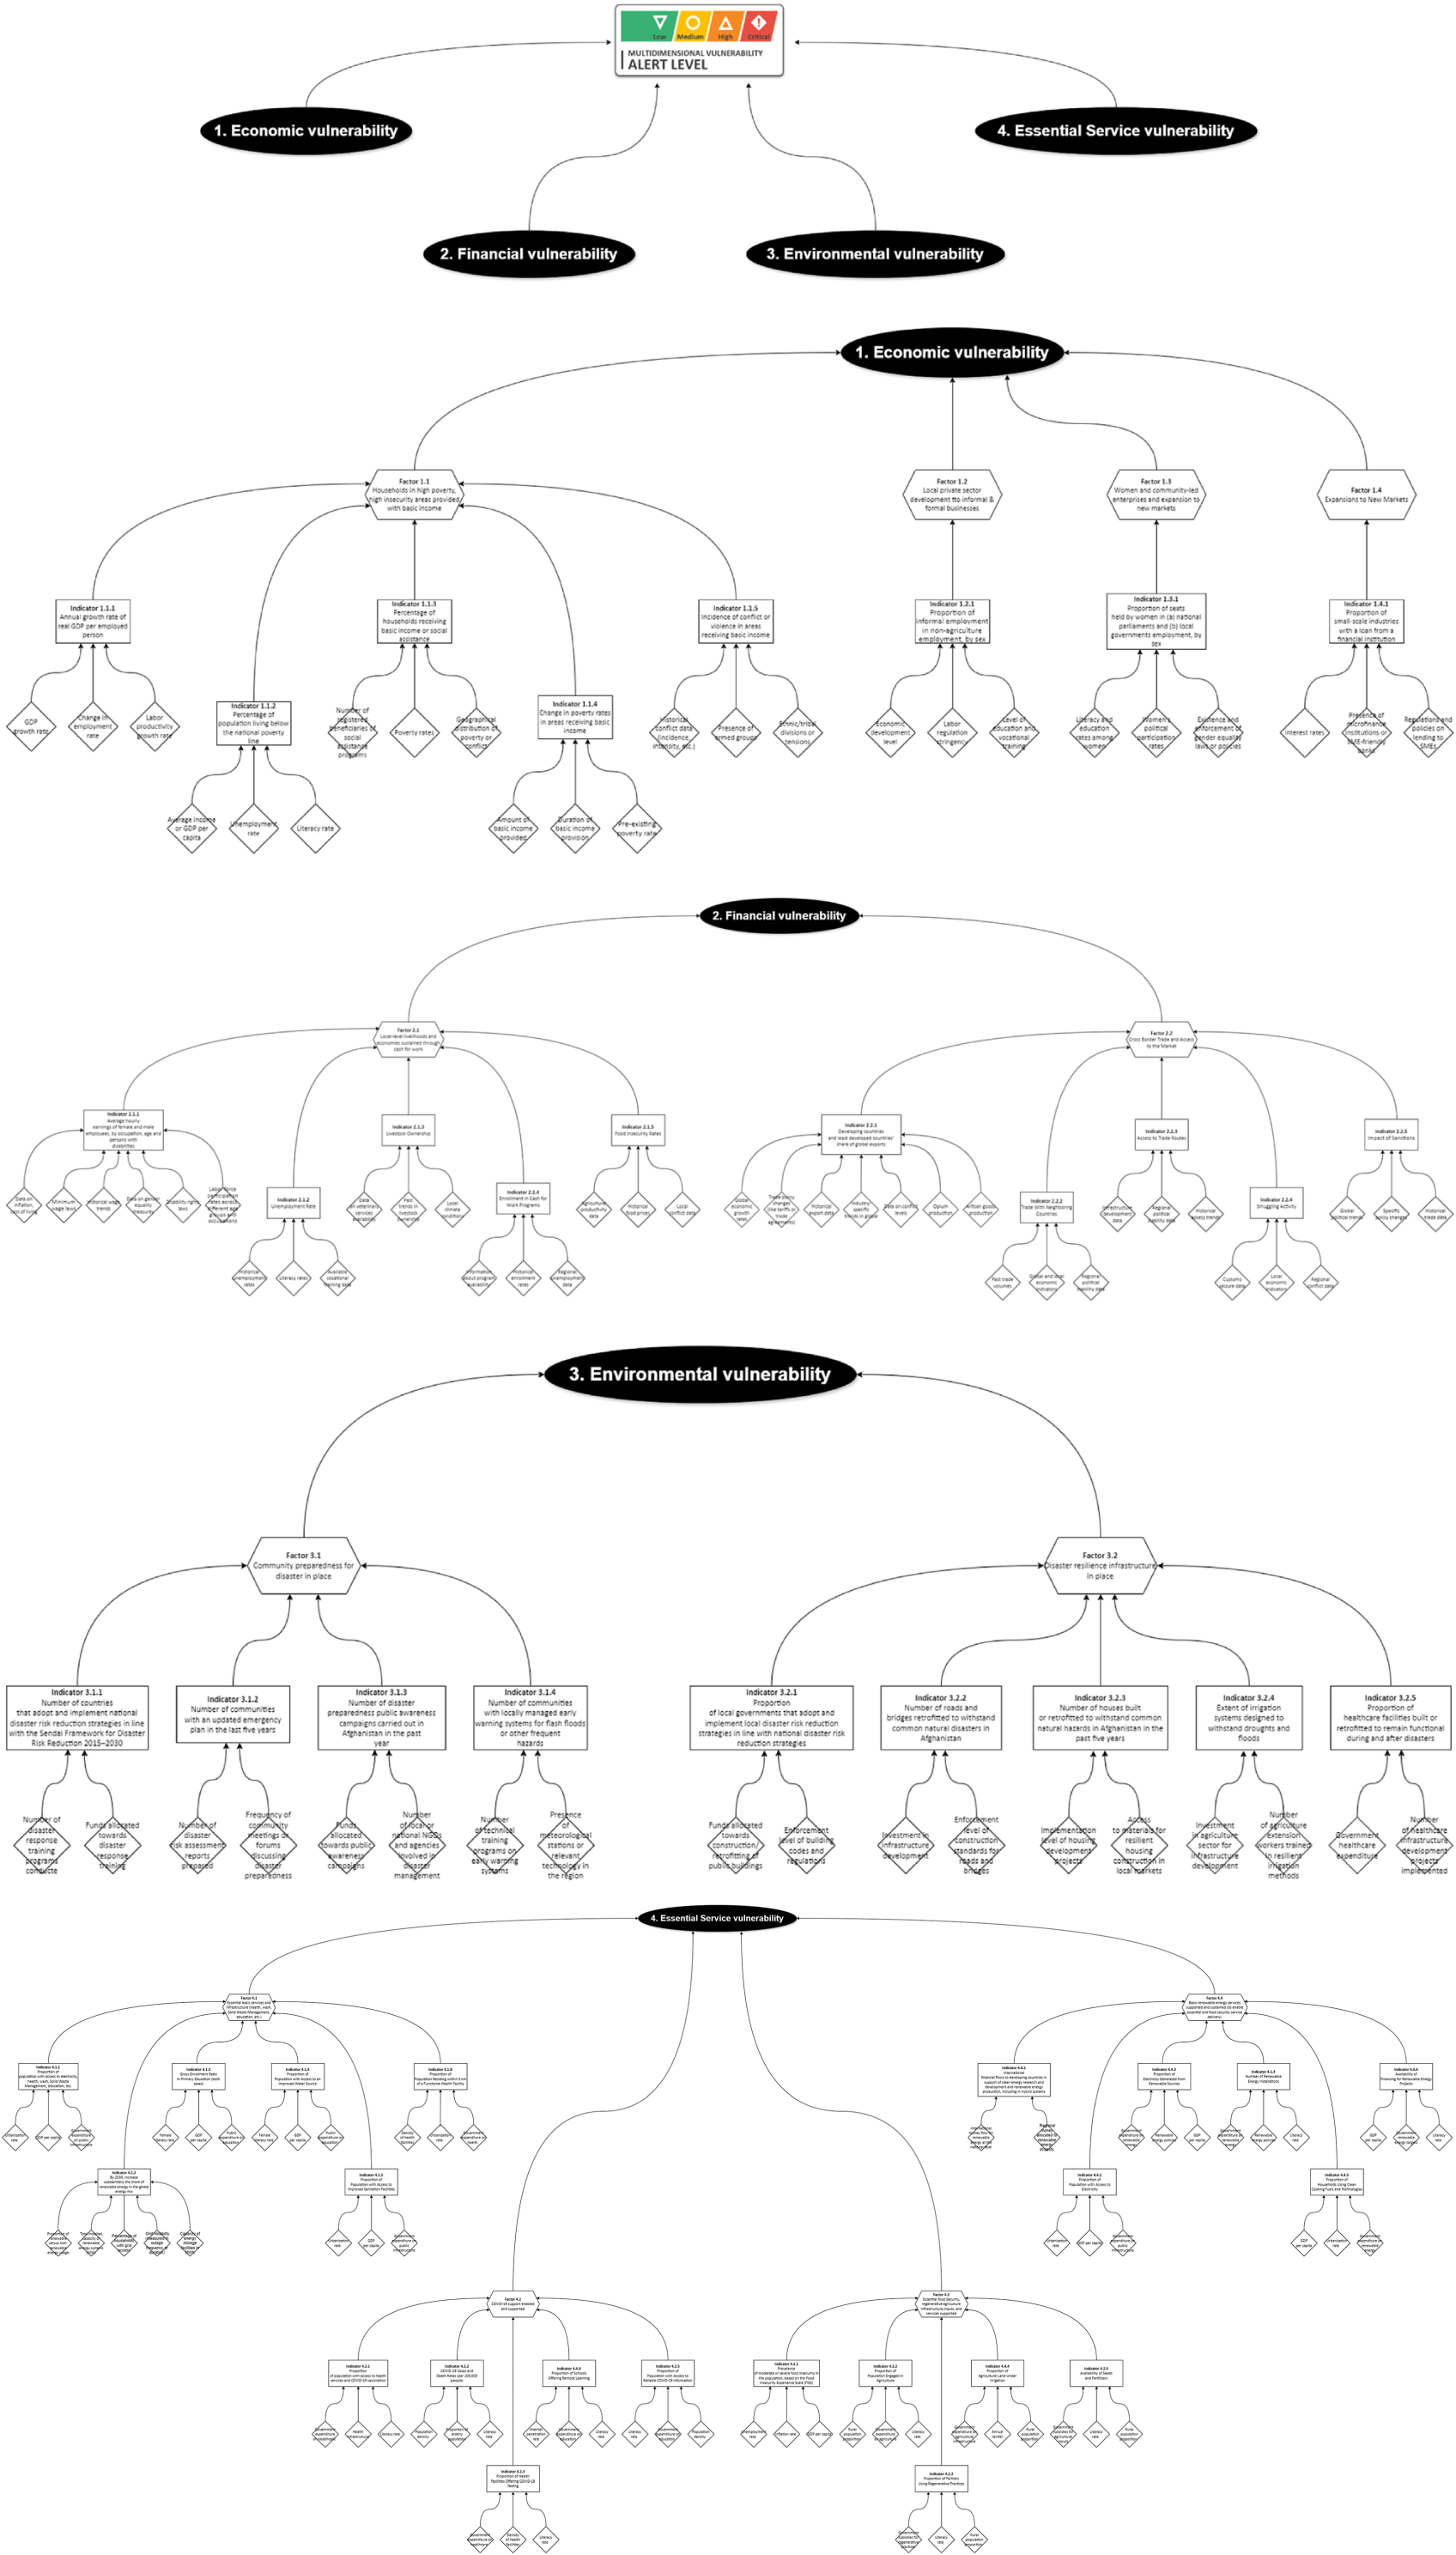
Figure 5. Comprehensive conceptual framework developed during the divergence phase of this use case, resulting in underlying factors, indicators, and indications (analogous to branches and leaves).
This approach allows for focusing on predicting the less influential components of the project, which may be more feasible given the constraints of the available data.
The augmented intelligence-driven prediction model
Step I: Data collection and reprocessing
Two datasets were collected. The first dataset was at the national level, representing a conceptual framework developed by UNDP domain experts qualitatively, encompassing the PCs and their subsections, such as indicators and indications. This dataset is partitioned into four distinct subsets, each aligned with a PC and encompassing varying quantities of features assuming causality with the target value to be predicted. These features are identified as robust indicators (i.e., strong signals) for the components of MVL. The national dataset sources for the indicators included World Bank, Humanitarian Data Exchange, Global Alliance for the Future of Food, Food and Agriculture Organization, The International Renewable Energy Agency, The United Nations Educational, Scientific and Cultural Organization, UNDP’s BOOST Impact Acceleration Program, and The International Labor Organization. These sources covered approximately 93% of the 98 indicators developed by the domain experts.
The second dataset is at the provincial level, which aims to capture any feature with even a minor correlation to MVL on the correct geographical aggregation level, ensuring at least three data points per province per feature from about 10 distinct open-source providers, culminating in a collection of 102 distinct features. The provincial dataset sources used for the temporal projection and spatial harmonization included The Whole of Afghanistan Assessment, The World Food Program, Humanitarian Data Exchange, and The United Nations Office on Drugs and Crime.
To Address varying missing data rates within the 98 and 102 features, the Multiple Imputation by Chained Equations (MICE) method, which is known for its adaptability to different data types and patterns of missingness, was used (Shadbahr et al., Reference Shadbahr, Roberts and Stanczuk2023; Deng et al., Reference Deng and Chang2016). By implementing MICE with a maximum of 200 iterations and a median initial strategy, the aim was to preserve the original data distribution and accurately mirror the underlying statistical relationships.
Step II: Conceptual framework for MVI by UNDP SMEs
The UNDP SMEs were instrumental to conduct a comprehensive domain analysis. This step aimed to identify factors, indicators and indications for the four PCs, economic financial, environmental, and essential services vulnerabilities. The factors and indicators associated with the PCs are aligned with the UNDP’s Area-Based Approach for Development Emergency Initiatives program, which strives to ensure the sustainability of essential services and address the basic human needs of the people of Afghanistan. Its overarching objective is to empower both women and men to earn a livelihood with dignity, while avoiding displacement (UNDP, 2024). Steps I and II were conducted like a feedback loop as several back and forth discussions took place with the SMEs to match the datasets with the framework and to ascertain the interconnections among the PCs and their relation to the target value. The goal was to drill down deeper by identifying and developing specific indicators for each PC while exploring their dependencies and relationships. The collaborative “domain analysis” yielded a comprehensive set of 12 factors, 49 indicators, and 146 indications pertaining to the four primary PCs.
Step III: PC-indicator relevance matrix
To structure the data for analysis, in line with the framework developed by the UNDP’s domain experts, we redistributed the columns of the national dataset across four datasets, each corresponding to a PC. This involved creating a PC-indicator Relevance Matrix (R), where
 $ {R}_{ij} $
represents the relevance of the ith indicator to the jth PC, with values of 0 or 1 indicating non-relevance or relevance, respectively.
$ {R}_{ij} $
represents the relevance of the ith indicator to the jth PC, with values of 0 or 1 indicating non-relevance or relevance, respectively.
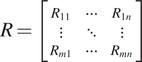 $$ R=\left[\begin{array}{ccc}{R}_{11}& \cdots & {R}_{1n}\\ {}\vdots & \ddots & \vdots \\ {}{R}_{m1}& \cdots & {R}_{mn}\end{array}\right] $$
For data reduction, columns that remained constant over the years, providing no informative variance, were dropped. This refined the dataset to ensure that only the variables contributing meaningful information to the models were retained, streamlining the feature set for subsequent PC analysis.
The qualitative analysis conducted in Steps II and III established the causal relationships between the four PCs and their respective factors, indicators, and indications. Through the process of feature engineering, the developed indications, totaling 146, would be carefully selected and extracted, transforming them into features that would serve as input for the ML model.
Step IV: Predictive feature heatmap for PC indicators
Spatial data harmonization was a crucial process in this project, facilitating the creation of a national-level dataset from more granular subnational data to equalize the aggregational level of the two datasets. This involved aggregating data from provinces or districts to generate a cohesive dataset that reflected national trends. Aggregation was performed using weighted averages based on the population density of each region, capturing the overarching characteristics and trends crucial for initial national-level predictions.
Feature selection using RFE was the next step to align and evaluate features at the national level against the indicators and PCs for predicting the MVL. We employ RFE, a method recognized for effectively identifying and eliminating the least significant features iteratively. The RFE process is conducted as follows:
-
1. ML model selection: Select an appropriate model or algorithm based on the specific analytical needs of the project.
-
2. Model training: Train the model using all available features to assess their initial significance and contribution to prediction accuracy.
-
3. Feature ranking: After training, evaluate each feature’s importance, which is typically determined by model coefficients in linear models or feature importance metrics in tree-based models.
-
4. Feature elimination: Remove the least important features iteratively, refining the feature set to retain only those with the highest relevance and predictive power.
-
5. Repeat: Continuously cycle through Steps 2–4 until a predefined stopping condition is met. In this case, the stopping condition was set at 10. This iterative reduction is not only pivotal for enhancing model interpretability but also crucial for improving performance, particularly in high-dimensional datasets where irrelevant features could detract from model accuracy.
RFE is applied using a diverse array of six ML models to ensure robustness and accuracy, given the critical role of accurate feature selection in predicting PCs and the MVL. These models include:
-
• Linear regression
-
• Ridge regression
-
• Lasso regression
-
• Random forest
-
• Support vector regression (SVR)
-
• Gradient boosting
This varied suite of models addresses different aspects of the prediction task, catering to linear relationships and complex nonlinear patterns alike, thereby broadening the analytical scope and enhancing the prediction reliability.
RFE heatmap analysis is visually represented through heatmaps for each PC, as shown in Figure 6. These heatmaps display the relationships between features and indicators within each vulnerability domain, using varying shades of red to denote the frequency of feature selection by the models—darker shades signify higher selection frequency. This visual tool helps in quickly identifying and including the features most predictive of the MVL.
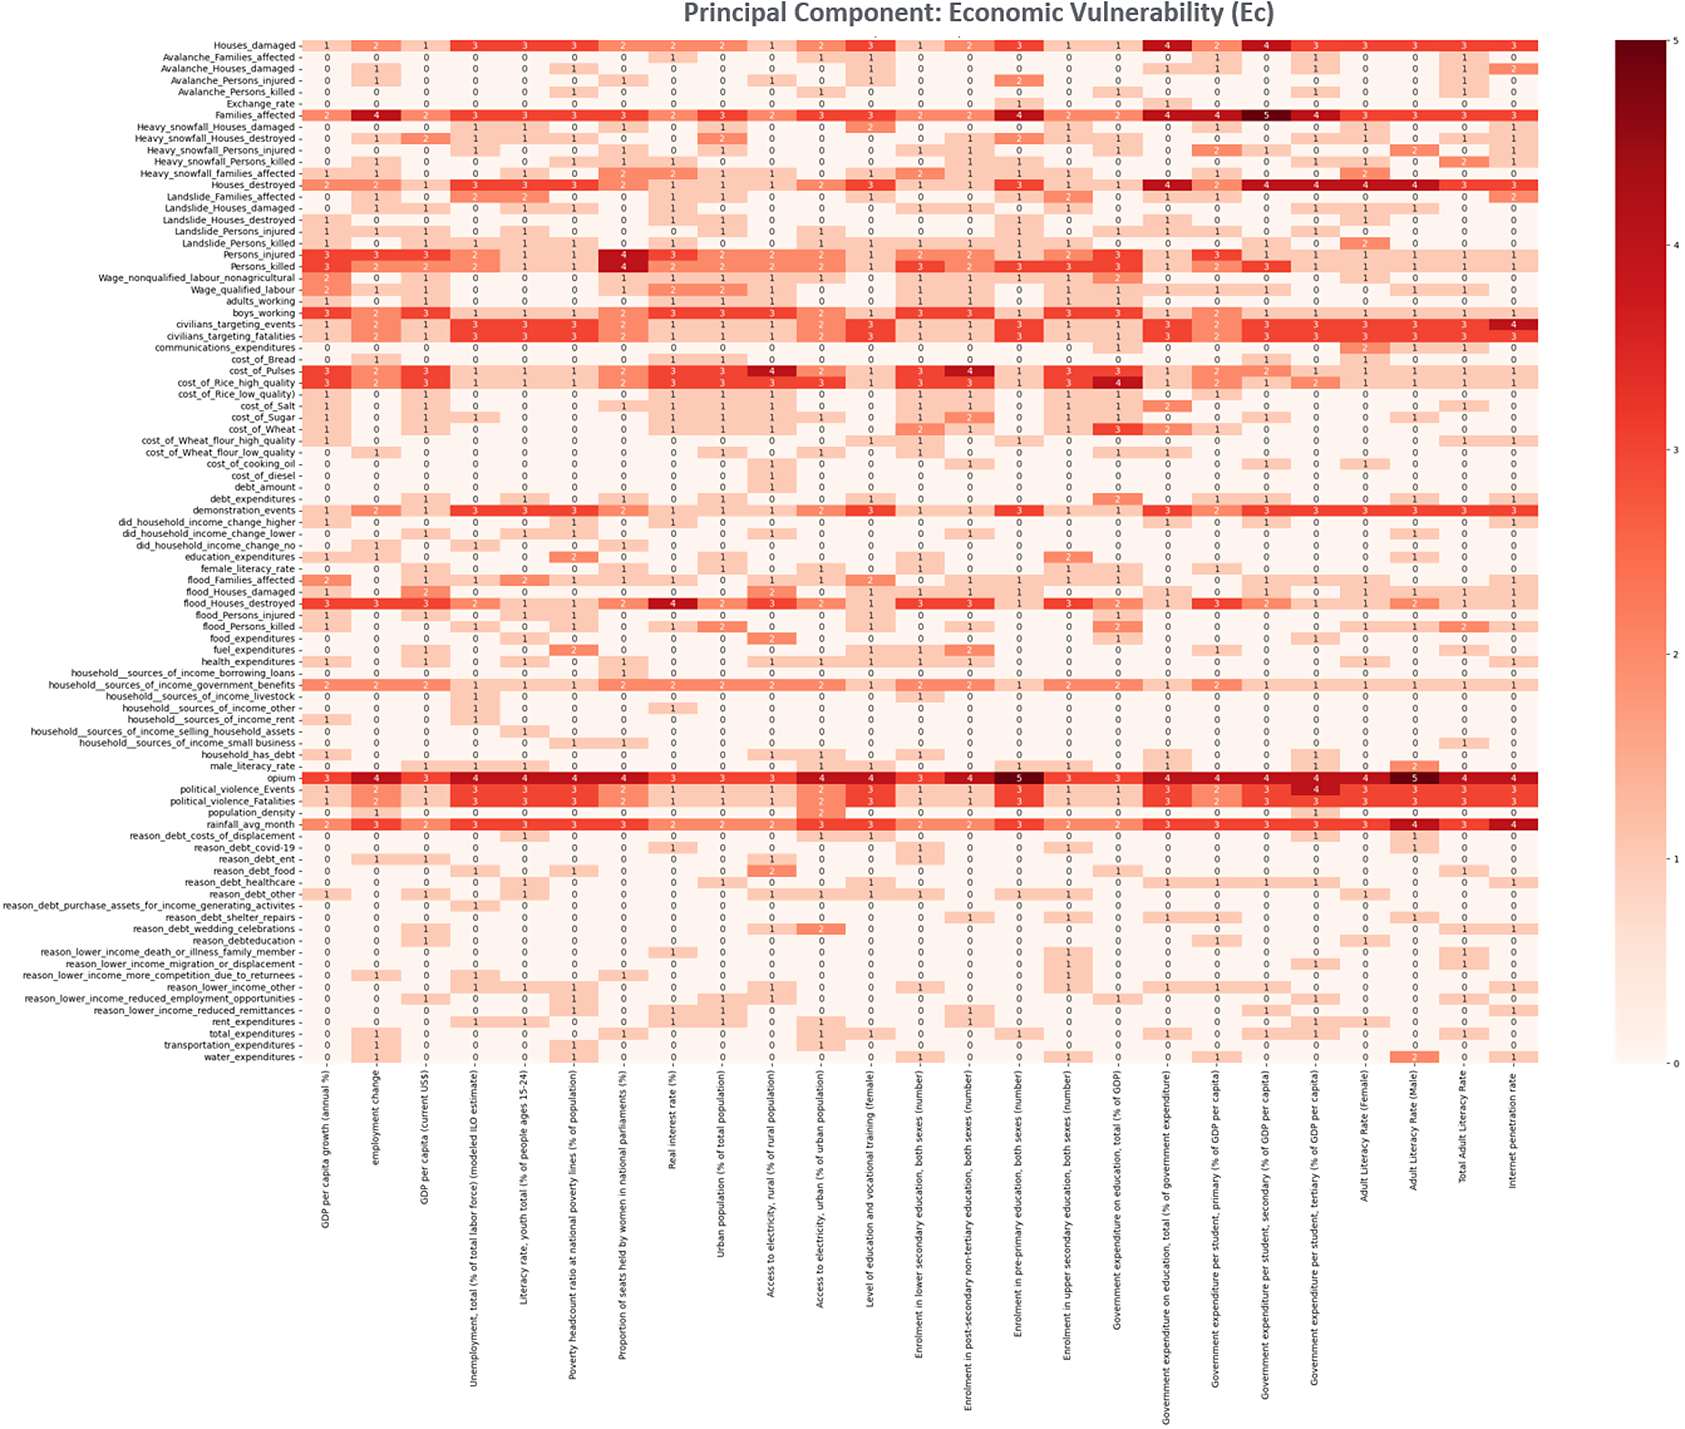
Figure 6. Recursive feature elimination heatmap for economic vulnerability principal component. The X-axis represents the indicators for this principal component, while the Y-axis denotes the features. In the heatmap, features not selected by any of the six models during the Recursive Feature Elimination Process are marked as “0” and displayed in light red. Features unanimously chosen by all six models are assigned the value “6” and are depicted in the darkest shade of red.
During the feature selection process, features deemed predictive by at least one model for a relevant indicator are retained for further modeling as they fit in the selection criteria. Conversely, features not selected by any model are excluded, ensuring that the modeling phase utilizes only the most informative and predictive features. This rigorous selection strategy enhances the overall efficiency and accuracy of subsequent modeling efforts, crucial for achieving reliable predictions of the MVL.
Steps V and VI: Spatial data harmonization and temporal projection
During the spatial data harmonization and temporal projection phase, ML is utilized to forecast future values (temporal) of indicators based on the features refined through the feature selection process. This is crucial for bridging the discrepancy between data aggregated at different geographical levels, which are provincial versus national (spatial). This method hinges on the model’s ability to discern and leverage temporal patterns, enabling predictions 1 year in advance while being agnostic to the level of aggregation. In other words, if the input was provincial, the output was provincial as well.
Temporal projection technique uses historical data trends to forecast future indicator values. By aligning feature datasets to national-level granularity, outcomes for subsequent years can be effectively predicted using time-series analysis. For example, using data from 2022, indicators for 2023 were predicted during this research. This method hinges on the model’s ability to discern and leverage temporal patterns, enabling predictions 1 year in advance.
Indicator forecasting involves several key steps:
1. Standardization: Each feature is standardized using a standard scaler, ensuring uniformity across different measurements. The transformation is defined as:
 $$ z=\frac{\left(\mathrm{x}-\unicode{x03BC}\;\right)}{\unicode{x03C3}\;} $$
Where:
-
•
 $ z $
is the standardized value.
$ z $
is the standardized value. -
•
$ x $
is the original value of the feature. -
• μ is the mean of the feature values.
-
• σ is the standard deviation of the feature values.


2. Model selection and training: We employ various ML models, including:
-
• Linear regression
-
• Ridge regression
-
• Lasso regression
-
• Random forest
-
• Support vector regression (SVR)
-
• Gradient boosting
These models are selected and tuned using an extensive grid search to optimize hyperparameters for each specific indicator-feature combination.
3. Evaluation: Each model is evaluated using leave-one-out cross-validation, focusing on minimizing the mean squared error (MSE). The model with the lowest MSE for a given indicator is then chosen for future forecasting. The MSE calculation is as follows:
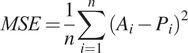 $$ MSE=\frac{1}{n}\sum \limits_{i=1}^n{\left({A}_i-{P}_i\right)}^2 $$
Where:
-
•
$ n $
is the number of observations of which predictions are made (years) -
•
$ {A}_i $
is the actual value for ith observation -
•
$ {P}_i $
is the actual predicted value for ith observation


Application and adaptation to spatial scales: While the models are initially calibrated using data aggregated at the national level, they are capable of adjusting to the provincial level, accommodating the spatial resolution shift. This adaptability is crucial for ensuring that the forecasts are applicable at the level where policy implementation or interventions may occur. The transition from national to provincial forecasting while maintaining a 1-year projection horizon underscores the model’s flexibility and responsiveness to the data’s inherent temporal patterns.
Temporal projection and indicator forecasting phase is vital for predictive analysis, as it not only anticipates future states based on past trends but also adjusts to the varying granularity of data inputs. This flexibility enhances the relevance and utility of the forecasts, making them indispensable tools for decision-makers addressing regional vulnerabilities and planning interventions.
For indicator forecasting, the suite of ML models where applied to develop 98 models for provincial-level forecasting with a 1-year temporal horizon, as depicted in Figure 7.
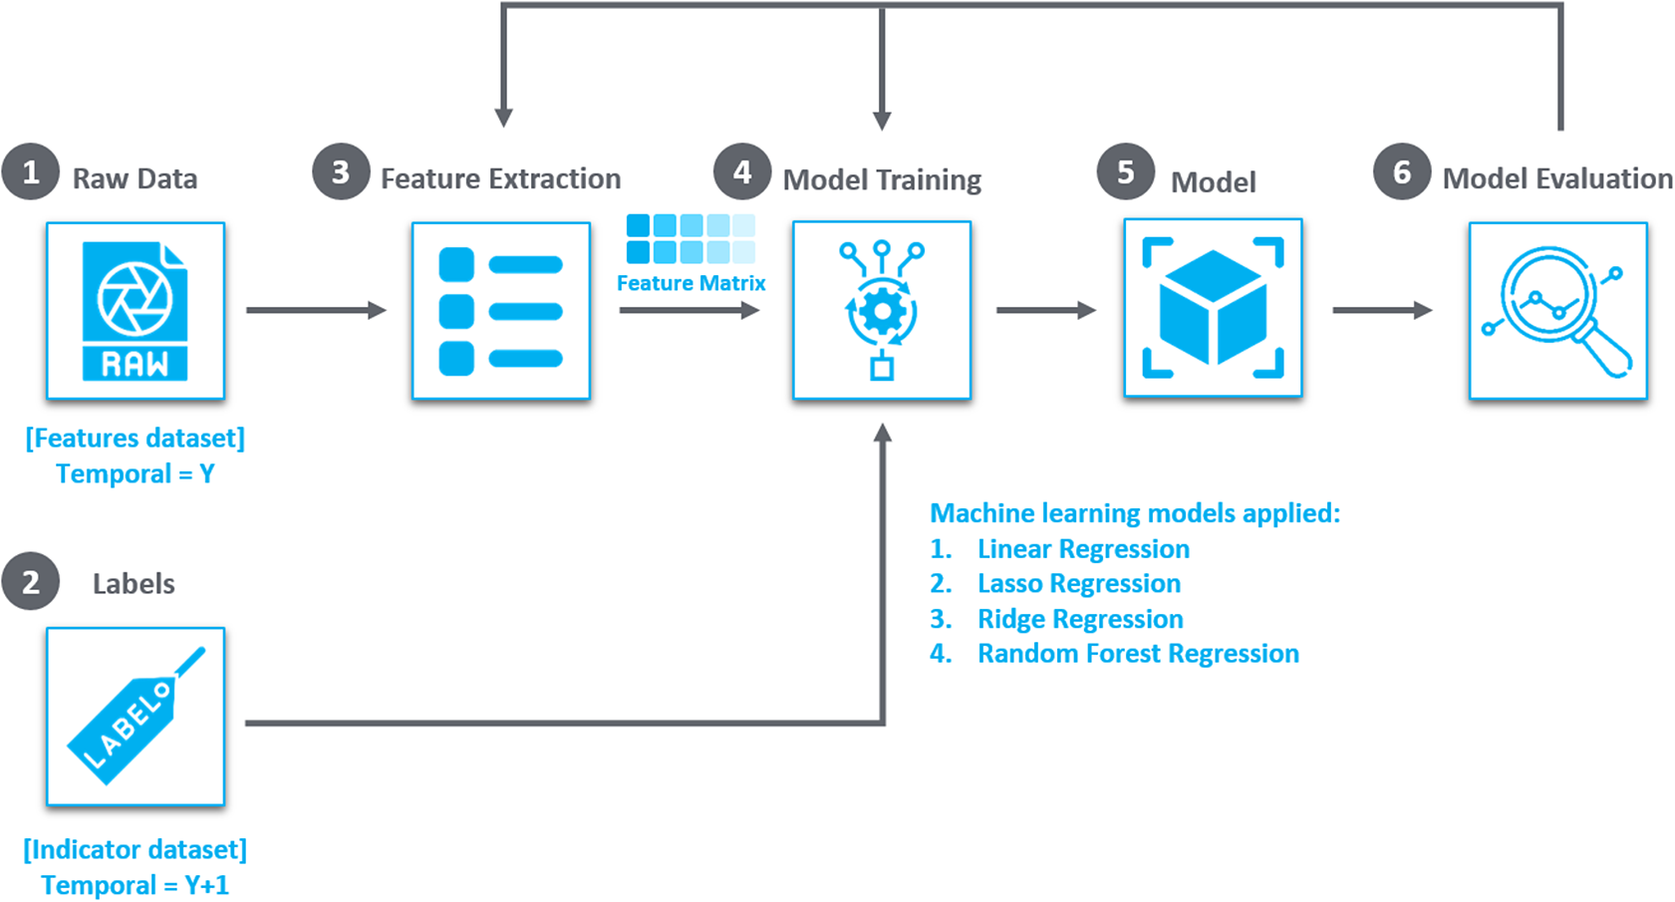
Figure 7. Machine learning models utilized in temporal projection and indicator forecasting: A total of 98 trained models, one for each indicator. This methodology, which integrates spatial harmonization and temporal projection offers a comprehensive yet concise approach to understanding and prioritizing vulnerabilities.
Step VII: PC-indicator score generation
Factor loadings and CFA: The generation of scores for the PCs after forecasting indicators involves calculating factor loadings for each indicator associated with a PC. This process is achieved through CFA, a statistical method used for validating the hypothesized relationships within the data. CFA precisely correlates the observed variables with the latent constructs, confirming the structure posited for the PCs.
Factor loadings quantify the contribution of each indicator to its respective PC, ranging from −1.0 to +1.0. These values indicate the strength and direction of the relationship. Negative loadings suggest a diminishing effect on the PC, whereas positive loadings imply an enhancing effect. The calculation of factor loadings is as follows:
 $$ W\left(P{C}_j,{I}_i\right)= corr\left({I}_i,P{C}_j\right) $$
Where:
-
•
$ P{C}_j $
represents the jth PC. -
•
$ {I}_i $
represents the ith indicator. -
•
$ W\left(P{C}_j,{I}_i\right) $
signifies the weight factor between the jth PC and the ith indicator,
$ corr\left({I}_i,P{C}_j\right) $
indicating the correlation between the ith indicator and the jth PC.


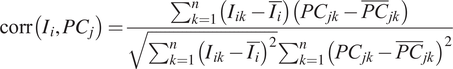 $$ \mathrm{corr}\left({I}_i,P{C}_j\right)=\frac{\sum_{k=1}^n\left({I}_{ik}-\overline{I_i}\right)\left({PC}_{jk}-{\overline{PC}}_{jk}\right)}{\sqrt{\sum_{k=1}^n{\left({I}_{ik}-\overline{I_i}\right)}^2}{\sum}_{k=1}^n{\left({PC}_{jk}-{\overline{PC}}_{jk}\right)}^2} $$
Where:
-
•
$ {I}_{ik} $
and
$ {PC}_{jk} $
are the values of the ith indicator and the jth PC for the kth observation, respectively. -
•
$ {I}_i $
and
$ {\overline{PC}}_{jk} $
are the mean values of the ith indicator and the jth PC across all observations. -
•
$ n $
is the total numbers of observations


This statistical representation effectively links each indicator to its respective PC, crucial for the accurate interpretation of PC analysis.
Step VIII: PC dimension reduction and scaling
Following the calculation of weighting factors for each indicator on its respective PC, the dimension reduction methodology simplifies the data to derive the PC values. This process translates a vector of weighting factors into a singular value—the factor score or value of the PC.
The PC value,
 $ P{C}_j $
, is calculated as follows:
$ P{C}_j $
, is calculated as follows:
 $$ P{C}_j=\sum \limits_{i=1}^nW\left(P{C}_j,{I}_i\right){\hat{I}}_i $$
Where:
-
•
$ PC\; is\;\left[ Ec, Fi, En, Es\right] $
or the four PCs -
•
$ W\left(P{C}_j,{I}_i\right) $
is the correlation factor (weight factor) between PC
$ j $
and indicator
$ i $
-
•
$ {\hat{I}}_i $
represents the standardized value for the ith indicator


 $$ {\hat{I}}_i=\frac{I_i-{\overline{I}}_i}{\sigma_i} $$
Where:
-
•
$ {\hat{I}}_i $
signifies the standardized value of the Ith indicator. -
•
$ \overline{I} $
represents the mean of the Ith indicator. -
•
$ {\sigma}_i $
signifies the standard deviation for Ith
$ \mathrm{i} $
ndicator


Each indicator contributes proportionally to the PC score, influenced by its factor loading. Indicators with higher loadings have a more substantial impact, effectively encapsulating the key patterns and trends reflected in the dataset.
Step IX: Scaling and transformation of PC scores
Establishing bounds were critical for defining the range within which the scores were standardized to ensure that extreme values were appropriately adjusted and do not skew the analysis. Consequently, after calculating the PC scores, “lower” and “upper” bounds were established, set at the 5th and 90th percentiles of the dataset, respectively.
A double bounded linear transformation was applied to enhance interpretability and ensure alignment with the MVL categorization. This transformation rescales the scores to a standardized range from 0 to 4, facilitating direct correlation with MVL categorizations and enhancing the intuitive interpretation of the model’s outputs. The transformation is mathematically detailed as follows:
 $$ f(x)=\frac{4}{upper- lower}\min \Big(\max \left( ax+b- lower,0\right), upper- lower $$
Or simplified:
 $$ f(x)=\frac{4}{upper- lower}\min \Big(\max \left( ax- lower,0\right), upper- lower $$
Where:
-
•
$ f(x) $
represents the rescaled factor score. -
•
$ x $
is the original score or value of the PC before rescaling. -
•
$ a $
(scaling coefficient) adjusts the rate at which the original score changes to fit within the new range (0–4). -
•
$ b $
(shifting coefficient) shifts the baseline from which the scores are scaled, aligning with the lower bound. -
•
$ lower $
and
$ upper $
are the predefined bounds, which mitigate the influence of outliers by limiting the range of the transformation.


This comprehensive transformation not only standardizes the range of each PC score but also maintains the relative differences in the original scores. In doing so, it ensures that the scores are both comparable across different PCs and aligned with the overall analysis goals. This methodological approach allows for a detailed assessment of the vulnerability essential for policy formulation and targeted intervention strategies in the field of risk and vulnerability management.
Step X: MVL calculation
Following the rescaling of PC scores, the next critical step involves computing the MVL. This calculation integrates the values of the PCs through a weighted average formula:
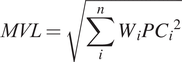 $$ MVL=\sqrt{\sum \limits_i^n{W}_iP{C_i}^2} $$
Where:
-
•
$ PC:\left[ Ec, Fi, En, Es\right] $
denote the four rescaled PC scores -
•
$ {W}_i $
signifies the weight factor for ith PC. -
•
$ n $
is the number of PCs.


Where:
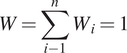 $$ W=\sum \limits_{i-1}^n{W}_i=1 $$
This uniformity was expressed as
 $ {W}_1={W}_2={W}_3={W}_4=0.25 $
, indicating equal contribution from each component toward the MVL.
$ {W}_1={W}_2={W}_3={W}_4=0.25 $
, indicating equal contribution from each component toward the MVL.
This formula allowed for the calculation of the MVL by considering the weighted contributions of each PC to the overall vulnerability assessment. The result was a robust tool for comparative analysis and priority setting among regions.
Categorization of vulnerability levels for each region was established using a piecewise function mapping the continuous range of MVL scores to discrete vulnerability classes, once the MVL scores were obtained.
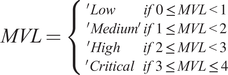 $$ MVL=\left\{\begin{array}{c}^{\prime } Lo{w}^{\prime}\hskip1.08em if\;0\le MVL<1\\ {}^{\prime } Mediu{m}^{\prime}\; if\;1\le MVL<2\\ {}^{\prime } Hig{h}^{\prime}\hskip0.84em if\;2\le MVL<3\\ {}^{\prime } Critica{l}^{\prime}\; if\;3\le MVL\le 4\end{array}\right. $$
This categorization was essential for interpreting the MVL scores as it provided a qualitative understanding of the region’s vulnerability relative to others within the same time frame. These classifications reflected relative, not absolute, levels of vulnerability, allowing for a comprehensive assessment that was critical for policy formulation, resource allocation, and targeted intervention strategies in the field of risk and vulnerability management.
Evaluation and validation
Prediction accuracy in classification tasks in ML quantifies the effectiveness of a model by comparing the number of correct predictions to the total predictions made. Mathematically, this is represented as:
 $$ \mathrm{Prediction}\ \mathrm{Accuracy}=\frac{\mathrm{Number}\ \mathrm{of}\ \mathrm{Correct}\ \mathrm{Prediction}\mathrm{s}}{\mathrm{Total}\ \mathrm{Number}\ \mathrm{of}\ \mathrm{Prediction}\mathrm{s}}\bullet 100\% $$
This metric serves as a crucial indicator of a model’s ability to accurately classify instances into their designated categories, reflecting its overall effectiveness.
Traditional prediction accuracy for regression tasks is not applicable. Instead, the performance is gauged using error metrics that measure the deviation between the model’s predictions and the actual observed values. Common metrics include:
Mean Absolute Error: The average of absolute differences between predicted and actual values.
MSE: The average of the squares of the differences between predicted and actual values.
Root MSE: The square root of MSE, providing a scale-sensitive accuracy measure.
Evaluating the prediction accuracy for PCs and MVL involves using 98 distinct models tailored to specific indicators. This complex assessment requires a nuanced approach, utilizing the Mean Absolute Percentage Error (MAPE) as a key metric:
 $$ \mathrm{MAPE}=\frac{100\%}{n}\sum \limits_{i=1}^n\left|\frac{A_i-{P}_i}{A_i}\right| $$
Where:
-
•
$ n $
is the number of observations (years). -
•
$ {A}_i $
is the actual value for the ith observation. -
•
$ {P}_i $
is the predicted value for the ith observation.


MAPE measures the relative error between the actual and predicted values, expressed as a percentage, offering a clear indication of the model’s predictive precision.
For the accuracy assessment methodology for each indicator, MAPE is assessed against a predetermined threshold. Predictions with a MAPE below this threshold are considered accurate, while those above are deemed inaccurate. The accuracy for each PC is calculated by aggregating these binary accuracy values:
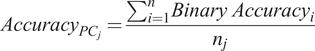 $$ {Accuracy}_{PC_j}=\frac{{\sum \limits}_{i=1}^n{Binary\ Accuracy}_i}{n_j} $$
Where:
-
•
$ {Accuracy}_{PC_j} $
is the accuracy for the
$ j $
th PC. -
•
$ {n}_j $
is the number of indicators within the
$ j $
th PC. -
•
$ {Binary\ Accuracy}_i $
is 1 if the MAPE of the ith indicator is below the cut-off score, otherwise 0.


This approach provides a granular view of the model performance across different PCs, enhancing interpretability and identifying areas for potential refinement. By evaluating each PC’s accuracy against specific thresholds, the methodology facilitates a detailed comparative analysis, ensuring that the predictive models are optimized for accuracy and reliability.
This comprehensive evaluation framework not only tests the model’s predictive capabilities but also highlights the collective impact of all PCs and indicators involved in the analysis. This rigorous assessment ensures that the predictive model for MVL is robust, allowing for targeted interventions and policy decisions based on reliable data-driven insights.
Findings of the use case
The results of the comprehensive analysis of prediction accuracy per PC for the MVL system are as follows: The accuracy measurements were conducted across various cut-off scores: <10%, <20%, <25%, and <30%. These scores represent the threshold of the proportion of indicators that the model must predict accurately. To meet the prediction accuracy benchmarks set by the MVP, the average accuracy across all components must achieve 75% or higher for cut-off scores of 30% or less, and it should reach 70% or higher for cut-off scores of 25% or less. The data presented in Table 1 illustrate the prediction accuracy measurements, indicating that across cut-off scores ranging from <30% to <25%, the accuracy consistently falls within an impressive range from 70% to 80%. These results not only satisfy but also surpass the established prediction accuracy criteria outlined in the MVP framework, marking a significant accomplishment. This achievement is particularly notable considering the scarcity of empirical models and data available in this field.
Table 1. Prediction accuracy scores across principal components at different cut-off levels for multidimensional vulnerability level
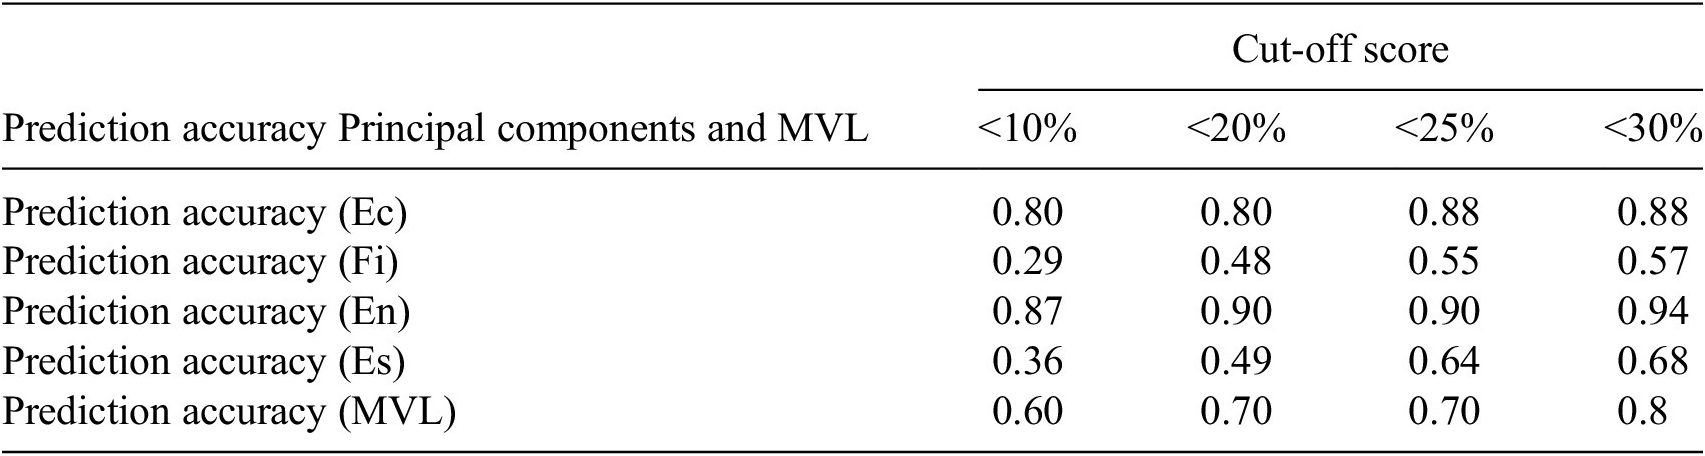
The analysis was conducted through the training of 98 distinct ML models, each tailored to forecast a specific indicator with a 1-year temporal projection. The results indicate an impressive outcome, particularly in terms of the model’s robustness and accuracy. For instance, with a cut-off score of <20%, the overall prediction accuracy for the system remained at a commendable 70%. The level of accuracy, achieved when the model was tasked to forecast 80% of the indicators accurately, highlights the effectiveness of the Temporal Projection and Indicator Forecasting approach. Remarkably, at the more stringent cut-off score of <10% (where the model was expected to accurately forecast 90% of the indicators), the system maintained a substantial prediction accuracy of 60%. The level of performance is noteworthy, especially considering the constraint of data availability spanning only 3 years. It highlights the system’s strength in accurate forecasting capabilities.
A deeper exploration into the results reveals divergent patterns among the PCs. The components representing “Economic vulnerability” and “environmental vulnerability” demonstrated notably high prediction accuracies. For example, at the <10% cut-off score, the prediction accuracy for economic vulnerability stood at an impressive 80%, while environmental vulnerability achieved 87%. This means that even when the model was under the pressure of making accurate predictions, 9 out of 10 times, the forecasts for economic and environmental vulnerabilities were remarkably reliable. That said, the components for financial and essential service vulnerabilities exhibited lower prediction accuracies suggesting several potential areas for further investigation:
Data availability and quality: It is possible that enhanced data collection and improved data quality, especially for the financial and essential services components, could enhance model performance. As data availability increases over time, improvements in these metrics are anticipated. Future efforts should focus on refining the data sources and collection methodologies.
Relevance of chosen features: The current indicators may not fully capture the vulnerabilities they are intended to measure, particularly in the components with lower prediction accuracy. This suggests a potential misalignment between some of the chosen features and the real-world dynamics they aim to represent, warranting a closer examination.
Adequacy of the conceptual framework: The discrepancies in prediction accuracy for the financial and essential services components may indicate potential gaps in the conceptual framework itself. It is possible that the indicators currently used do not comprehensively represent the complexities of these vulnerabilities, or the framework may not fully encompass all relevant aspects.
For the system refinement, future research should address the potential gaps by taking the following actions:
Expanding and enhancing data sources: Actively expand the scope of data collection, especially in underrepresented areas, to provide a more accurate and comprehensive view of all vulnerability components.
Indicator and feature review: Reassessing and potentially redesigning the indicators and features used for modeling to ensure they accurately reflect the vulnerabilities. Integrating feedback from field experts and stakeholders could help realign the model more closely with ground realities.
Refining the conceptual framework: Considering revision of the conceptual framework to better encapsulate the complexities of financial and essential service vulnerabilities. Incorporating additional dimensions or indicators that capture emergent trends and patterns more effectively could be beneficial.
By advancing these areas, future iterations of the MVL system can achieve enhanced accuracy and reliability, making it a more effective tool for policymaking and strategic planning in vulnerability management. These efforts will not only refine the predictive capabilities of the system but also ensure that it remains adaptable to changing data landscapes and evolving vulnerability contexts.
The paradigm shift: Enhancing policy decisions through augmented intelligence for sustainable development and resilience
The convergence of multidimensional vulnerabilities with exponential technological advancements demands a fundamental reevaluation of how the UN institutions operate (Pratt et al., Reference Pratt, Bisson and Warin2023). Embracing augmented intelligence surpasses traditional methods, mere analytics augmentation and unlocking a new realm in shaping impactful policy decisions. Augmented intelligence acknowledges the intricate interplay of multifaceted vulnerabilities, empowering policymakers with effectiveness. Its application in predicting multidimensional vulnerabilities in Afghanistan or elsewhere signifies a paradigm shift. In pursuit of the transformative vision, the development of an augmented intelligence-driven EPD platform holds the potential to revolutionize the operational landscape of UN institutions.
The EPD platform, as shown in Figure 8, strengthens the UN’s EW Systems by providing a robust analytical framework. Early detection of potential crises enables the UN to mobilize resources and respond more effectively, potentially averting or mitigating the impact of disasters.
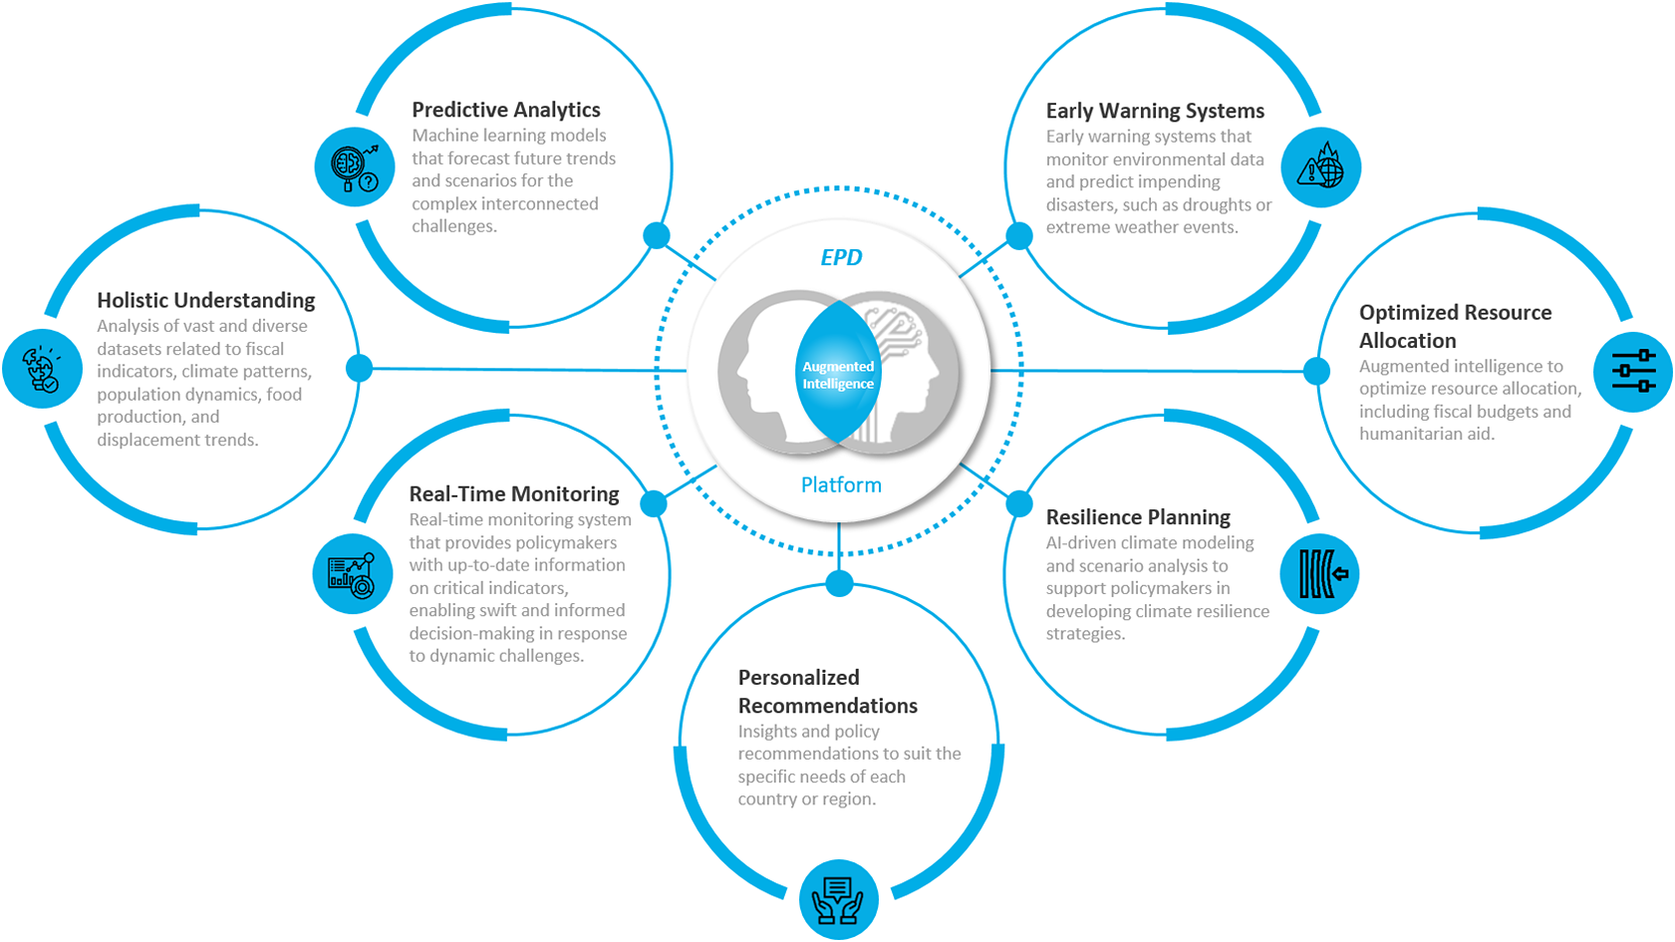
Figure 8. Empowering policy decisions: the visual story of the EPD platform in action.
The EPD platform is supported by an integrated analysis cell comprising SMEs and data scientists. This collaborative environment enables thorough the analysis and interpretation of the data, leveraging the expertise of both groups. SMEs use the verified information to conduct assessments, employing structured analytical tools to derive meaningful insights. Their domain knowledge ensures that the data are contextualized and interpreted accurately, which is essential for making informed decisions. Data scientists ensure the integrity and quality of the datasets collected from various technology platforms. They are responsible for curating and preprocessing data to train augmented intelligence-driven models, which are used for forecasting future trends and scenarios. This predictive capability is crucial for proactive planning and early interventions, helping to mitigate the impact of emerging crises.
The EPD platform serves as a centralized repository, aggregating real-time data from diverse sources. By consolidating various datasets, it offers a comprehensive view of the countries or regions where UN institutions and field missions operate. The integration of diverse datasets allows for a multifaceted analysis of the situation. For example, understanding the interplay between climate patterns and conflict dynamics can provide deeper insights into potential drivers of instability, while real-time monitoring enables UN institutions to track developments as they occur, facilitating timely interventions and responses.
The platform provides decision-maker and policymaker with actionable insights. It also helps them make more informed and timely decisions based on the data-driven policy recommendations they receive, enhancing the effectiveness of UN interventions by supporting proactive resilience planning, effective resource allocation, and effective responses to emerging crises. It also fosters collaboration among different UN entities and external partners by providing a shared space, which enhances coordination and ensures that all stakeholders have access to the same information and insights to optimize resource allocation such as humanitarian aid and resilience planning against climate and poverty, ultimately strengthening the UN’s mission to promote peace, security, and development.
Conclusion
Augmented intelligence-driven prediction models present a groundbreaking approach to tackle a myriad of interconnected and complex challenges that traditional AI and ML models often find difficult to address. Unlike conventional methods, augmented intelligence seamlessly integrates human expertise with machine capabilities, thereby augmenting the predictive power and adaptability of these models. By fusing human intelligence with ML algorithms, augmented intelligence facilitates a deeper understanding of intricate issues, leading to more precise predictions and well-informed decision-making processes. This synergy between human and machine intelligence ultimately enables a more holistic approach to problem-solving and prediction.
In the context of the mission of the UN institutions to achieve the SDGs, augmented intelligence offers promising opportunities for progress, especially in regions impacted by conflict and instability. By harnessing the capabilities of augmented intelligence, the UN can adeptly navigate the intricacies of such environments, discern emerging trends and risks, and customize interventions to precisely address the needs of vulnerable populations. This innovative approach empowers the UN to enhance the efficiency of its efforts, maximize their impact, and ultimately foster positive change even in the most challenging contexts.
The UNDP–UNAMA experiment to predict MVL across Afghanistan has yielded impressive outcomes. The accuracy of MVL prediction ranged between 70% and 80%, surpassing the specified MVP criterion of 70%–75%. Furthermore, the forecasting of MVL was remarkably early, offering insights a year ahead of schedule, thereby exceeding UNDP’s 3-week “earliness” requirement.
Furthermore, the MVL maps, as depicted in Figure 9, not only portray current vulnerability levels but also provide forecasts for 2024, marking the first instance where a baseline covering most of the SDGs has been established for Afghanistan. These maps offer valuable insights that can inform program development, serving as a framework to evaluate the impact of ongoing UNDP initiatives in mitigating vulnerabilities and poverty.
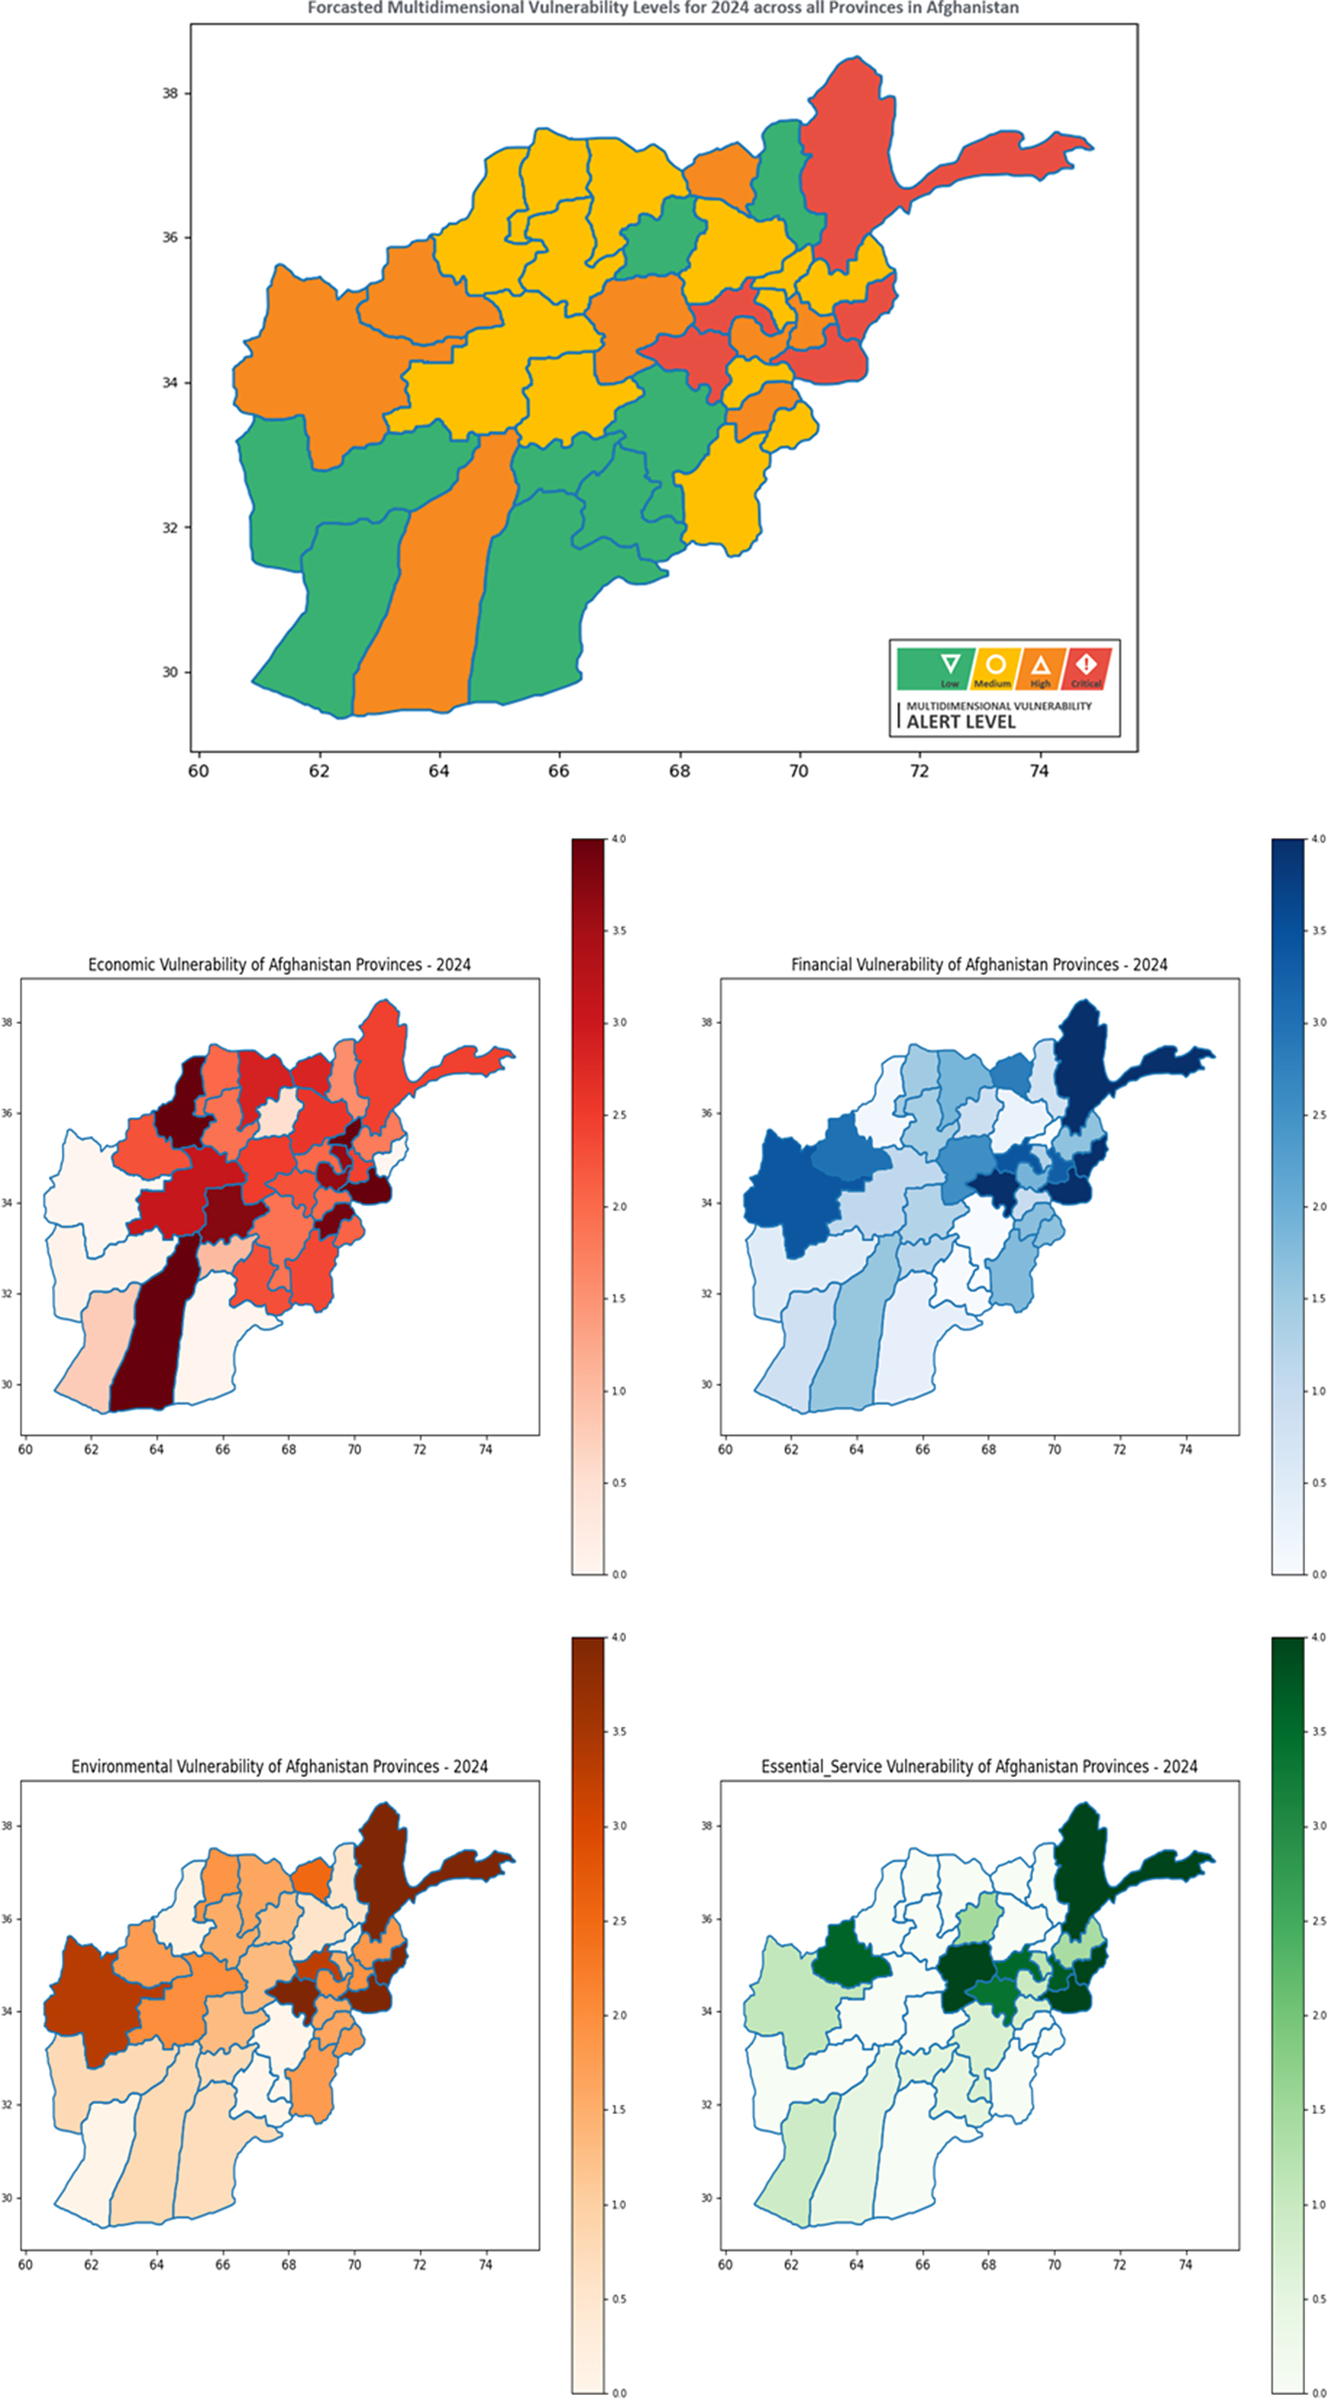
Figure 9. Visualization of forecasted multidimensional vulnerability levels (MVLs) for 2024 across provinces in Afghanistan, including vulnerability levels for forecasted economic, financial, environmental, and essential service vulnerabilities.
Furthermore, the maps prioritize relative vulnerability metrics over absolute values, allowing for more nuanced comparisons among provinces and facilitating more effective interventions. This approach avoids the limitations of absolute vulnerability models, which may inaccurately label certain regions as consistently vulnerable, thus complicating intervention prioritization.
In conclusion, the UNDP–UNAMA pilot project achieved the three objectives, which were identified at the inception of the experiment:
-
1) Strengthening data-driven practices: The project prioritized data-centric approaches, employing comprehensive datasets to forecast PCs and the MVL, emphasizing meticulous data collection, preprocessing, and diverse data source utilization. Integration of data into the model improved the decision-making efficiency, reinforcing the project’s data-driven practices.
-
2) Piloting human–machine teaming to improve EW processes: The augmented intelligence method showcased the synergy between human expertise and machine capabilities by complementing human judgment with machine-generated forecasts, creating an augmented intelligence system. Demonstrating improved EW processes through the collaboration of human expertise and machine-generated predictions, highlighting the potential of human–machine teaming to enhance UN EW mechanisms’ efficiency and effectiveness.
-
3) Creating Best Practices Applying ML in UN EW Mechanisms: Leveraging UNDP Subject Matter Expertise knowledge, Temporal Projection and Indicator Forecasting, and various ML algorithms, the developed model forecasts the MVL, establishing a robust predictive framework. Furthermore, by utilizing historical data, the model enhances the accuracy and reliability of the EW mechanisms, adhering to the best practices in ML for predictive accuracy through iterative training and validation.
Continued experimentation is crucial to improving the system’s predictive capabilities, refining both the models and the conceptual framework of MVL. This ongoing effort ensures that the forecasts for multidimensional vulnerabilities remain robust and accurate, serving as a crucial tool in guiding policy decisions and interventions.
Moving forward, the identified shortcomings within the Financial and Essential Service vulnerability components will be prioritized for comprehensive coverage and precision in the predictive analytics of the use case.
Augmented intelligence is positioned to revolutionize the UN’s approach to addressing complex challenges in the 21st century. Platforms, such as the EPD platform provide vital tools for navigating the complexities of sustainable development and resilience, empowering decision-makers with data-driven insights. Furthermore, the EPD platform ensures that human control remains central to the decision-making process in line with the UN’s core values of transparency and ethical use of AI. Through close collaboration, the UN family can collectively strive for equitable, sustainable, and resilient development for all, harnessing the transformative potential of augmented intelligence.
Data availability
The data that support the findings of this study are available from open sources on the web including World Bank, UNDP, Humanitarian Data exchange, REACH (Impact).
Acknowledgments
The authors would like to extend their heartfelt gratitude to Assistant Secretary-General Abdallah Al Dardari for his pivotal role in spearheading the pilot project. Special appreciation goes to Renata Rubian, Thematic Lead for Inclusive Growth at UNDP and UNDP Afghanistan team, with particular acknowledgment of the project manager, Fahim Maqsodi as well as the Technical Advisory Group, led by Sebnem Sahin, UNDP Economic Modeler for their invaluable support and expertise. The authors would like to thank Mohamed Maouli, the lead designer of the use case, for his dedication and expertise.
Author contribution
Data curation: T.W.; Formal analysis: T.W.; Methodology: T.W., D.A.; Software: T.W.; Visualization: T.W.; Writing – original draft: T.W., D.A.; Conceptualization: D.A.; Funding acquisition: D.A.; Project administration: D.A.; Resources: D.A.; Writing – review & editing: D.A.
Funding statement
This work was funded by the United Nations Development Program (UNDP). UNAMA approved the publishing of the results.
Competing interest
Author Damla Aras, PhD and Author Timothy Westlake declare none.


 Open access
Comments
No Comments have been published for this article.