Introduction
Non-typhoidal salmonellae (NTS) are a leading cause of enteric illness in the USA, resulting in an estimated 1 027 561 illnesses, 19 336 hospitalisations and 378 deaths each year [Reference Scallan1]. Furthermore, NTS are one of the most important aetiologies of foodborne outbreaks in the USA [2]. The incubation period for NTS infections is reported as 6–72 h and usually 12–36 h [Reference Barton Behravesh, Griffin and Heymann3, Reference Kimberlin4]. These incubation ranges are repeated in countless references and influence the time period considered when assessing exposures during NTS outbreak investigations and sporadic case interviews.
Incubation periods for foodborne NTS infections are challenging to determine. Most infections are not associated with identified outbreaks [5] and so the source of illness and time of exposure are not known. Even if the source is correctly identified, the median number of days from the onset of symptoms to when a case is interviewed by public health investigators is 14 days [Reference Hedberg6]. This elapsed time limits the ability of many ill people to recall exact details about illness onset and possible exposures. Additionally, many ill people have had multiple exposures to the outbreak vehicle, or are possibly secondary infections to ill household contacts. Furthermore, onset and exposure information is often collected as a date without a time. This means that the range of possible incubations in hours for an exposure on 1 January and illness onset on 2 January could theoretically be between 0 and 48 h. For these reasons, few published papers documenting outbreaks include incubation periods calculated in hours, if at all.
The commonly reported standard NTS incubation range of 6–72 h is largely based on feeding studies performed in the 1950s [Reference McCullough and Eisele7]. However, NTS incubation periods have been shown to be related to ingested dose, with lower doses resulting in longer incubations [Reference Mintz8–Reference Abe10]. There have been numerous foodborne NTS outbreaks with documented median incubations much longer than 72 h. For example, median incubations of 7–8 days have been reported in outbreaks associated with school lunch programmes and raw milk consumption on a dairy farm tour [Reference Abe10–Reference Matsui12]. Additionally, some restaurant outbreaks, possibly due to environmental contamination or asymptomatic food workers (which could result in lower dose exposures), have been shown to have median incubation periods up to 10 days [Reference Ethelberg13, Reference Medus14]. The incubation period may also be influenced by host factors including age and previous immunity and pathogen-specific factors including serotype and virulence [Reference Seals15, Reference Jones16].
Due to the discrepancy between NTS incubations listed in reference materials and those reported in published outbreaks, we sought to provide more comprehensive and systematic data on NTS incubations observed in foodborne NTS outbreaks in Minnesota. To accomplish this, we summarised data from 16 years of foodborne NTS outbreaks in Minnesota.
Methods
Minnesota Department of Health (MDH) outbreak investigation records and summary reports for all confirmed foodborne NTS outbreaks identified in Minnesota from 1 January 2000 to 31 December 2015 were reviewed for demographic and illness information for all outbreak-associated cases. Variables collected included age, gender, hospitalisation, case status (culture-confirmed or probable), specimen source (if culture-confirmed), serotype, outbreak vehicle, outbreak setting, onset date and time of first symptom, onset date and time of first objective symptom (diarrhoea, vomiting, or fever), exposure type (e.g. single exposure or multiple exposures), exposure date and time and whether or not the case was a primary case. Culture-confirmed cases were defined as individuals who had a stool culture test positive for the outbreak strain of NTS either at a clinical laboratory, or the MDH Public Health Laboratory (culture-confirmed case). Probable cases were defined as individuals with gastrointestinal illness who were epidemiologically linked to an outbreak but did not have a stool culture that was positive for the outbreak strain of NTS (probable case). Outbreak records were reviewed to determine if probable cases met a more stringent clinical case definition of diarrhoea ⩾3 days in duration or accompanied by fever. Culture-confirmed and probable cases were considered primary if no household members with gastrointestinal illness were reported ⩾24 h before the case's onset of symptoms (primary case).
Only primary cases with a single exposure and illness onset data were included in incubation period analyses. Incubations were precisely calculated for cases for which exact hour of exposure and onset of illness were available (known incubation period). Cases were divided into culture-confirmed cases and probable cases. Two incubations were calculated: from exposure to onset of first reported symptom; and, from exposure to onset of first objective symptom (i.e. diarrhoea, fever, vomiting).
Outbreak vehicles were grouped by implicated or suspected commodity. For example, all eggs and egg-containing dishes were grouped together. Prepared foods were defined as combination dishes that were prepared at the point of service and a specific ingredient was not implicated (e.g. macaroni salad served at a potluck).
Foodborne outbreaks were classified into one of two categories based on the setting of exposure: restaurant/event and commercial product. Restaurant/event outbreaks were defined by transmission occurring at a single food service establishment, restaurant chain, single catered event, or a private party. Outbreaks were defined as commercial product-associated if the vehicle was distributed to multiple food service establishments (not belonging to the same restaurant chain) and/or prepared in multiple private homes after purchase from a grocery store or other retailer.
Data were summarised and analysed with SAS version 9.3 (SAS Institute, Cary, NC). Separate analyses were performed with all cases and with only culture-confirmed cases. Median incubations were used instead of means because they were a better measure of central tendency for the data. The Mann–Whitney test and Kruskal–Wallis test were used to compare median incubation values as appropriate. Median incubations were compared by culture status, age, gender, hospitalisation, specimen source, serotype, vehicle class and outbreak setting. Incubation data were also summarised at the outbreak-level. The data were fit to a Gamma distribution to estimate the expected median incubation values and 95% confidence intervals (CI).
Results
From 2000 to 2015, 1517 culture-confirmed (n = 1048) and probable (n = 469) NTS cases were identified as part of 119 foodborne NTS outbreaks occurring in Minnesota. The median number of cases per outbreak was 7 (range, 1–121 cases; interquartile range (IQR), 4–15 cases). Illness onset date and time, and a single exposure date and time were available for 766 (50%) outbreak cases. After excluding possible secondary cases, 725 (48%) cases with known incubations remained; 425 (59%) of these cases were culture-confirmed (Fig. 1).
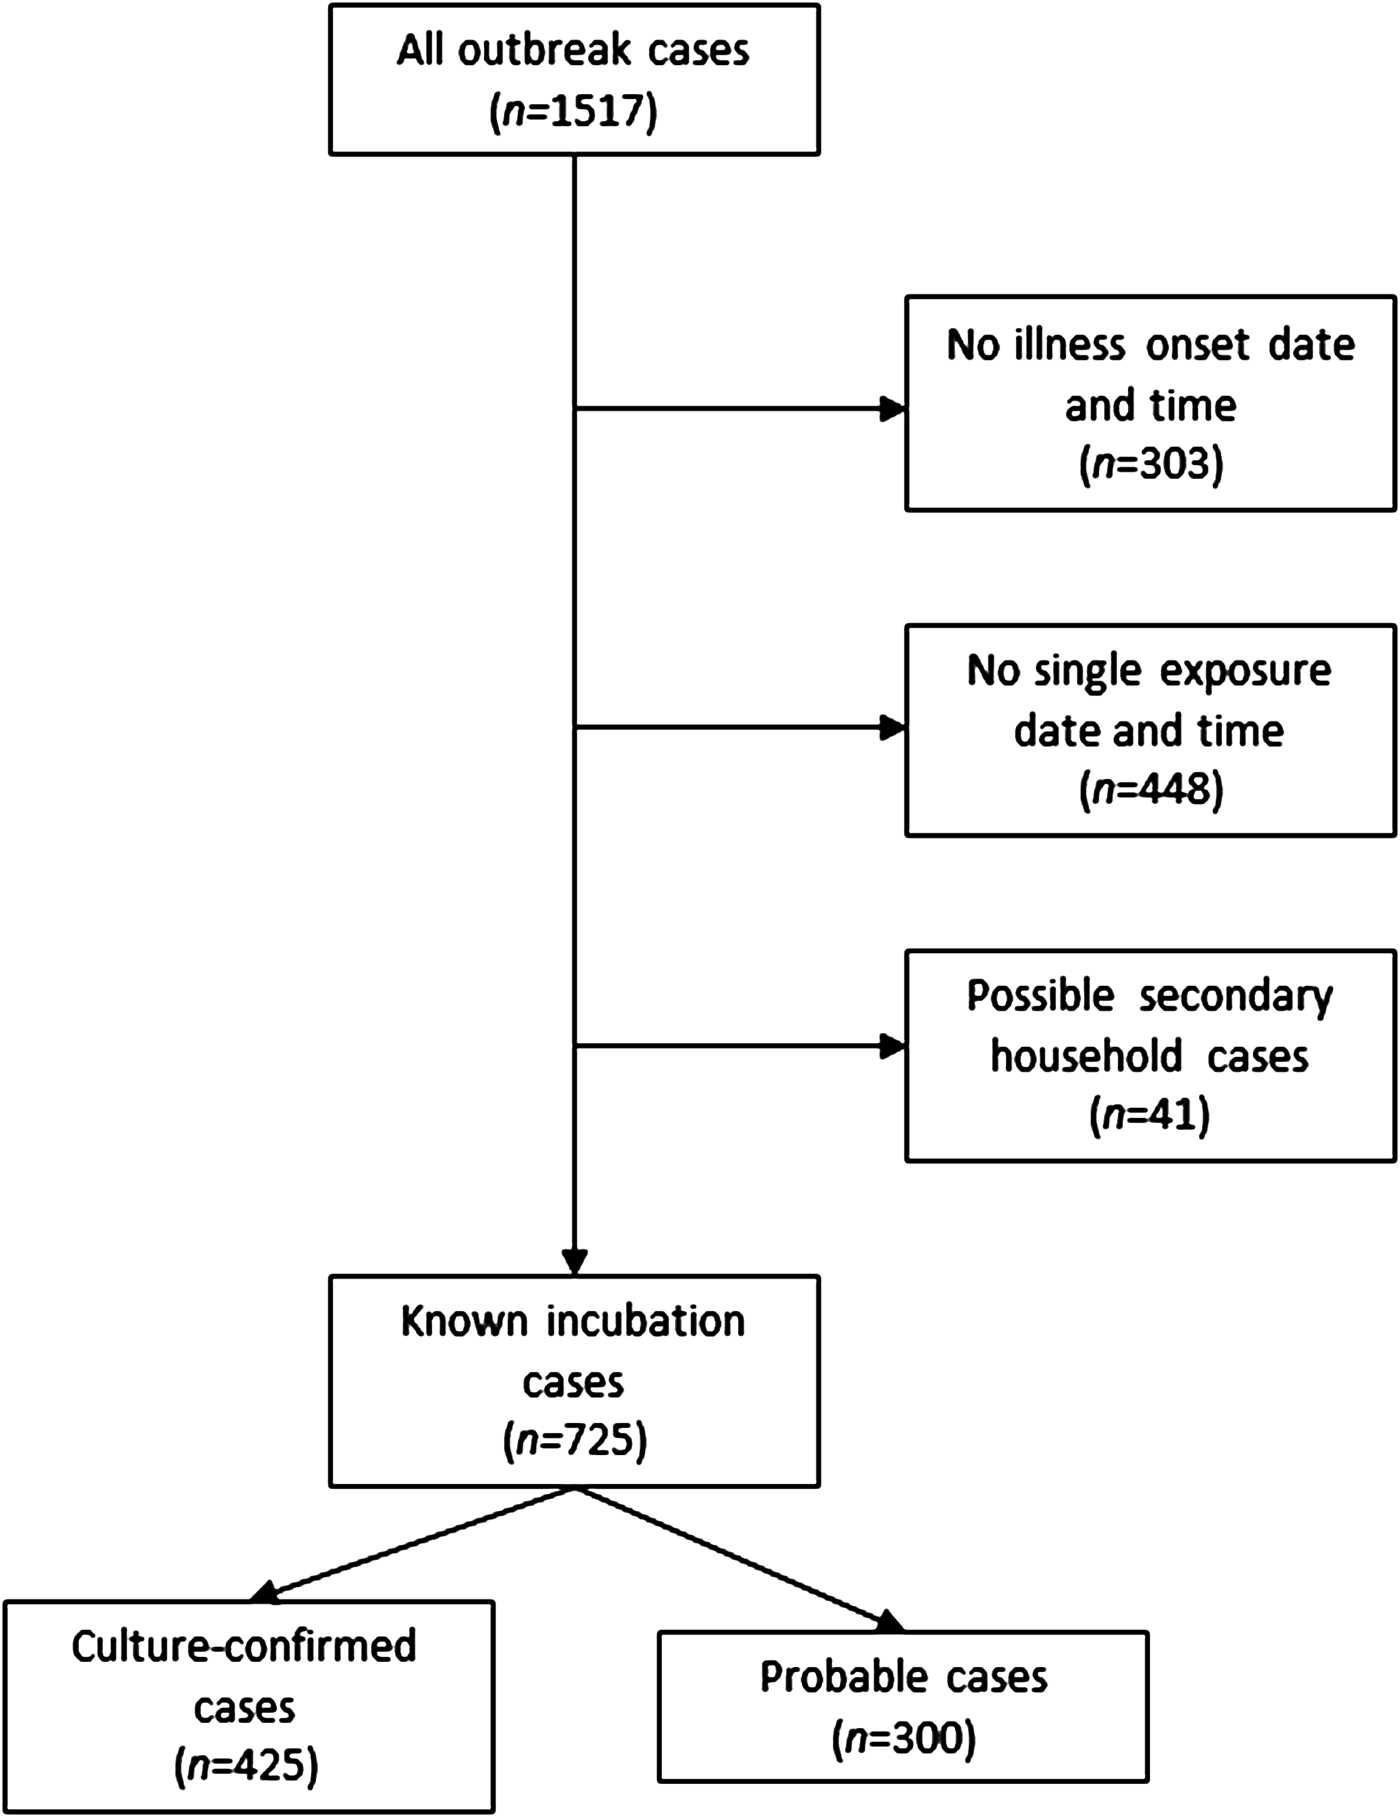
Fig. 1. Flow diagram for enrollment of salmonellosis outbreak cases, Minnesota, 2000–2015.
For the 725 cases with known incubation periods, the median incubation period from exposure to onset of first symptom was 45 h and to onset of an objective symptom was 49 h (Table 1). The majority of cases (491 (68%)) had incubation periods within the commonly referenced range of 6–72 h and 249 (34%) cases had incubations 12–36 h (Fig. 2). Sixty-five (9%) cases had incubations <12 h and 23 (3%) cases had incubations <6 h. Two hundred-eleven (29%) cases had incubations >72 h, including 124 (17%) cases with incubations of >72 to 120 h, 52 (7%) with incubations >120 to 168 h and 35 (5%) with incubations longer than 168 h (Fig. 2).
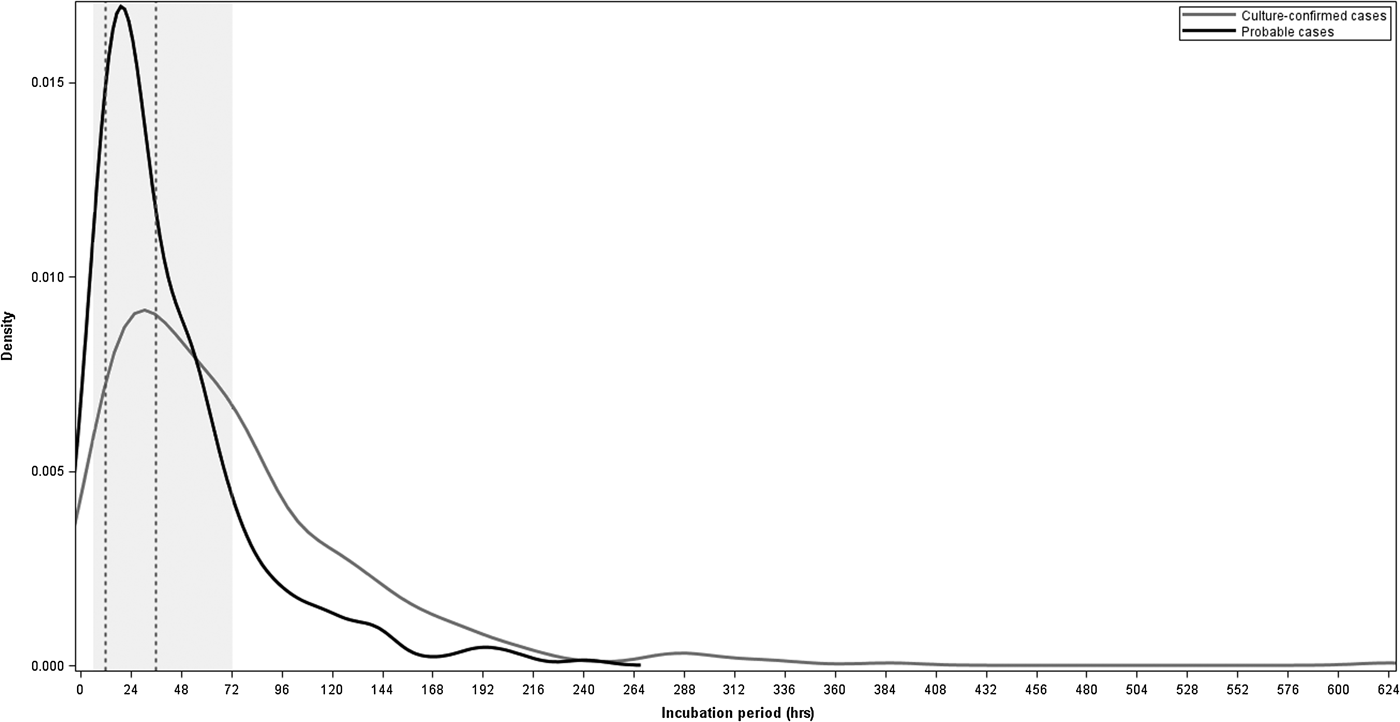
Fig. 2. Density plot of incubation periods in hours for culture-confirmed and probable salmonellosis outbreak cases with known incubation periods, Minnesota, 2000–2015. The shaded region represents the commonly referenced range of 6–72 h and the area between the dashed vertical lines represents the commonly referenced usual range of 12–36 h.
Table 1. Known incubation periods for non-typhoidal salmonellosis outbreak cases, Minnesota, 2000–2015

a Mann–Whitney test comparing median incubation values between culture-confirmed and probable cases.
b Objective symptoms were defined as diarrhoea, vomiting, or fever.
Culture-confirmed cases had significantly longer median incubation periods to first symptom (54.5 h vs. 29.8 h; P < 0.001) and to first objective symptom (62.5 h vs. 35.5 h; P < 0.001) than probable cases (Table 1). The clinical criteria for defining probable cases was variable during the study period. When the analysis was restricted to culture-confirmed cases and probable cases that were defined based on a specific clinical case definition of diarrhoea ⩾3 days in duration or accompanied by fever, the incubation period to first symptom for confirmed cases remained significantly longer than for probable cases (54.5 h (IQR, 27.0–94.0 h) vs. 32.3 h (IQR, 15.8–60.3 h); P < 0.001).
Using the Gamma distribution, the estimated median incubation period for all cases with known incubations was 43.2 h (95% CI 40.0–46.3 h). The estimated median incubation period for culture-confirmed cases was 53.4 h (95% CI 48.6–58.3 h) and for probable cases was 32.1 h (95% CI 28.7–35.6 h).
Since median incubation periods for culture-confirmed and probable cases were significantly different, all analyses were performed with and without the probable cases. The results presented are restricted to culture-confirmed cases unless otherwise noted.
Host factors
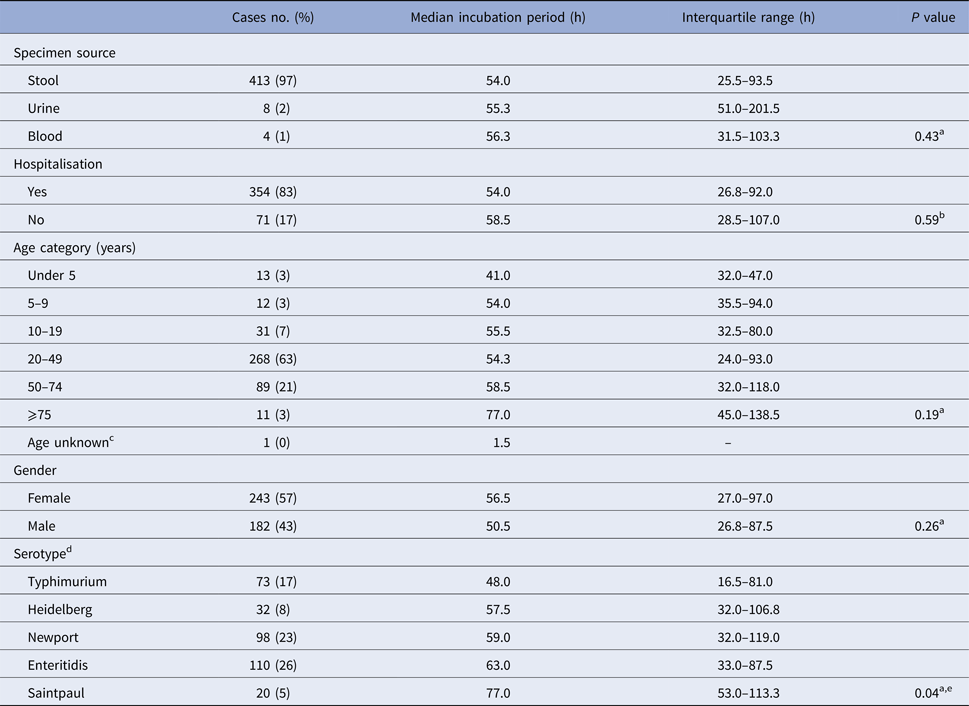
There was no significant difference in median incubation period by gender or age (Table 2). Younger cases tended to have shorter incubation periods than older cases; cases under 5 years of age (n = 13) had the shortest median incubation period (41.0 h; IQR, 32.0–47.0 h) and cases ⩾75 years of age (n = 11) had the longest median incubation period (77.0 h; IQR, 45.0–138.5 h) (Table 2).
Table 2. Illness characteristics, demographics, serotype and median incubation period for culture-confirmed, salmonellosis outbreak cases with known incubation periods, Minnesota, 2000–2015
a Kruskal–Wallis test comparing median incubation values.
b Mann–Whitney test comparing median incubation values.
c Cases with unknown age were excluded from analysis.
d Only cases with infections caused by the five most commonly reported serotypes were included.
e Median incubation period for S. Typhimurium cases was significantly shorter than all other top five serotypes except for S. Heidelberg. No significant difference in median incubation period among S. Heidelberg, S. Newport, S. Enteritidis, or S. Saintpaul.
Illness characteristics
There was no difference in the median incubation period for cases that were hospitalised vs. those that were not (Table 2). Similarly, no difference in incubation period was observed with respect to specimen source (e.g. stool, blood, or urine) (Table 2).
Serotype
The 119 outbreaks during the study period were caused by 31 different Salmonella serotypes; S. Enteritidis (n = 31), S. Typhimurium (n = 18) and S. Newport (n = 12), were the top three outbreak-associated serotypes. S. Enteritidis, S. Newport, S. Typhimurium, S. Heidelberg and S. Saintpaul were the top five serotypes detected among culture-confirmed outbreak cases with known incubations. Culture-confirmed S. Typhimurium cases had a significantly shorter median incubation period than the other top serotypes except for S. Heidelberg (Table 2). There was no difference in median incubation period among the other most commonly reported serotypes (Table 2).
Outbreak vehicle class
Among the five vehicle classes with the most culture-confirmed cases with known incubations (produce, n = 102; prepared foods, n = 93; egg/egg dishes, n = 82; turkey, n = 40; chicken, n = 23), cases associated with prepared foods (25.0 h; IQR, 14.0–52.5 h) had the shortest median incubation period and cases associated with produce (73.5 h; IQR, 47.5–132.5 h) had the longest median incubation period (Fig. 3). Prepared food outbreak cases had a significantly shorter median incubation period than cases in other outbreak vehicle classes except for turkey (Fig. 3). Produce outbreak cases had significantly longer incubation periods than cases in prepared food, turkey and egg outbreaks, but not chicken outbreaks (Fig. 3). Findings were similar when probable cases with known incubations were included along with culture-confirmed cases (data not shown).
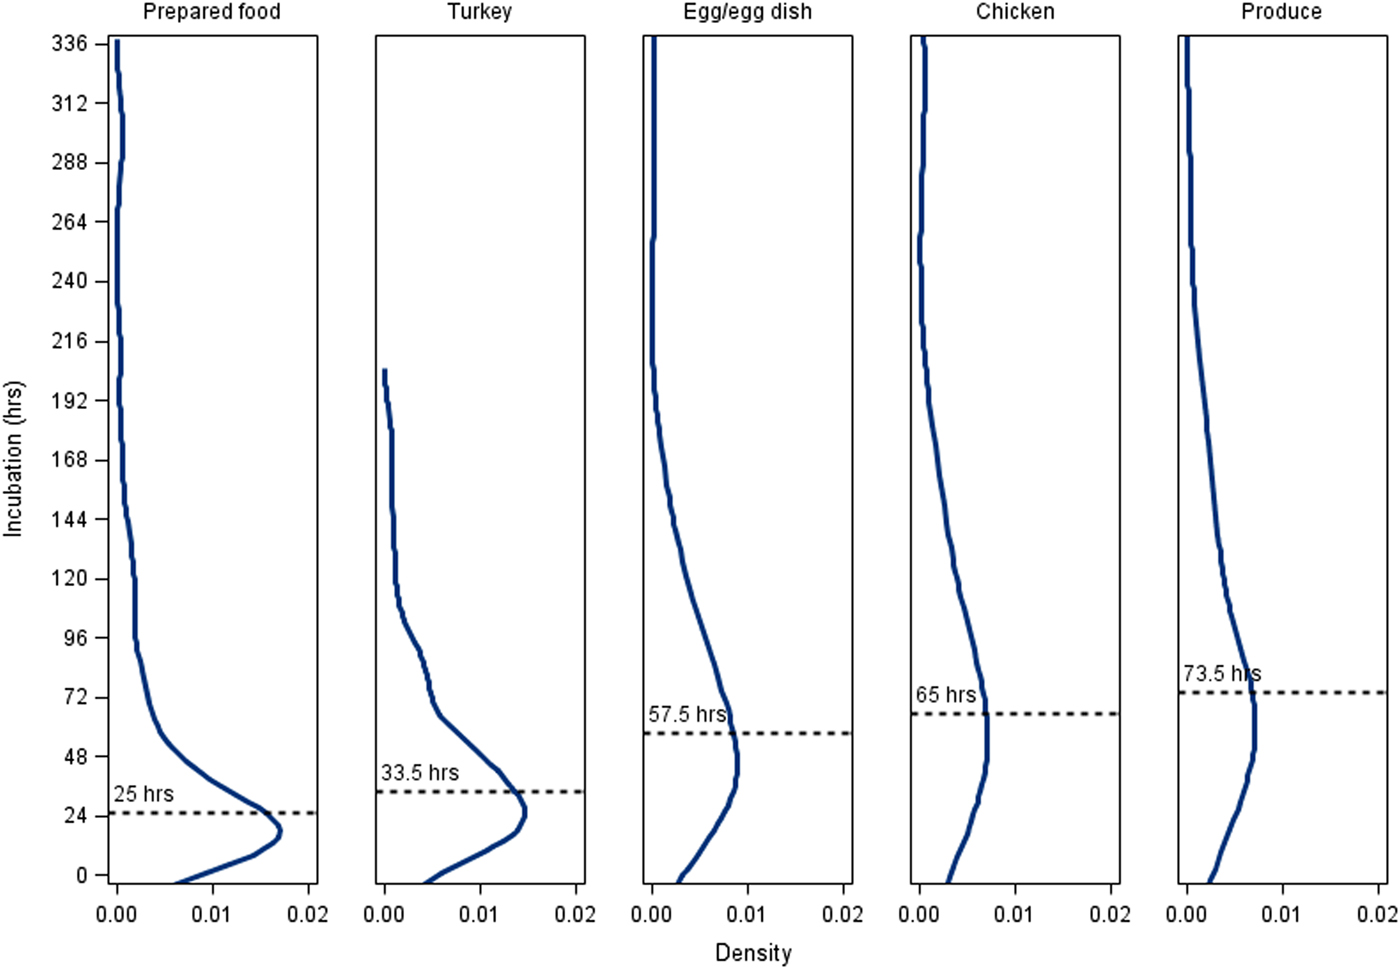
Fig. 3. Density plots of incubation periods for culture-confirmed, outbreak-associated salmonellosis cases with known incubation periods by outbreak vehicle class, Minnesota, 2000–2015. Median incubation period values: All culture-confirmed cases with known incubation periods, 54.25 h; prepared fooda (n = 93), 25 h; turkeya (n = 40), 33.5 h; egg/egg dishb (n = 82), 57.5 h; chickenb,c (n = 23), 65 h; producec (n = 102), 73.5 h. Prepared foods were defined as combination dishes that were prepared at the point of service and a specific ingredient was not implicated. Vehicle classes that share a letter are not significantly different at α < 0.05.
Among all outbreak cases with known incubation periods <24 h, 59% were associated with prepared foods, whereas only 13% of cases with incubation periods >72 h were associated with prepared foods. Twenty-nine per cent of cases with incubation periods >72 h were associated with produce, whereas only 12% of cases with incubation periods <24 h were associated with produce.
Setting
The majority (90%) of culture-confirmed cases with known incubation periods were associated with restaurant/event (n = 359) outbreaks as opposed to commercial products (n = 66). Cases associated with commercial products had a longer median incubation (72.3 h (IQR, 32.0–107.0 h) vs. 52.0 h (IQR, 25.0–91.0 h)); however, the difference was not statistically significant (P = 0.09). Over half (55%) of all known incubation cases associated with commercial products were associated with produce vs. 15% of restaurant/event outbreak cases. When probable cases were included along with culture-confirmed cases, the median incubation period for cases that were part of commercial product outbreaks (n = 74) was significantly longer than cases that were associated with restaurants/events (n = 651) (64.0 h (IQR, 32.0–96.0 h) vs. 42.0 h (IQR, 20.0–75.5 h); P < 0.001).
Overall variability among outbreaks
The distribution of incubations varied from 13.5 to 152.0 h among the 66 outbreaks with more than one case with a known incubation (median, 57.5 h; IQR, 42.5–80.2 h) (Fig. 4, Supplementary Table S1 available on the Cambridge Core website). Among the 66 outbreaks with multiple cases with known incubations (culture-confirmed and probable), 21 (32%) outbreaks had a median incubation period >72 h, 52 (79%) outbreaks had a median incubation period >36 h and 8 (12%) outbreaks had median incubation periods ⩽24 h (Fig. 4, Supplementary Table S1).
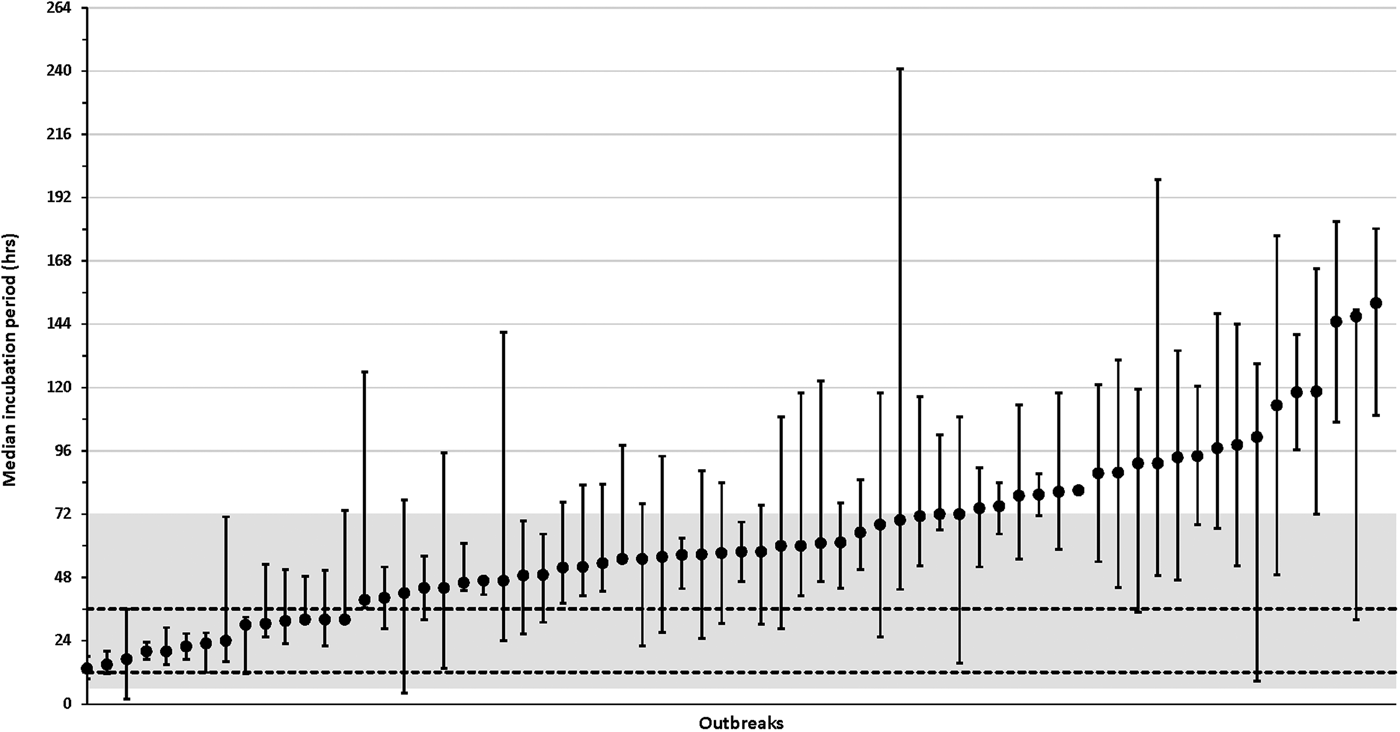
Fig. 4. Median incubation periods for individual salmonellosis outbreaks, Minnesota, 2010–2015. Graph only includes outbreaks with more than one case (culture-confirmed or probable) with a known incubation period. Whisker lines represent the 25% quartile and 75% quartile incubation values for each outbreak. The shaded region represents the commonly referenced range of 6–72 h and the area between the dashed horizontal lines represents the commonly referenced usual range of 12–36 h. See Supplementary Table S1 (available online at Cambridge Core website) for more information about outbreak characteristics including overall incubation ranges and, case counts.
Discussion
In our study population of case-patients with foodborne outbreak-associated NTS infections, 60% of those with culture-confirmed infections had incubation periods within the commonly referenced overall range of 6–72 h for NTS and 27% had incubation periods within the commonly referenced ‘usual’ range of 12–36 h. Thirty-eight per cent of case-patients had incubation periods longer than 72 h; of these, many fell in the >72 to 120 h (>3- to 5-day) range, but a substantial proportion (25%) of these cases fell in the >120 to 168 h (>5- to 7-day) range. Furthermore, incubations even longer than 7 days were also documented; a majority of these were in the 8–9-day range, but several were in the 10–16-day range. Our findings are consistent with numerous published NTS outbreak investigations that have documented median incubations of >3 days, several as long as 7 to 10 days. Therefore, we recommend that reference materials be changed to reflect that NTS incubations are commonly longer than currently stated. Based on our data, a more accurate description would be that the incubation of NTS infection is usually from 12 to 96 h, that incubations in the >96 to 144 h (>4 to 6-day) range are not unusual and that incubations from 7 to 9 days and occasionally longer also occur.
Foodborne NTS outbreaks can be complicated and challenging to investigate. Hypothesis-generating interviews must balance the desire to capture information from the entire possible exposure time frame for case-patients with the practicality of focusing on the most likely exposure time frame. Asking case-patients about exposures during a more limited number of days prior to illness onset conserves limited public health resources, makes it easier for case-patients to provide complete and accurate information and decreases the number of possible exposure sources (almost all of which will not be related to the outbreak) identified with more expansive exposure histories. The latter is an important consideration when comparing case exposure frequencies with control exposure frequencies or background consumption rates. When interviewing NTS case-patients, some public health agencies ask about exposures during the 3 days prior to illness onset, some ask about 5 days and some ask about 7 days (MDH unpublished data). Based on our data, 3-day exposure histories would be inadequate for the purpose of investigating outbreaks (or for studies of sporadic NTS cases for attribution or other purposes). Five-day exposure histories would be reasonable but could still miss the exposure of interest for an appreciable proportion of cases. Seven-day exposure histories would capture appropriate exposures for a greater proportion of cases. Seven-day histories also have the advantage that background consumption frequency data, when they do exist, are typically based on 7-day dietary histories of those surveyed. If resources permit, a 7-day food history is desirable for capturing possible exposures.
Because incubations longer than 7 days do occur, once an outbreak vehicle or setting is identified or suspected, potential case-patients should be queried about exposure to those vehicles/settings within at least 2 weeks prior to illness onset. Likewise, if people with NTS-compatible illness are documented to have had exposure to the implicated vehicle/setting within 2 weeks, they reasonably could be classified as primary cases in the outbreak.
Median incubations for the foodborne NTS outbreaks in this study varied widely, from 13.5 h to 152.0 h. A primary factor affecting incubation period included the type of food vehicle. Cases of outbreaks associated with produce had longer median incubation periods than cases of outbreaks associated with other vehicles except for chicken. Conversely, cases of outbreaks associated with prepared foods had significantly shorter median incubation periods than cases of outbreaks associated with other vehicles except for turkey. These results could be explained by dose-response effects. For example, the level of Salmonella contamination of raw produce, when detected, is often very low [Reference Reddy17]. This could translate into lower doses for cases exposed to contaminated produce and lower doses can result in longer incubation periods [Reference Mintz8]. Conversely, prepared foods may contain higher doses related to cross-contamination and subsequent time-temperature abuse on site; this could at least partly explain the shorter incubations observed for this type of vehicle. Whether short or long, the median incubation period for a cluster of salmonellosis cases (i.e., when cases are known to be associated with a particular event or setting) may provide clues to the potential vehicle or contributing factors for the outbreak.
The median incubation of cases also differed by serotype. Cases infected with Salmonella Typhimurium had shorter median incubations than cases infected with some of the other most common serotypes. These findings should be viewed with caution, as many Salmonella serotypes are commonly associated with certain food vehicles (e.g., S. Javiana and produce, S. Enteritidis and eggs [Reference Jackson18]) and possible interactions between serotype and vehicle type could not adequately be assessed in this study due to small numbers of cases in sub-analyses.
There was some evidence that age also affected incubation, with younger cases having shorter incubations and older patients having longer incubations. However, the differences were not statistically significant when the analysis was restricted to culture-confirmed cases. The lack of significance could have been due to a lack of power resulting from small numbers of cases in the youngest and oldest age groups.
In our study, culture-confirmed cases had significantly longer incubation periods than probable (i.e., clinically defined) cases. This was consistently observed when using time of onset of any symptom and time of onset of the first objective symptom. We believe that this difference is most likely an artifact. Some ill individuals were likely misclassified as probable NTS cases when their illness may have been due to other common enteric pathogens such as norovirus or Clostridium perfringens, which have overlapping symptom profiles but shorter average incubation periods than NTS. In addition, probable cases are often identified and interviewed later in investigations and it is possible that they systematically report being ill closer to the implicated meal than do culture-confirmed cases. Whatever the reason, this is something that other outbreak investigators are likely to encounter and should consider carefully as they enroll non-culture-confirmed cases in analytic studies to identify outbreak vehicles. Very specific clinical case definitions should be used for probable cases that are included in these analytic studies.
The data presented here have limitations in addition to those discussed above. All symptom and exposure data were collected via self-report and are subject to recall bias. Cases of outbreaks that were associated with restaurants or events were more represented in the dataset due to the singular and memorable nature of the exposure. As such, analyses of vehicle type and serotype for outbreaks that did not occur in these settings were not as robust. Finally, this study was limited to the data available through outbreak surveillance. As such, some sub-analyses presented here may not have been sufficiently powered to detect differences.
Conclusions
Incubation periods in foodborne outbreak-associated NTS infections exceeded the commonly referenced overall range of 6 to 72 h for NTS in about one-third of cases. Incubation period length varied by outbreak food vehicle type, Salmonella serotype and outbreak setting. These findings have implications for NTS outbreak investigations, as well as for studies of sporadic NTS cases that attempt to characterise sources of illness. Reference materials that provide information on incubation period for NTS infection, previously based on sparse data, should be updated to reflect the data in this study as well as those in published outbreak investigations.
Supplementary material
The supplementary material for this article can be found at https://doi.org/10.1017/S0950268818000079
Acknowledgements
We thank all members of the Minnesota Department of Health Foodborne, Waterborne, Vectorborne and Zoonotic Disease Section, Public Health Laboratory and Division of Environmental Health; Minnesota Department of Agriculture; epidemiologists, environmental health specialists and public health staff at the county and city levels and other investigation partners who contributed to the outbreak investigations and the preparation of this manuscript. We also thank Melanie Firestone for contributing to the analyses.
Financial Support
This work was supported in part through cooperative agreements with the Centers for Disease Control and Prevention Epidemiology and Laboratory Capacity for Infectious Diseases Program #3U50CK000371.
Declaration of Interest
None.


