


Australia has some of the highest rates worldwide of compulsory community treatment (CCT), which is primarily driven by community treatment orders (CTOs). Reference Light1-Reference Gill, Amos, Muhsen, Hatton, Ekanayake and Kisely3 Even within Australia, use varies widely across jurisdictions despite general similarities in legislation and health services. Reference Light1 For instance, annual incidence rates ranged from 68.7 per 100 000 population in New South Wales (NSW) to 112.5 per 100 000 in South Australia in the most recent national comparison (2016–2017). Reference Light1 Variations in the use of CCT within the same jurisdiction have also been reported in New Zealand, England and Norway. Reference O’Brien4–Reference Riley, Sharashova and Rugkåsa8 This is clinically relevant because there is evidence of greater patient and system benefit, in the form of reduced hospital bed-days and admissions, when CCT placement is lower and better targeted. Reference Kisely, McMahon and Siskind9 Of particular concern is the disproportionate CCT use in people who were born outside Australia with evidence that people who require an interpreter to access services are nearly three times more likely to be on CCT. Reference Moss, Wyder, Braddock, Arroyo and Kisely10 Another concern is the limited information on CCT use in First Nations people. Three studies from Queensland reported they were over-represented among people on CCT, while two other studies from Victoria and Western Australia found no evidence of increased CCT likelihood. Reference Kisely, McMahon and Siskind9
Measuring rates in a uniform way
One limitation has been the lack of standardisation in how rates of CCT use are measured. The most comprehensive review of rates of use across Australia relied on the total numbers of treatment orders made and/or individuals on orders that were published in annual reports of Australian state and territory mental health review tribunals (MHRTs), health departments and/or offices of the relevant chief psychiatrist. These were supplemented by requests for further information where relevant. Reference Light1 Consequently, the conclusions of that review were limited by difficulties related to data availability and comparability, such as different methods of defining and counting CTO cases. Reference Light1 For instance, the numbers in Queensland were based on a snapshot figure of data on a given day during the reporting period, rather than total annual numbers. In the case of South Australia, numbers were only provided by CTO subtype: ‘Level 1’ orders that are initially made by authorised professionals and subsequently confirmed by the MHRT and ‘Level 2’ CTOs that are made by the MHRT on application. As a result, it was impossible to derive the total number of CTO cases, given some individuals may have been on both levels during the year. Uniform data are available from the Australian Institute of Health and Welfare (AIHW). State and territory health authorities must submit a core set of information for the Community Mental Health Care National Minimum Data Set (CMHC NMDS) to form part of AIHW’s annual National Community Mental Health Care Database (NCMHCD). As part of the NCMHCD, information is collected on the percentage of contacts with government-funded community mental health services (MHSs) where the person is treated on an involuntary basis. This is publicly available on the AIHW website at jurisdiction level, but not in any further detail. 11 Thus, the aim of this study was to examine rates of CCT use in people attending community MHSs across different jurisdictions and their constituent health districts, relative to key sociodemographic characteristics. This was part of a wider project on CCT use, the Factors Affecting Community Treatment Orders Research Study (FACTORS). The jurisdictions selected include Queensland, South Australia, NSW and Victoria as they represent a wide range of CCT use. This was a first step to exploring variations in CCT use by FACTORS team members in each of these four states with both quantitative and qualitative methods.
Method
Data sources
Using 2018 aggregated administrative data from the AIHW, we examined rates of CCT use among people in contact with community MHSs across health districts in each jurisdiction. This primarily consists of clinician-ordered CTOs, although forensic orders are also included. The advantage of this approach was that we considered variations in CCT use relative to users of community MHSs, not the whole population of each health district. Our results were therefore more reflective of clinical practice within services and less affected by overall MHS provision or access.
Data from 2018 were used as this was the last year for which we could obtain information that excluded the effects of the COVID-19 pandemic. For instance, we could not be sure that variations in severity of lockdowns both within, and between, jurisdictions might exacerbate existing differences in MHS use, thereby limiting the generalisability of findings. Based on information from the Australian Bureau of Statistics, Queensland and South Australia experienced lockdowns of low severity, NSW of moderate severity and Victoria of high severity. 12 Furthermore, this classification does not take into account situations where lockdowns were restricted to particular parts of a state, most commonly metropolitan areas. Importantly, although a new Mental Health and Wellbeing Act (2022) was implemented in Victoria in 2023, there have been no changes to mental health legislation in the three other jurisdictions since 2018. The AIHW collects both people- and contact-based data. We chose the former as they were not influenced by intensity of services, and they allowed comparison with previous work that reported population rates of individuals on CCT. The data were further stratified by age, sex, First Nations status, region of birth and marital status. We obtained ethical clearance from the Metro South Health Human Research Ethics Committee (HREC/2023/QMS/94340). Individual patient consent was not required as this was an analysis of anonymised aggregated data.
Analysis of variations in CCT placement
We measured the proportion of people who were under CCT at any time in 2018 as a percentage of all people in contact with community MHSs across health districts in each jurisdiction. The unit of analysis was the individual health district. We excluded health districts that were restricted to subspecialties such as forensic or child and adolescent psychiatry. Health districts were ranked by frequency of use in each jurisdiction and standard error bars plotted in Excel version 2412 (build 16.0.18324.20240 for Microsoft 365 MSO). We then assessed the significance of associations between CCT use and the following dichotomised sociodemographic variables in each jurisdiction using odds ratios and 95% confidence intervals: age (25–44 years old versus the remainder), sex, single status (never married versus the remainder), identified as First Nations person or not and born in Oceania versus outside of Oceania. Oceania is an AIHW demographic definition and refers primarily to people born in Australia and New Zealand although it does include Papua New Guinea and other West Pacific islands. These analyses were performed in R for Windows (RStudio 2024.09.0+375 ‘Cranberry Hibiscus’, Posit PBC, Boston, MA; see https://posit.co/download/rstudio-desktop/).
Results
Across the four jurisdictions, there were data on 402 060 individuals who were in contact with specialist MHSs of whom 148 210 came from NSW, 84 731 from Victoria, 123 785 from Queensland and 45 334 from South Australia. Half were male (n = 200 890), 59% single (n = 235 148) and 37% were aged between 25 and 44 years old (n = 150 688). Thirteen per cent were born outside Oceania (n = 52 413) and 9% were First Nations people (n = 36 306). Roughly two-thirds were residents of a metropolitan area (n = 255 551). Table 1 and Fig. 1 show the sociodemographic features of each jurisdiction. The proportion of people who were First Nations people was lowest in Victoria and highest in Queensland. By contrast, Queensland had the lowest percentage of people born outside Oceania, while Victoria and NSW had the highest.
Table 1 Sociodemographic characteristics of the sample
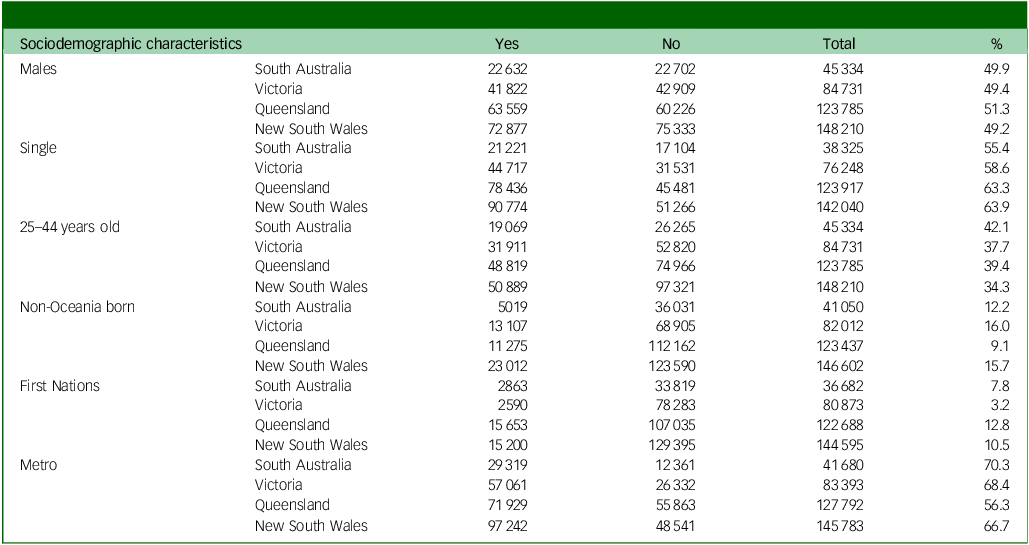
Note: The totals in each comparison varied because of missing or unreported data.
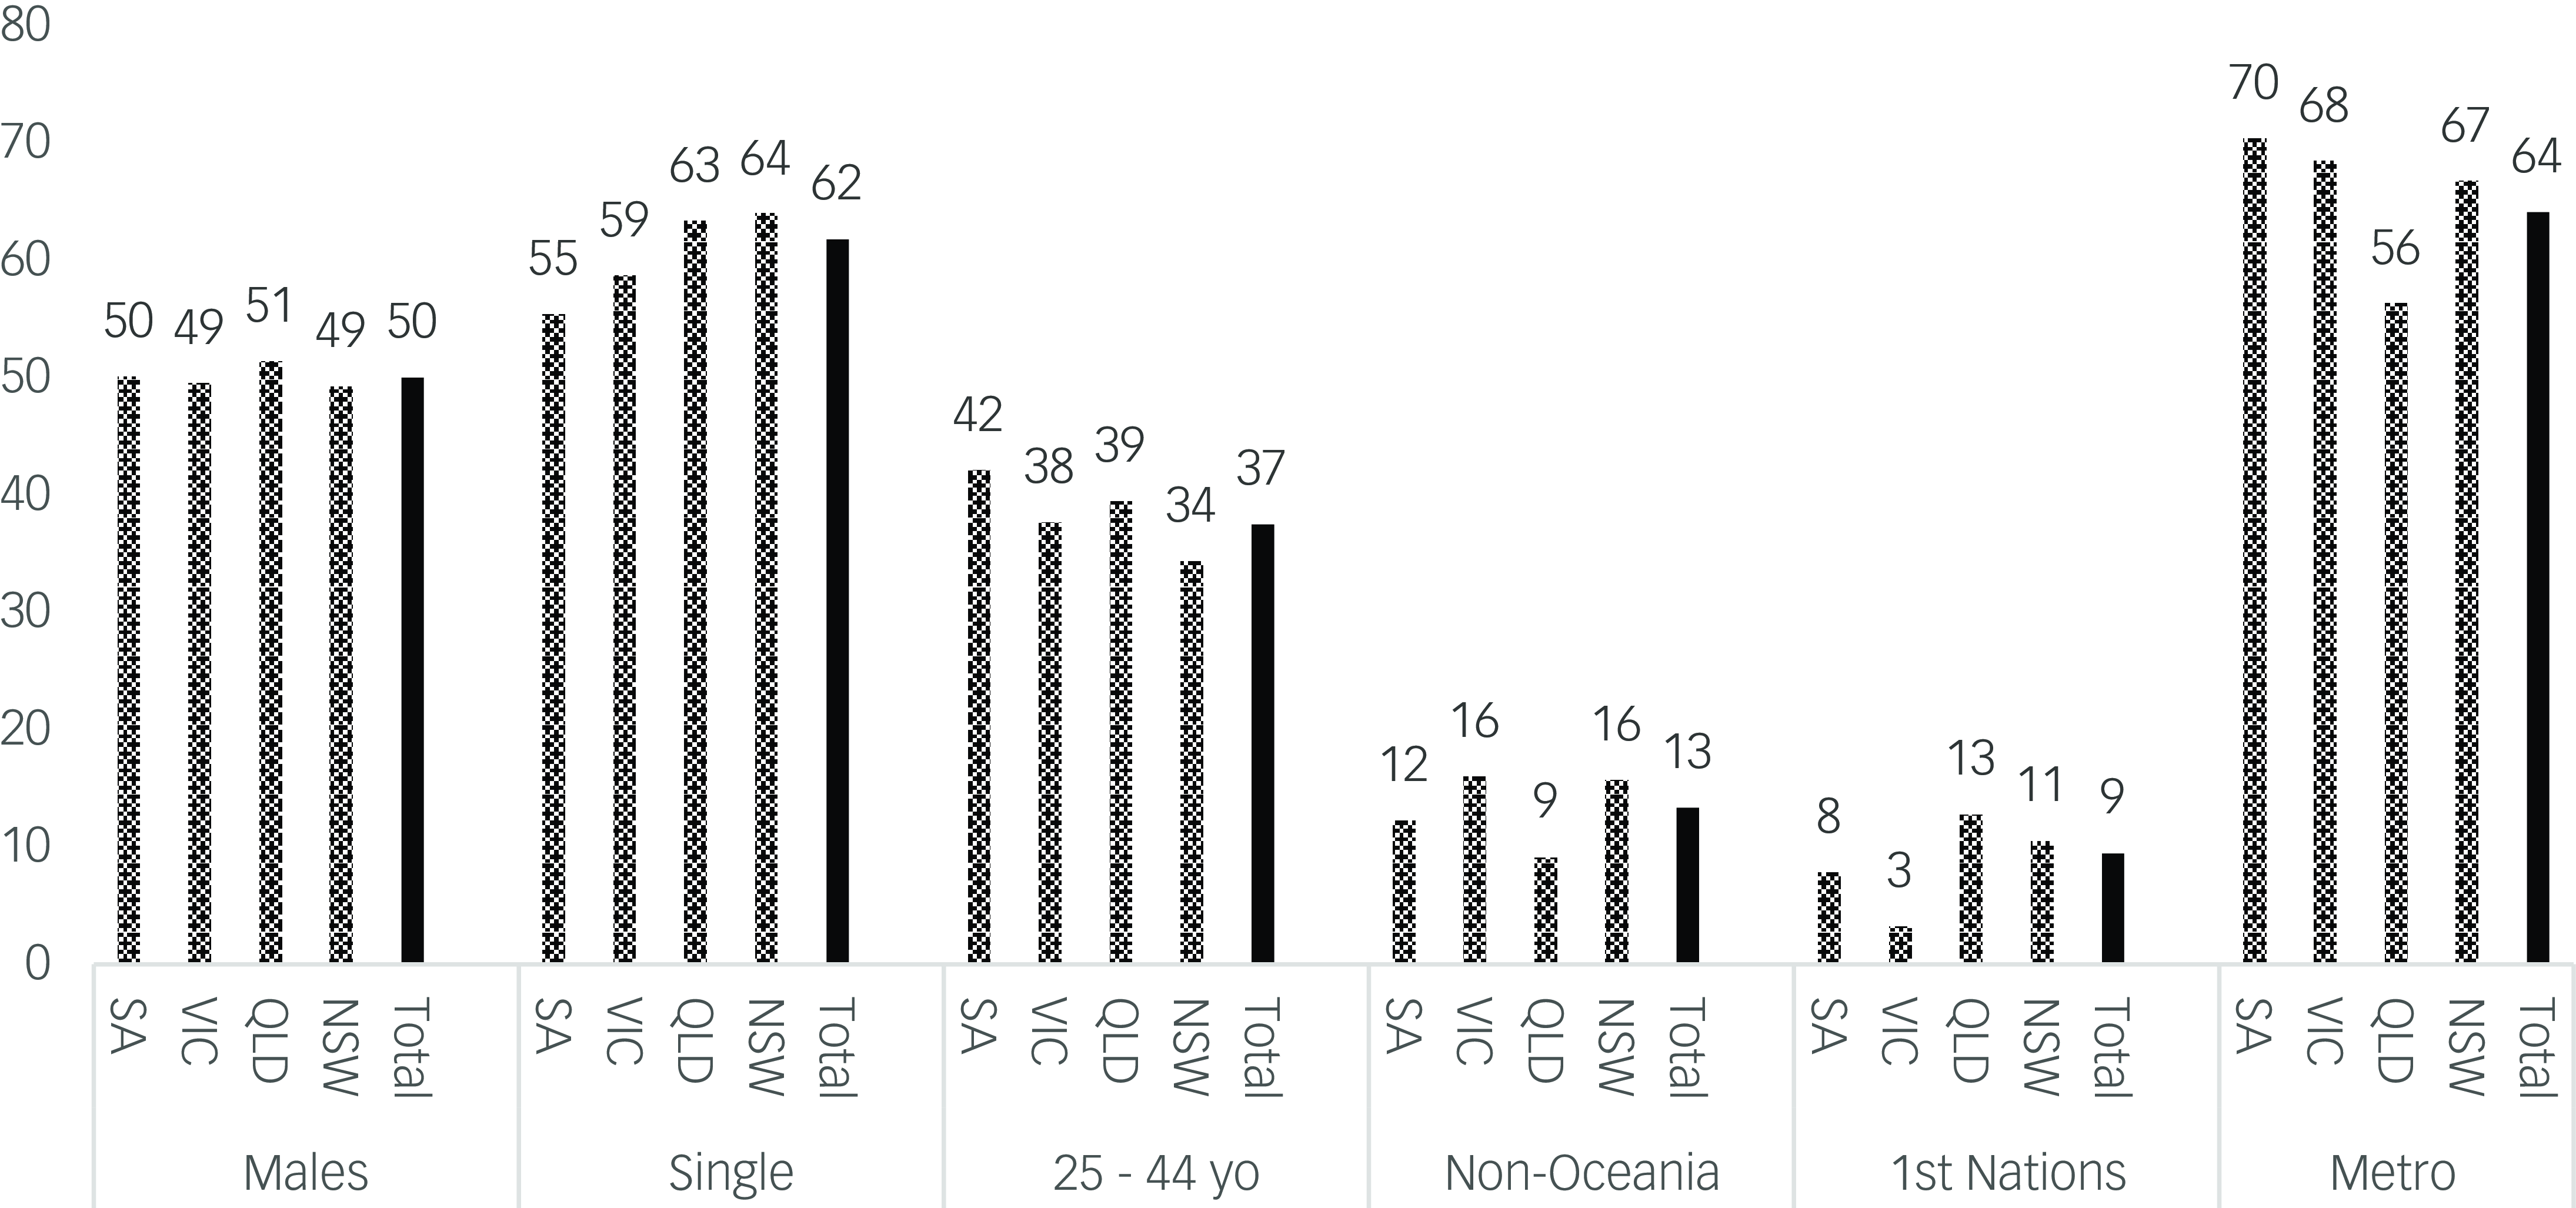
Fig. 1 Sociodemographic features of the sample. NSW, New South Wales; QLD, Queensland; VIC, Victoria; SA, South Australia.
Of the 402 060 people in contact with community MHSs, 51 351 (12.8%) were treated involuntarily under CCT. Rates varied from 8% in NSW to 17.6% in South Australia (Fig. 2). There were also wide variations by health district in the proportion of MHS attendees on CCT within jurisdictions (Fig. 3). In NSW it ranged from 2% to 13%, in Victoria from 6% to 24%, in Queensland from 11% to 25% and in South Australia from 6% to 36%.
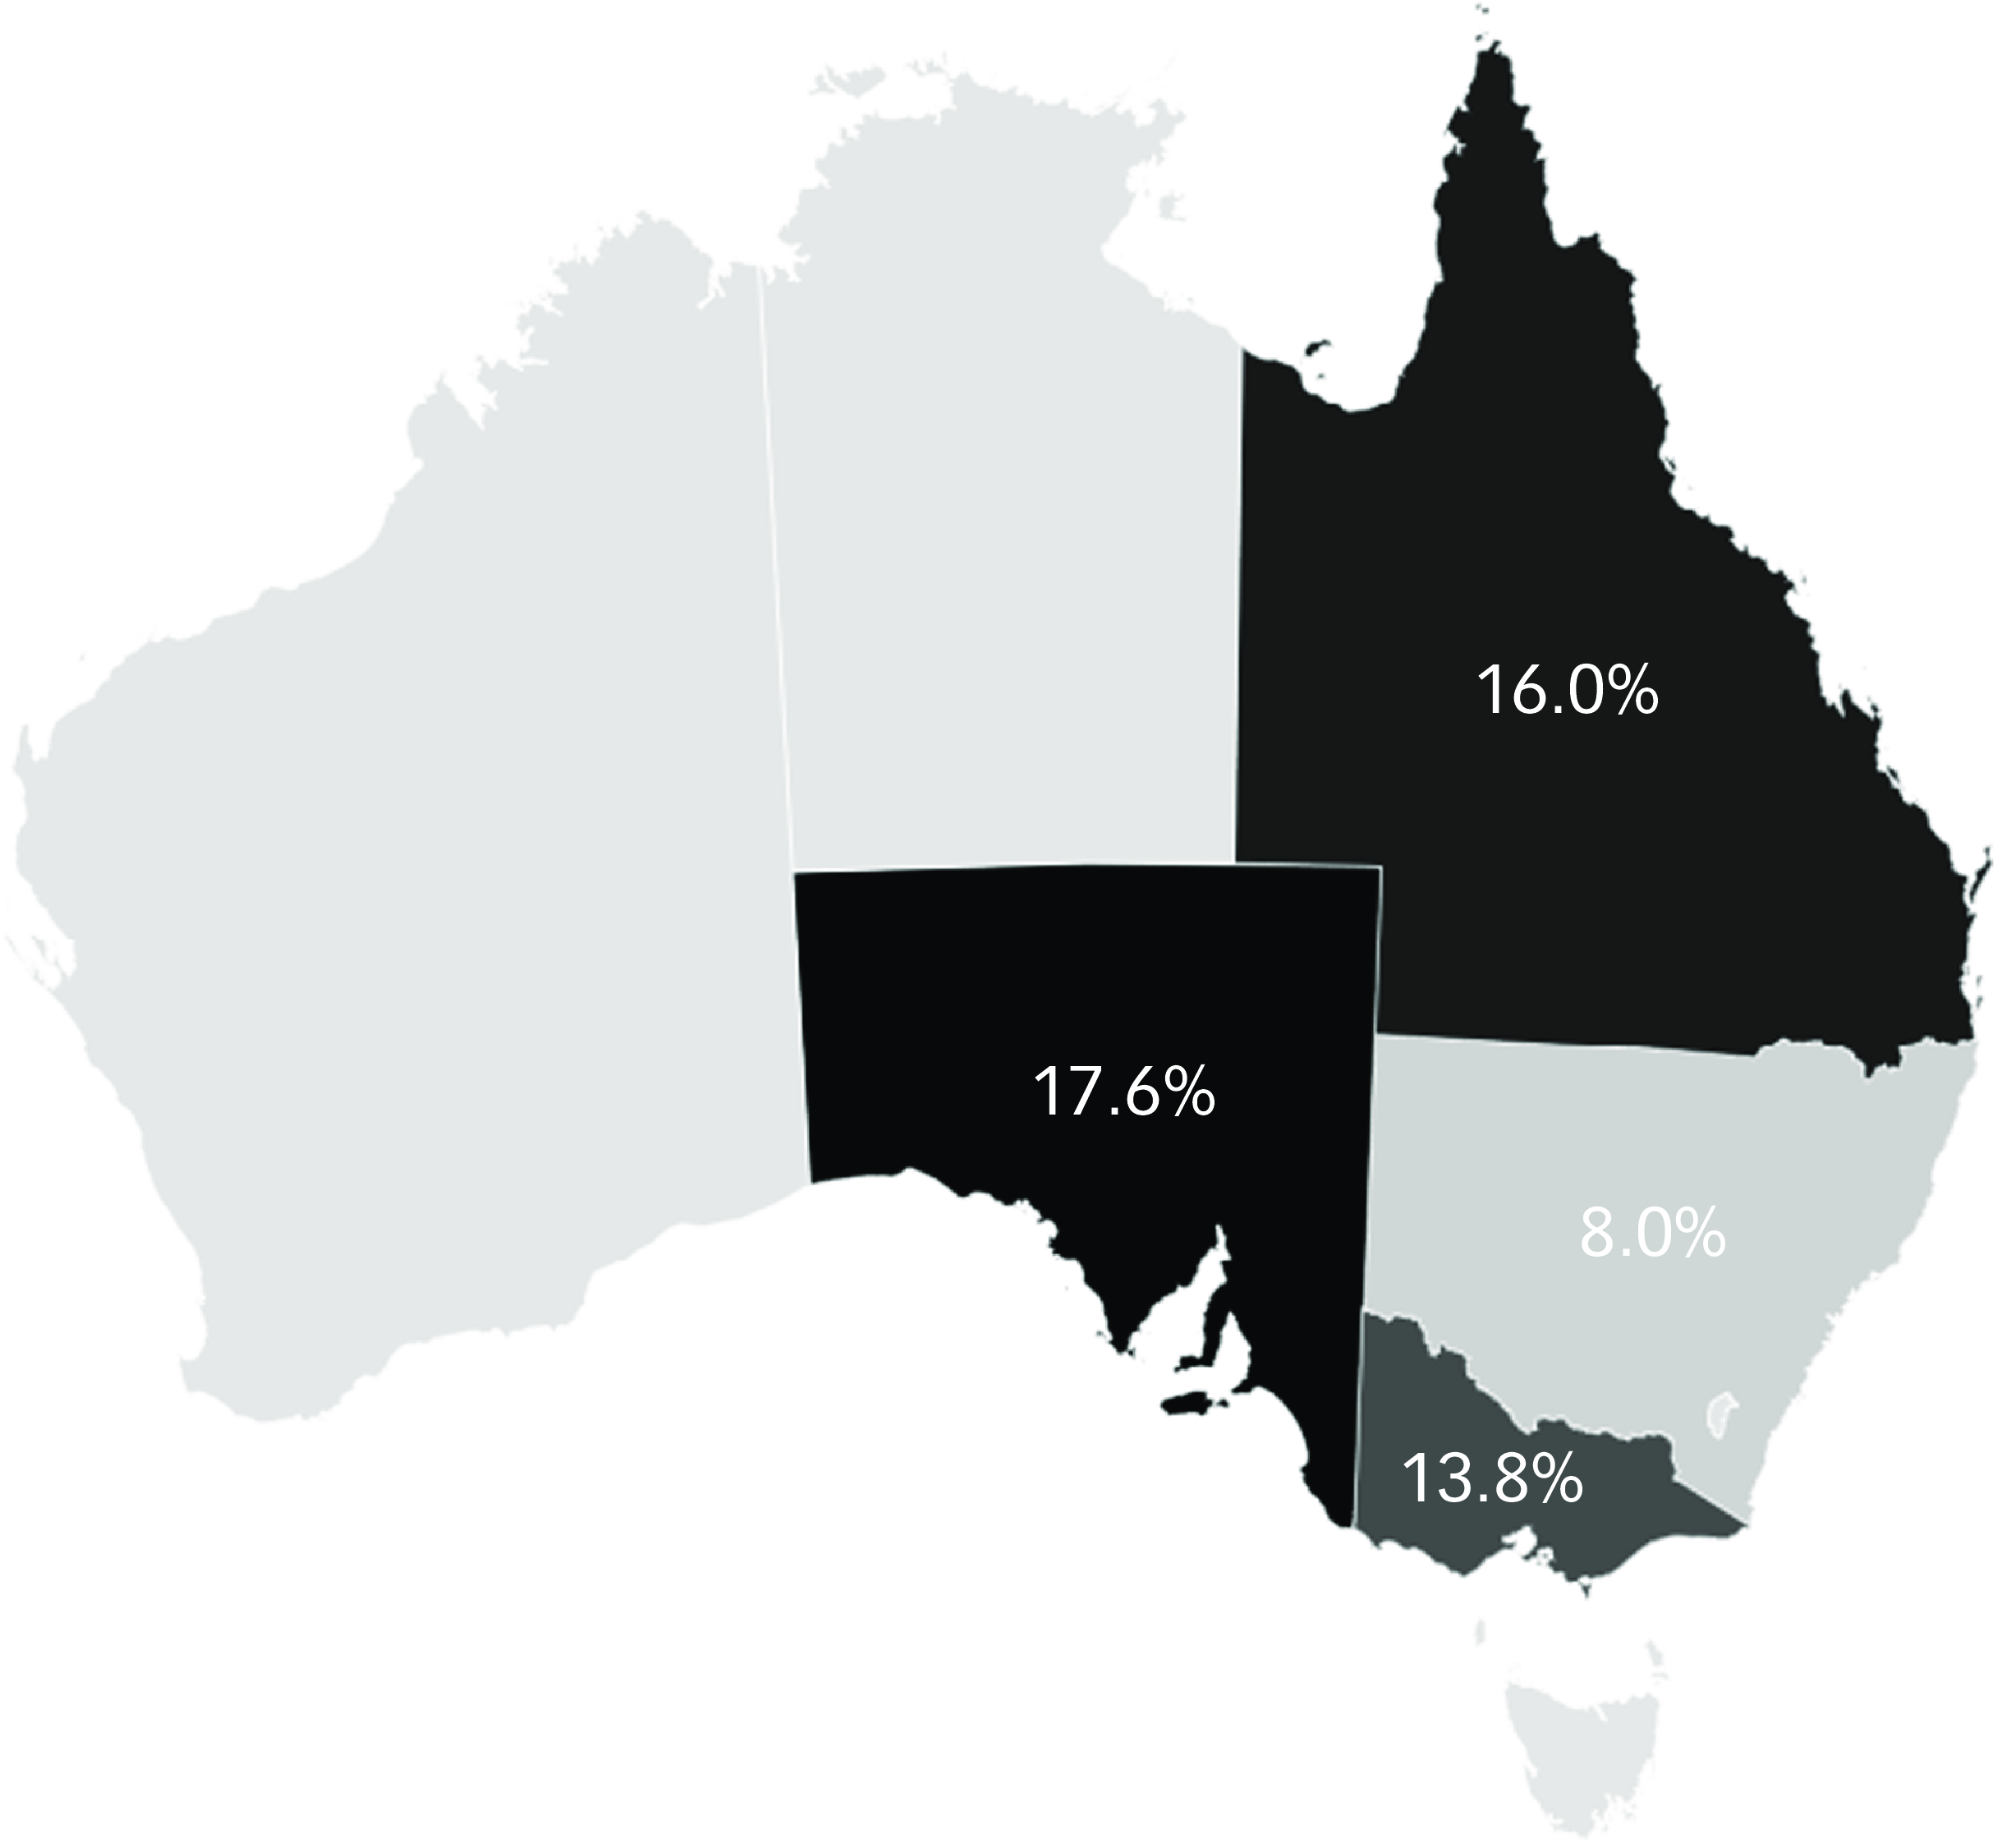
Fig. 2 Use of compulsory community treatment in the four jurisdictions.

Fig. 3 Use of compulsory community treatment by anonymised health district across the four jurisdictions. NSW, New South Wales; VIC, Victoria; QLD, Queensland; SA, South Australia.
Next, we investigated associations between sociodemographic variables and CCT at the jurisdictional level (Fig. 4). The number in each comparison varied because missing or unreported data were not shown for each sociodemographic variable but were included in the total of 402 060. The diamond at the bottom of each subsection represents the aggregate results and associated 95% confidence intervals for all jurisdictions combined. MHS attendees who were male, single and aged between 25 and 44 years old were significantly more likely to be subject to CCT (Fig. 4), as were people living in a metropolitan area. Individuals born outside Oceania were also more likely to receive CCT. By contrast, First Nations status was not associated with being on CCT in MHS attendees apart from in Queensland and South Australia (Fig. 4).
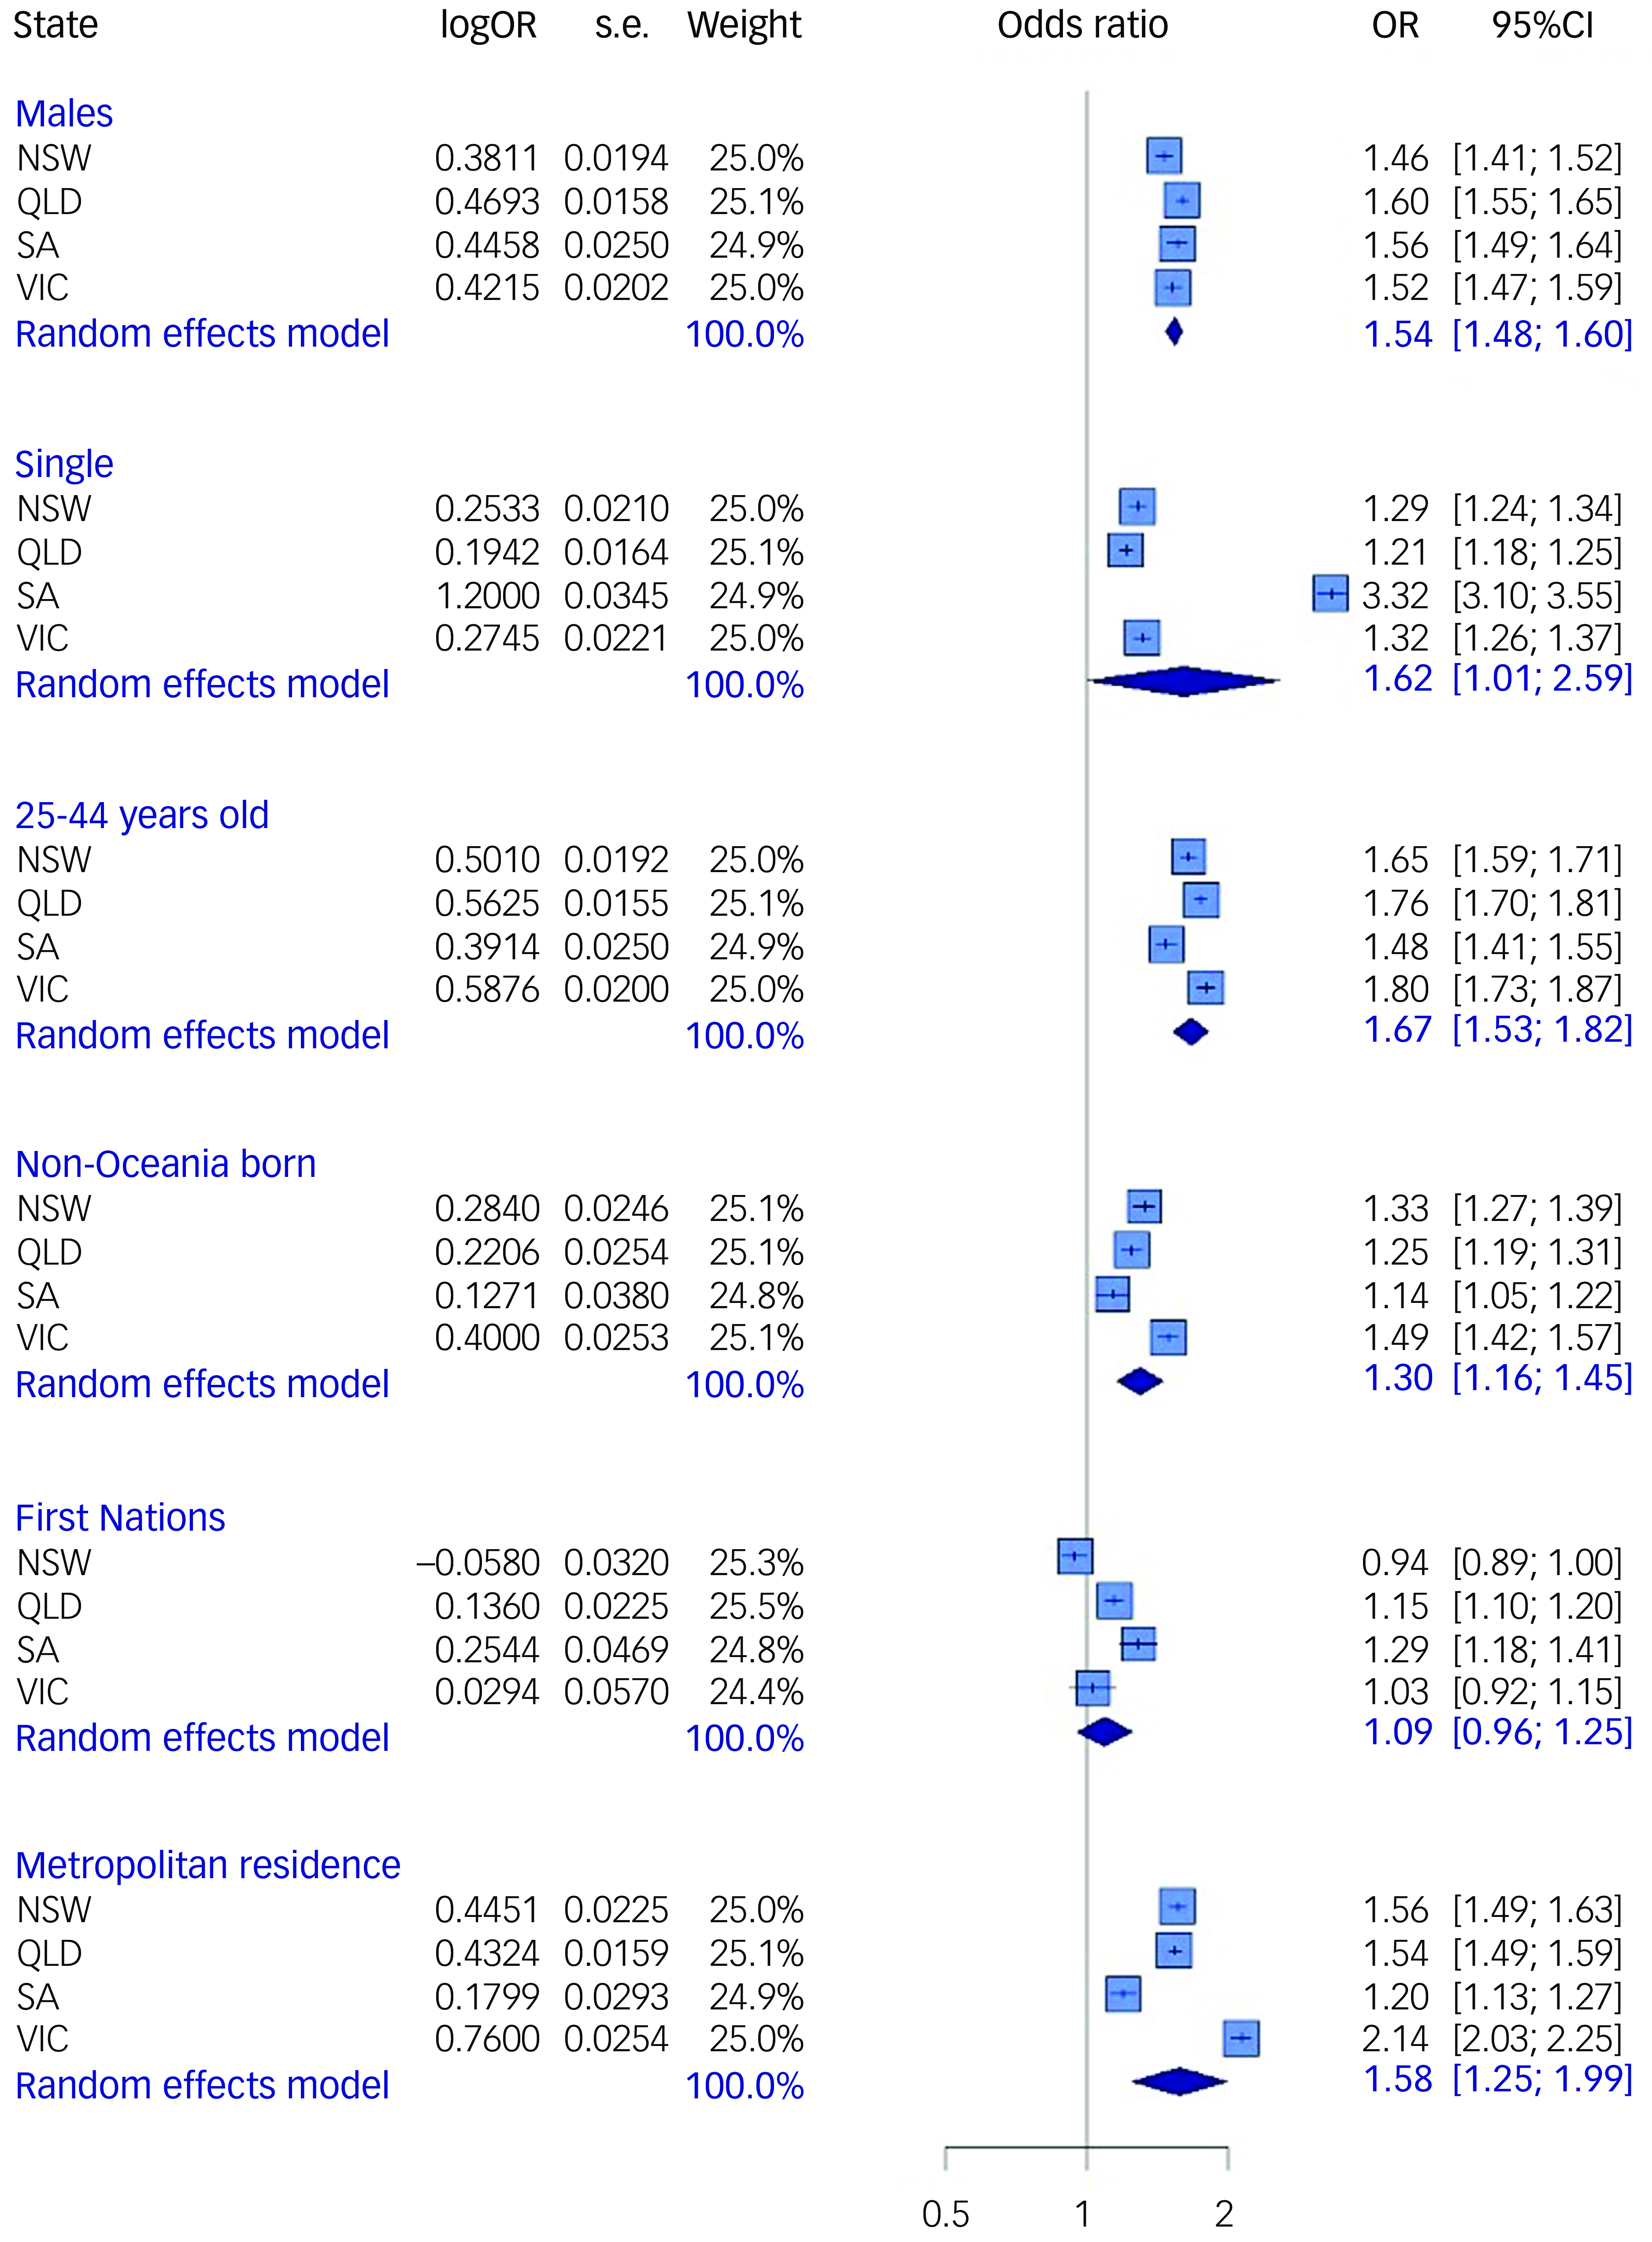
Fig. 4 Variables associated with compulsory community treatment by jurisdiction. NSW, New South Wales; QLD, Queensland; SA, South Australia; VIC, Victoria; OR, odds ratio.
Discussion
To our knowledge, this is the first study to report on the use of CCT and associated sociodemographic variables in a standardised way across four Australian jurisdictions. This represents nearly 85% of the nation’s population. It is also the first study to report data from South Australia, as previous studies have been confined to Queensland, NSW, Victoria or Western Australia. Reference Kisely, McMahon and Siskind9 In addition, while previous work has focused on differences at the jurisdiction level, we were able to investigate variations in CCT use within the same jurisdiction. Reference Light1 There was a six-fold variation between health districts with the lowest and highest levels of CCT use in NSW and South Australia, while in Victoria it was by an order of four. Even in Queensland, where there was the least variation, the proportion of MHS attendees on CCT in the health district with the highest use was double that in the lowest. Similar variations in the use of CCT within the same jurisdiction and legislative framework have been reported in New Zealand, England and Norway. Reference O’Brien4–Reference Riley, Sharashova and Rugkåsa8 This is clinically relevant given evidence from Australia and Norway that lower levels of CTO use are not associated with adverse patient outcomes. Reference Kisely, McMahon and Siskind9,Reference Nyttingnes, Benth, Hofstad and Rugkåsa13 Thus, the current study adds new insights to a growing body of literature on CCT use.
In this study, we explored sociodemographic factors that may be associated with CCT use across jurisdictions. Broadly, people attending MHSs who were male, single and aged between 25 and 44 years old were significantly more likely to be subject to CCT (Fig. 4), as were people living in a metropolitan area. This is similar to findings of other work using different methods both in Australia and overseas. Reference Lees, Newton-Howes, Frampton and Beaglehole5–Reference Kisely, McMahon and Siskind9 Similarly, CCT use was more common in MHS attendees born outside the Oceania region (primarily Australia and New Zealand). Although this includes people born in countries such as the UK and Ireland, non-Oceania born also covers communities from Europe, Africa, Asia and the Americas. Our results are therefore consistent with previous findings of culturally and linguistically diverse populations being more likely to be treated on an involuntary basis, possibly because of limited access to culturally appropriate services, language barriers, perceived discrimination or social isolation. Reference Kisely, McMahon and Siskind9,Reference Moss, Wyder, Braddock, Arroyo and Kisely10 Indeed, our results are likely to be an underestimation of the true effect given that not all individuals born outside Oceania could be classed as culturally diverse.
By contrast, First Nations Australians in contact with MHSs were no more likely to be subject to CCT in the overall analysis, although they were over-represented in South Australia and Queensland. This reflects other work that found First Nations people in Victoria and Western Australia were not more likely to be subject to CCT, while Queensland residents were. Reference Kisely and Xiao14 However, this is in contrast to New Zealand, where CCT rates for people from a Māori background were more than three times those of the general population. Reference Lees, Newton-Howes, Frampton and Beaglehole5 Explanations might include differences in the geographical distribution of First Nations people, greater cultural sensitivity or, conversely, the limited availability of appropriate services to actually administer CCT in very regional and remote areas. Reference Kisely, Xiao and Jian15
Limitations
This was a study of administrative health data, which may be subject to recording bias and lack information on social disability and forensic history, as well as social determinants such as homelessness, family supports, income/poverty factors or substance use. We also used birthplaces outside of Oceania as a proxy indicator for being born outside of Australia or New Zealand. This classification includes very disparate countries but, as noted previously, such a definition would probably have led to underestimates of the true effect. Despite obtaining data on mental illness diagnoses from the AIHW, we were unable to include this in the analysis because of significant missing data. Information on First Nations people should be interpreted with caution given variations in the quality of data on the identification of First Nations people across Australia. 16 Similarly, the quality of the data’s legal status is unknown and should also be treated with caution. 16 In addition, it is also possible that individuals who attended more than one service in a year could have been double counted.
Although this study uses a standard method across four jurisdictions, reporting of legal status to the AIHW differs from reporting of treatment orders in the community by state Chief Psychiatrists because of variations in method, statistical unit, collection scope and jurisdictional data systems. 16 For instance, our definition of CCT includes people on involuntary treatment other than clinician-ordered CTOs such as forensic orders. However, these are comparatively rare when compared to CTOs, which constitute the vast majority of CCT.3,10,16 Furthermore, in the case of Victoria, we were able to exclude people who were attending Forensicare (the Victorian Institute of Forensic Mental Health), which is the statewide specialist provider of forensic MHSs, including those in the community. 18 Finally, this study was restricted to descriptive and bivariate analyses of aggregate data. It was therefore impossible to address the strength of any association with CCT while adjusting for other covariates. For instance, it is possible that the lack of a significant association between CCT placement and Indigenous status is because First Nations people in some states were more likely to live in non-metropolitan areas where CCT is less common. These questions can only be more definitely answered using multivariate analyses of individual-level data.
Further research is needed to understand the variation in CCT use both between and within jurisdictions. At the broad jurisdictional level, these include the effect of human rights instruments and variations in legislation. Within a jurisdiction this might reflect differences in the implementation of recovery-oriented policies, socioeconomic characteristics, clinical acuity, including comorbid substance use, health service provision (both in-patient beds and in the community), clinician attitudes and peer or service culture.6,7,18,19 There is also qualitative evidence that inadequate resourcing of MHSs may be associated with increasing CCT rates. Reference Light, Robertson and Boyce21 For instance, factors such as wait-times, training, patient–staff ratios and professional skill mix are important determinants in the overall quality of care that is delivered in MHSs. Reference Kilbourne, Beck, Spaeth-Rublee, Ramanuj, O’Brien, Tomoyasu and Pincus22,Reference Boden, Smith, Klocek and Trafton23 We therefore plan to identify if differences in justifications for CCT are related to variations in laws, policy, system funding and/or organisational culture. This has important implications for human rights, as unexplained variations in its use may indicate arbitrary or discriminatory practices that violate the rights to personal liberty, fair treatment and informed consent. Reference Churchill, Owen, Singh and Hotopf24
Over ten years ago, Light et al Reference Light, Kerridge, Ryan and Robertson25 drew attention to the ‘invisibility’ of CCT and the lack of clarity concerning its use in health policy and clinical practice. This remains true despite law reform with an explicit intention to reduce the use of CCT, raising questions about transparency and accountability and whether this ‘invisibility’ leads to further marginalisation and discrimination. Reference Vine and Judd26 These concerns extend to other types of coercive interventions, such as seclusion and restraint, where there are similar variations between and within jurisdictions that cannot solely be explained by clinical acuity. Reference Newton-Howes, Savage, Arnold, Hasegawa, Staggs and Kisely27,Reference Savage, Lepping and Newton-Howes28
In conclusion, there are marked variations in the use of CCT both within and between Australian jurisdictions. It is unclear how much of this variation is determined by clinical need. These findings may also be of relevance to jurisdictions with similar clinician-initiated orders, such as England, Scotland or Canada.
Data availability
Data availability is not applicable to this article as no new data were created or analysed in this study.
Author contribution
S.K. had the original idea for the paper and applied for data access. S.K. and C.B. performed the analysis. S.K. wrote the first draft, which was then revised critically for important intellectual content by all other authors. All authors were involved in applying for funding, project administration and design.
Funding
This project was funded by an Australian Research Council Discovery Project (DP230100967). C.B. was also supported by a National Health and Medical Research Council (NHMRC) Special Initiative in Mental Health Grant (GNT2002047).
Declaration of interests
S.K. is a member of the international editorial board of BJPsych, BJPsych Open and BJPsych International. However, S.K. did not take part in the review or decision-making process of this submission to BJPsych Open. The authors declare no other potential conflicts of interest with respect to the research, authorship and/or publication of this article.


 Open access
eLetters
No eLetters have been published for this article.