Introduction
Snow-cover models are used in many applications in today’s snow and ice research. Physically based models allow the evolution of the internal structure of the snow cover to be followed very closely. Verification work on flat sites as well as on slopes (Reference Fierz and GauerFierz and Gauer, 1998) has shown the great potential of these models, some of which are already used operationally by avalanche warning services (Reference Brun, David, Sudul and BrunotBrun and others, 1992; Reference Lehning, Bartelt, Brown, Russi, Stockli and ZimmerliLehning and others, 1999).
One important aspect of snow-cover models is the accurate modelling of snow metamorphism. Indeed, a detailed description of layer texture, i.e. the inter-granular relationship (Reference ColbeckGolbeck and others, 1990), is crucial to many applications in snow science (e.g. snowdrift (Reference Lehning, Doorschot and BarteltLehning and Doorschot, 2000) or electromagnetic properties (Reference Wiesmann, Fierz and MatzlerWiesmann and others, 2000)). Snow-cover modelling thus requires a good description of metamorphic processes. However, only a few physically based models include simulation of texture-related parameters, either parameterizing grain shape (Reference Brun, David, Sudul and BrunotBrun and others, 1992) or including microstructure parameters (Reference Lehning, Bartelt, Brown, Russi, Stockli and ZimmerliLehning and others, 1999). Whereas the overall structure of the snow cover can be well reproduced and assessed over as long a period as one winter, the description of layer texture still needs further investigation (Reference FierzFierz, 1998).
Furthermore, avalanche formation (e.g. Reference Birkeland, Johnson and SchmidtBirkeland and others, 1998) as well as snow-atmosphere interactions and thereby the feedback between snow cover and climate (albedo) are quite sensitive to the texture at and near the snowpack’s surface. Here snow metamorphism is predominantly governed by varying but large temperature gradients (kinetic growth), resulting in layer textures as shown in Figure 1. However, although there are many studies on near-surface kinetic growth of snow crystals (e.g. Reference Fukuzawa and AkitayaFukuzawa and Akitaya, 1993; Reference FierzFierz, 1998), quantification from field measurements alone is difficult.

Fig. 1. Subsurface depth-hoar formation on a northeasterly slope. Note the column-like growth perpendicular to the slope and the thin but denser layer at the snow surface.
On the other hand, we need objective tools to measure texture-related parameters to enable us to verify quantitatively model outputs. Such a tool has been proposed by Reference Lesaffre, Pougatch and MartinLesaffre and others (1998). We must also link objective measurements to the pragmatic techniques used in the field, as most valuable verification material is provided by field observations. In this paper we present new results on the quantification of texture-related parameters, based on the analysis of both cold-laboratory experiments and field observations on snow subjected to temperature gradients in the range 30–350 K m–1. Problems related to verification work will also be addressed.
Experimental Settings
Gold laboratory
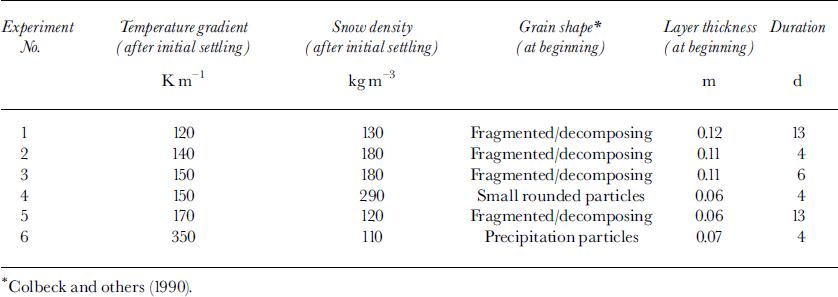
Snow collected from most recent snowfalls was sieved into a well-insulated box with a temperature-controlled heater at the bottom (Fig. 2) (Reference PielmeierPielmeier, 1998). The heat was homogeneously distributed over the bottom’s surface using heating elements capped by a stack plate made of aluminium and plastic plates. The surface temperature was controlled by the air temperature in the cold laboratory. Relative humidity was quite constant and of the order of 70–80%. The initial intensity of the temperature gradient was set by adjusting surface and bottom temperatures as well as the snow layer’s thickness, but aiming at a temperature around –10°C in the middle of the sieved snow layer. Temperatures at the bottom, in the middle of the layer and at the snow surface were monitored using type K thermocouples (Figs 2 and 3). Samples for measurement and analysis were taken periodically from the middle of the snow layer. Six experiments were performed, as summarized in Table 1. In the following, however, we will concentrate on results for experiment 1.
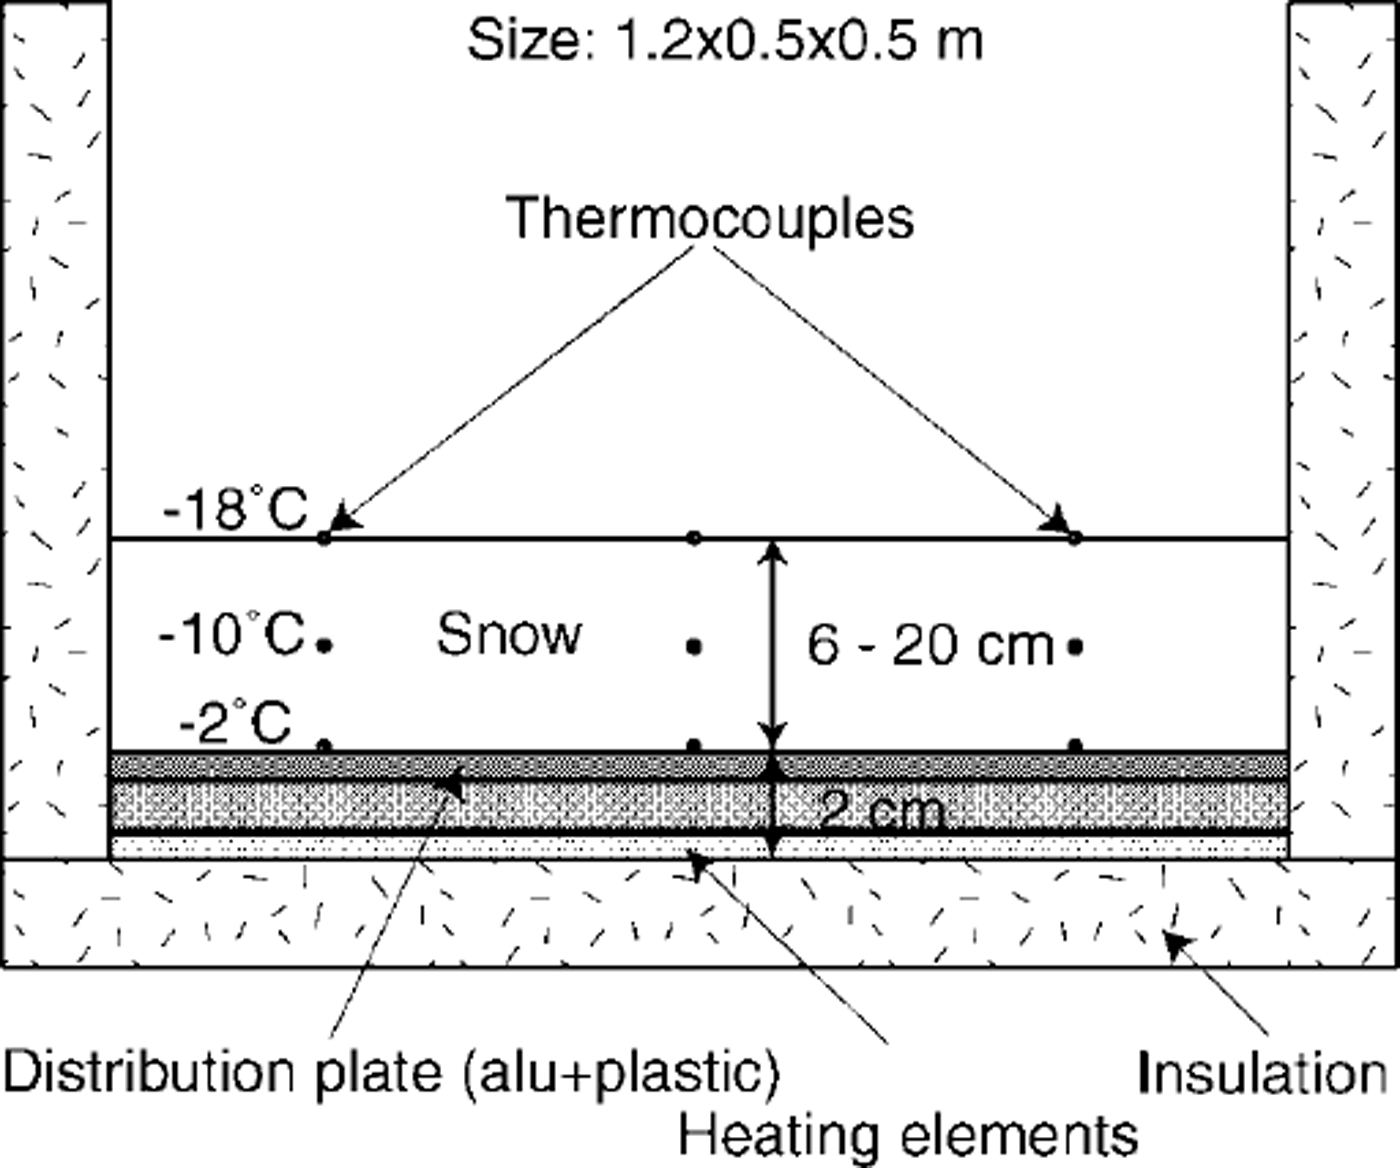
Fig. 2. Schematic drawing of the insulated box used in the cold laboratory for snow-metamorPhism experiments.
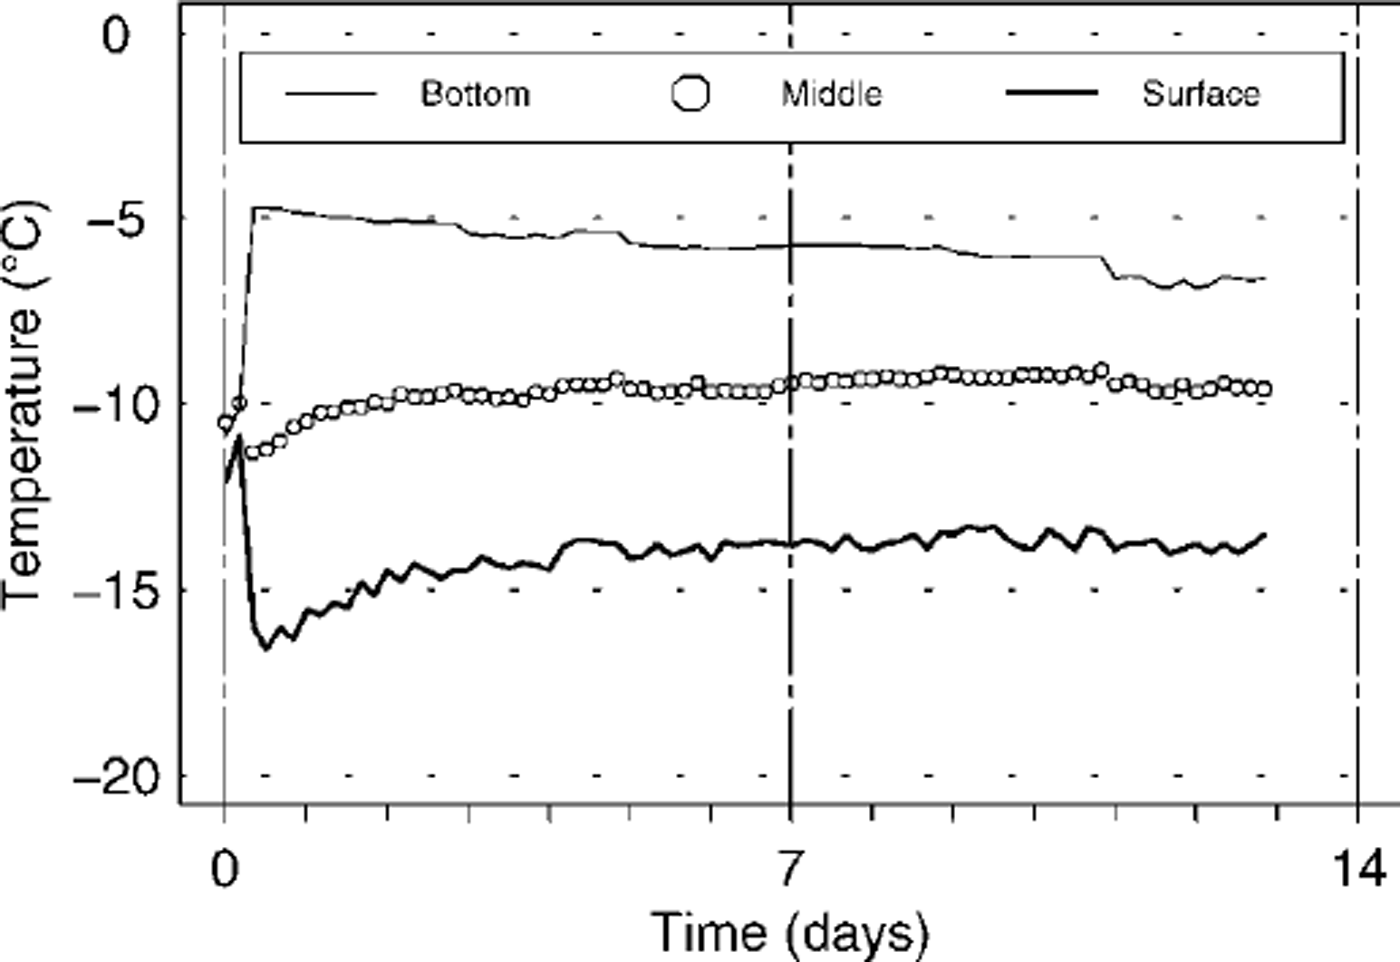
Fig. 3. Typical time dependence of the snow temperatures over the duration of a metamorphism experiment (experiment 1 in Table 1). Before applying the temperature gradient, the layer had a depth of 6cm and a temperature of–11˚C During the experiment, the mean temperature gradient over the layer amounted to 170 Km–1 6 After initial settling, snow density was120kg m–3 .
Table 1. Characteristics of the six experiments performed in the cold laboratory
Fieldwork
The fieldwork was carried out on the 30–34° steep, northwesterly and windward slope of Gaudergrat, a well-equipped test site of the Swiss Federal Institute for Snow and Avalanche Research (Reference GauerGauer, 1998). After a snowy period with strong winds, we followed the evolution of the topmost 30 cm of the snowpack over 14 days. The snow profile taken on 23 January 1998 shows the strong influence of wind on the snowpack structure during the previous snowfalls, as very dense, wind-hardened layers alternate with softer and less dense ones (Fig. 4). From our observations the previous day, we may also infer that wind caused the density in the topmost 2 cm to increase by a factor of at least 2, as well as the formation of a very thin, crust-like layer at the surface. No more new snow was deposited on the slope during the observation period of mostly clear weather and calm winds. We note that the temperature both at the surface and 30 cm below it were quite constant after 27 January 1998, resulting in a bulk temperature gradient of the order of 30 K nT1 over at least 9 days (Fig. 5). No direct solar radiation affected the sun-shaded slope, and the diffuse incoming shortwave radiation recorded on the slope amounted to about 100 W nT2 at midday.
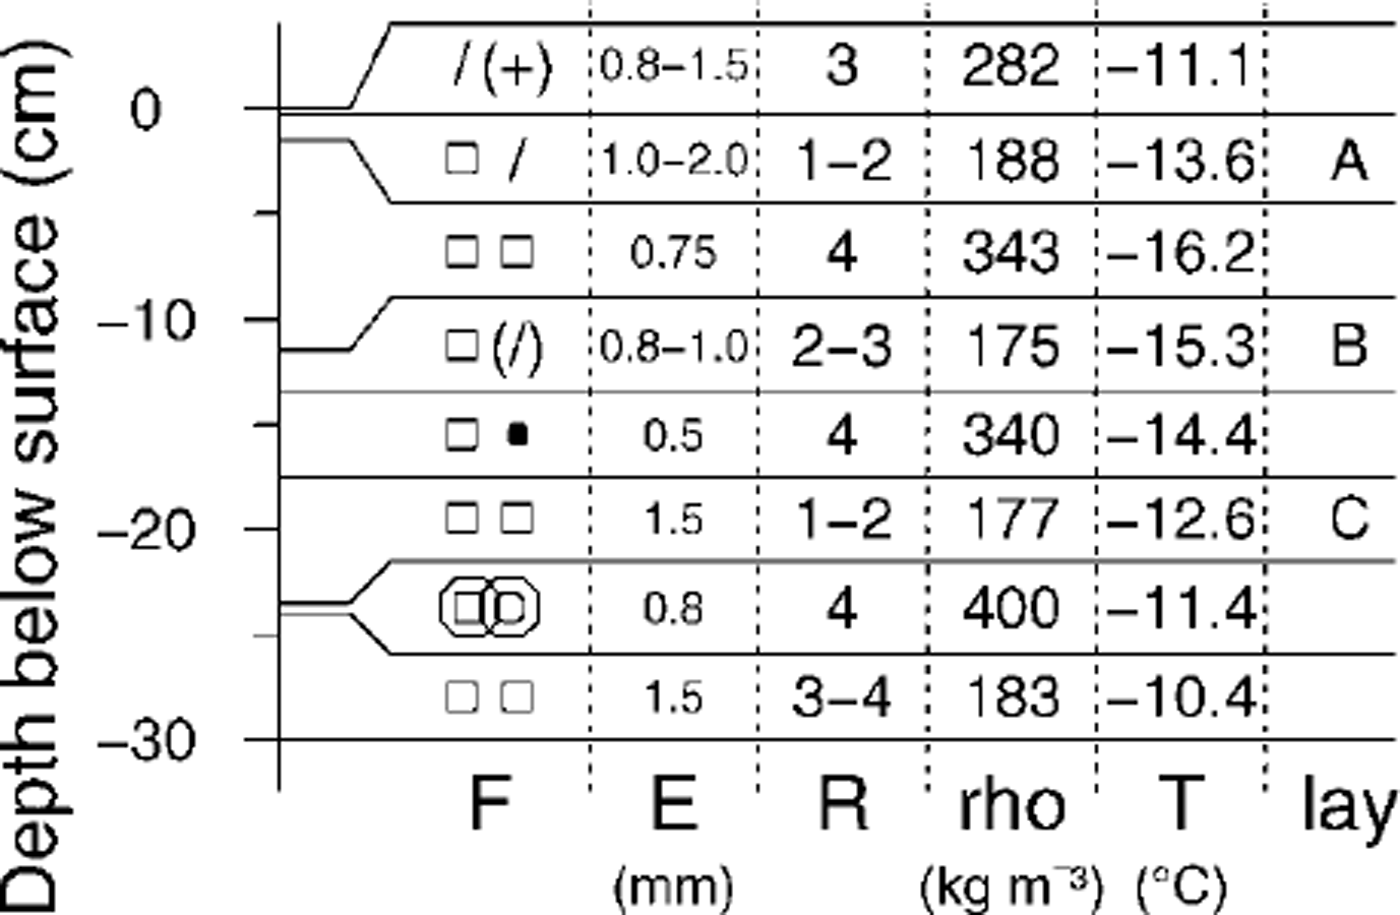
Fig. 4. Pit profile of the topmost 30 cm taken on 23 January 1998. F is grain shape, E is grain-size in mm, R is hand hardness, rho is density in kg m–3 and Tis temperature in the middle of the layer (°C). The layer at-23 cm is a thin melt-freeze layer. Total snow depth was about 135cm.
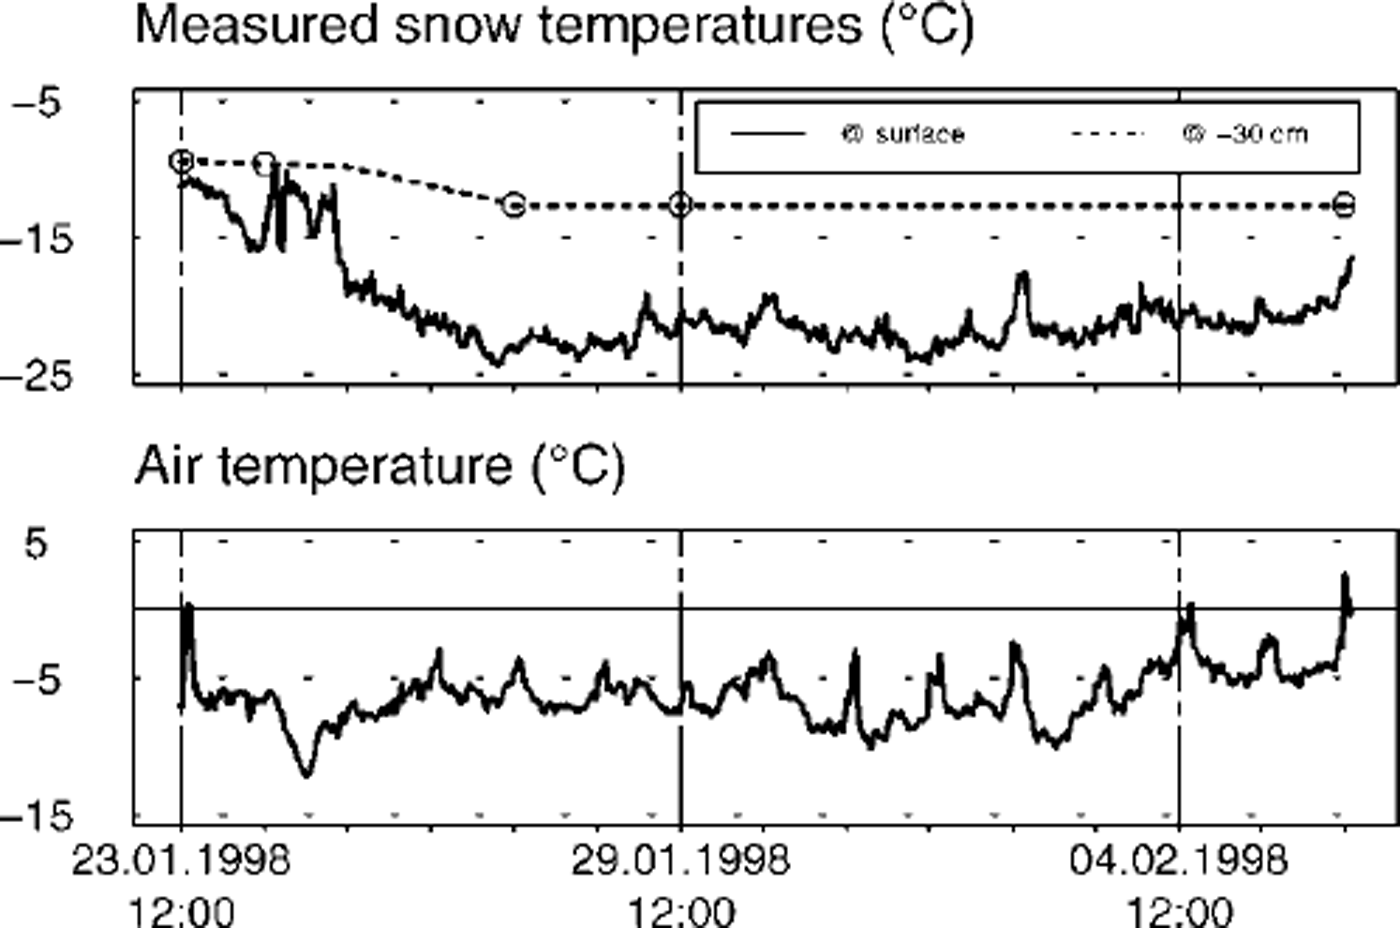
Fig. 5. Nivo-meteorologicalparameters measured half-hourly by an automatic weather station at the Gaudergrat site. The station is located on the northwesterly slope, near the location of the pit profiles.
Methods
Gold laboratory and field
Besides snow temperatures, measurements in the cold laboratory included snow density, grain-size by sieving as well as grain-size and grain shape by visual characterization (Reference ColbeckColbeck and others, 1990). Further, snow samples were prepared for serial section analysis, and digitized pictures of disaggregated snow samples were analyzed using an image-processing system. For the latter analysis, on the order of 30–100 grains or objects are processed. In the field, in addition to the usual pit-profile measurements (see Fig. 4), we collected disaggregated snow samples, conserving them in sub-freezing iso-octane for subsequent image analysis in the cold laboratory (Reference Brun and PahautBrun and Pahaut, 1991).
Image analysis
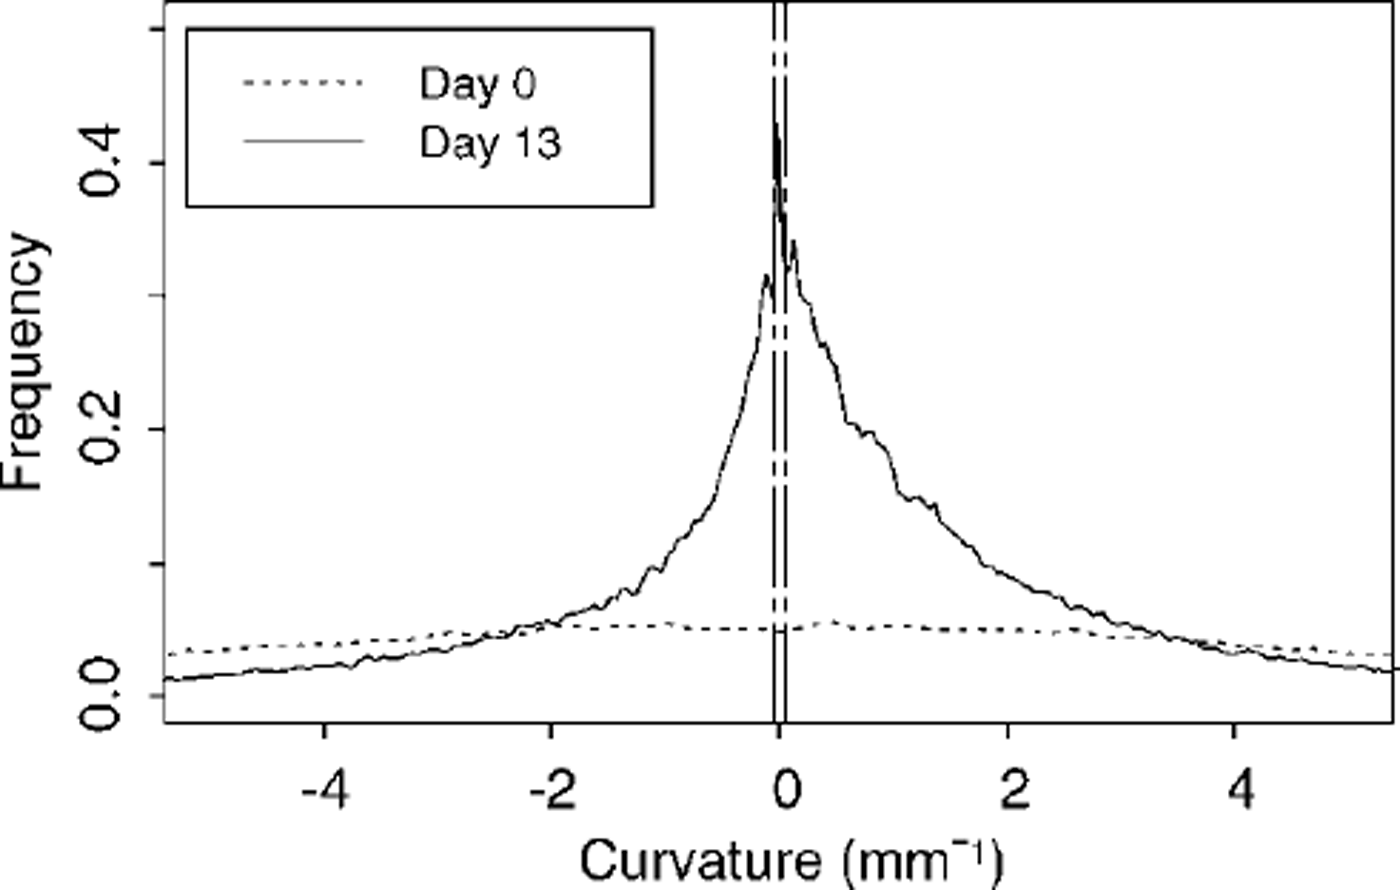
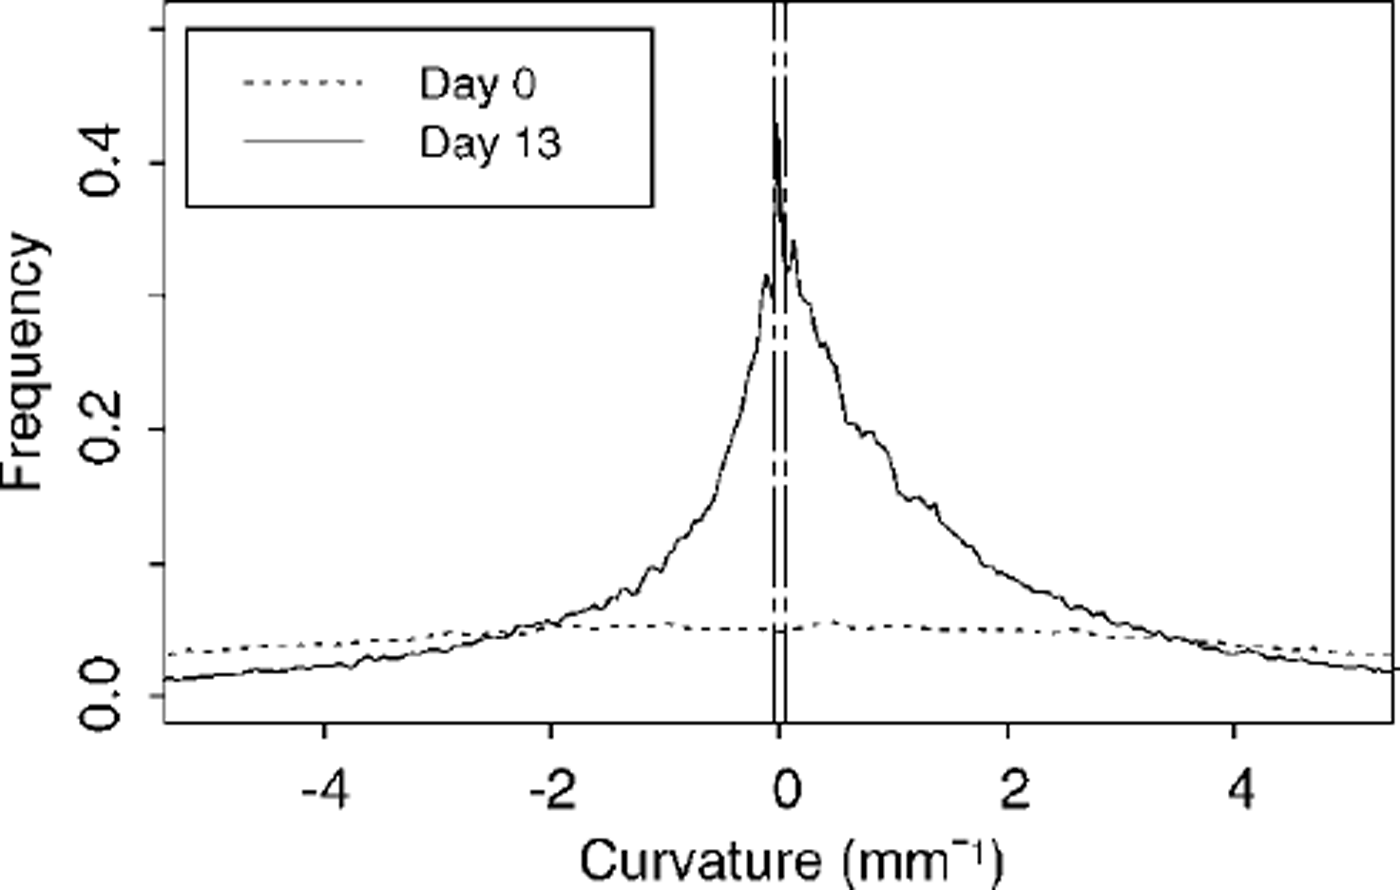
Reference Lesaffre, Pougatch and MartinLesaffre and others (1998) describe in detail a way of objectively characterizing disaggregated snow samples by means of image analysis. Apart from geometrical parameters obtained routinely from image-processing software, the method requires calculation of the curvature in each pixel of the extracted grains contours. Thus, in addition to an independent and objective determination of grain-size, we may obtain information on shape-related parameters such as dendricity and sphericity (Reference Brun, David, Sudul and BrunotBrun and others, 1992). Dendricity tells us to what extent the snow may be described as consisting of new snow, fragmented or decomposing particles. It varies from 1 for new snow to 0 for snow with no recognizable precipitation particles. Sphericity, on the other hand, describes how far snow grains are either faceted (e.g. depth hoar) or rounded (small grains and wet grains), ranging from 1 for fully rounded to 0 for fully faceted grains. In the framework of Reference Lesaffre, Pougatch and MartinLesaffre and others, (1998), sphericity does not cover the full range of variation of its underlying calculated parameter, namely, the standard deviation of positive curvature divided by the mean positive curvature taken over all pixels of a grain contour, SDC/mean. For comparison purposes, however, we will use SDC/mean as well, especially when dealing with a parameter we termed ˚zero curvature". Zero curvature represents the percentage of contour pixels in which the absolute curvature is ω0.05 (Fig. 6), in other words the percentage of straight portions on the grain’s contour. Typically, zero curvature will be of the order of 4% for depth hoar but ≤ 1 % for already rounded, decomposing particles (Fig. 6).
Simulation
To simulate the snow-cover evolution both in the cold laboratory and in the field, we use the newly developed Swiss model SNOWPACK (Reference Lehning, Bartelt, Brown, Russi, Stockli and ZimmerliLehning and others, 1999). In addition to microstructure parameters such as bond size and co-ordination number, the model simulates the evolution of shape-related parameters using the empirical formulation for changes in dendricity and sphericity introduced by Reference Brun, David, Sudul and BrunotBrun and others, (1992). For temperature gradients of >Ki k m–1 , the rate of change per day is the same for both dendricity and sphericity, namely,

where T is snow temperature in K and ΔT is temperature gradient in K nT1. It is also important to note that, as long as dendricity is larger than zero, grain-size is set arbitrarily to 0.4 mm and grains are not allowed to grow. Grain growth is governed by the water-vapour flux resulting from the temperature gradient (Reference BaunachBaunach, 1999; Reference SatyawaliSatyawali, 2000).
Initial profiles were deduced either from measurements taken in the cold laboratory at the beginning of an experiment or from a pit profile taken in the field (Fig. 4). Using the coarse classification of grain types given by Reference Brun, David, Sudul and BrunotBrun and others (1992) in terms of dendricity and sphericity, shape parameters and grain-size were thereby inferred from visual characterizations of the grains. Simulations were run using Dirichlet boundary conditions, i.e. prescribing both the surface temperature and the temperature either at the bottom (laboratory; Fig. 3) or at –30 cm depth (field; Fig. 5). For the field run, shortwave radiation had to be taken into account as well, because it represents a source term to the energy balance within the snow cover.
To verify model outputs relating to grain shape, we will rely mainly on the objectively determined parameters described above.
Results and Discussion
Table 2 shows selected results for grain-shape parameters as well as grain-size as obtained by image processing. Corresponding sample pictures of the disaggregated snow analyzed at the beginning and the end of either an experiment or observation period are shown in Figure 7. We first note that the dendricity calculated according to Reference Lesaffre, Pougatch and MartinLesaffre and others (1998) does not reach zero for any of these samples, even though the snow was subjected to temperature gradients of ≥ 30 K nT1 for about 2 weeks! However, Reference Lesaffre, Pougatch and MartinLesaffre and others (1998) state that this parameter depends on how well single grains are separated from each other. This problem of grain arrangement may be aggravated by the development of depth hoar into columns of grains that do not readily separate (see Fig. 1). In our experience, preparation of disaggregated snow samples is bound to encounter these problems. Therefore, in spite of its simple geometrical interpretation, dendricity evaluated this way will depend on sample preparation and might be quite misleading. By contrast, the mean positive curvature taken over all pixels of the grains’ contours is almost insensitive to grain arrangement, providing a sound basis to the calculation of sphericity.

Fig. 7. Disaggregated snow grains at the beginning (left) and the end (right) of either an experiment in the cold laboratory or the observation period in the field. All pictures are on the same scale (10 mm × 10 mm), and legends refer to either Table 1 or Figure 4. For corresponding calculated parameters, see Table 2.
Table 2. Calculated and observed grain-shape and grain-size parameters
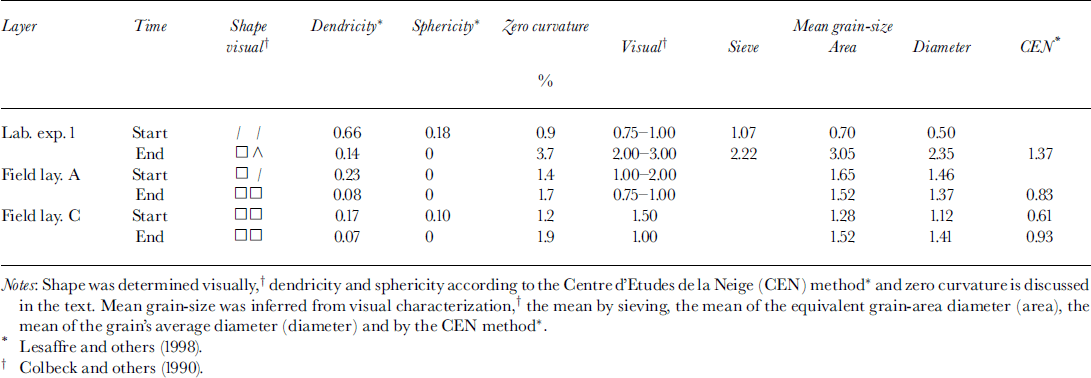
Regarding grain-size, the mean obtained by sieving agrees quite well with those inferred from area or diameter measurements. While the latter finding is not surprising in view of past work in sedimentology (Reference Baba and KomarBaba and Komar, 1981), we note also a close agreement with the visual estimation of grain-size, and thus with the field method. Indeed, we observe a tendency of fieldworkers to give a lower limit on grain-size that matches quite well values that are objectively measured by either sieving or image analysis (Table 2). This consistency is useful for further verification work as we may now have confidence in using results obtained by various methods. Indeed, for verification work we often have to deal with pit-profile information without being able to analyze preserved snow samples. Finally, we note that the method of Reference Lesaffre, Pougatch and MartinLesaffre and others (1998) persistently underestimates grain-size compared to both other calculated values and the visual estimates.
Besides using ˚robust" parameters to describe shape and size, we should also know their dependence on various factors governing snow-cover evolution in order to improve snowpack modelling. The strength of the temperature gradient is such a factor, especially for four near-surface processes (Reference Fukuzawa and AkitayaFukuzawa and Akitaya, 1993; Reference FierzFierz, 1998). For gradients around 40–50 Km–1, our knowledge may be sufficient for satisfactory simulation of shape and size evolution. This may be seen in Figure 8, which summarizes the results of the simulation run for the field. As the gradient is of the same order of magnitude both at the surface and 30 cm below it, the parameters for layers A and C behave quite similarly. This may be attributed principally to temperatures below –15°C in both layers.
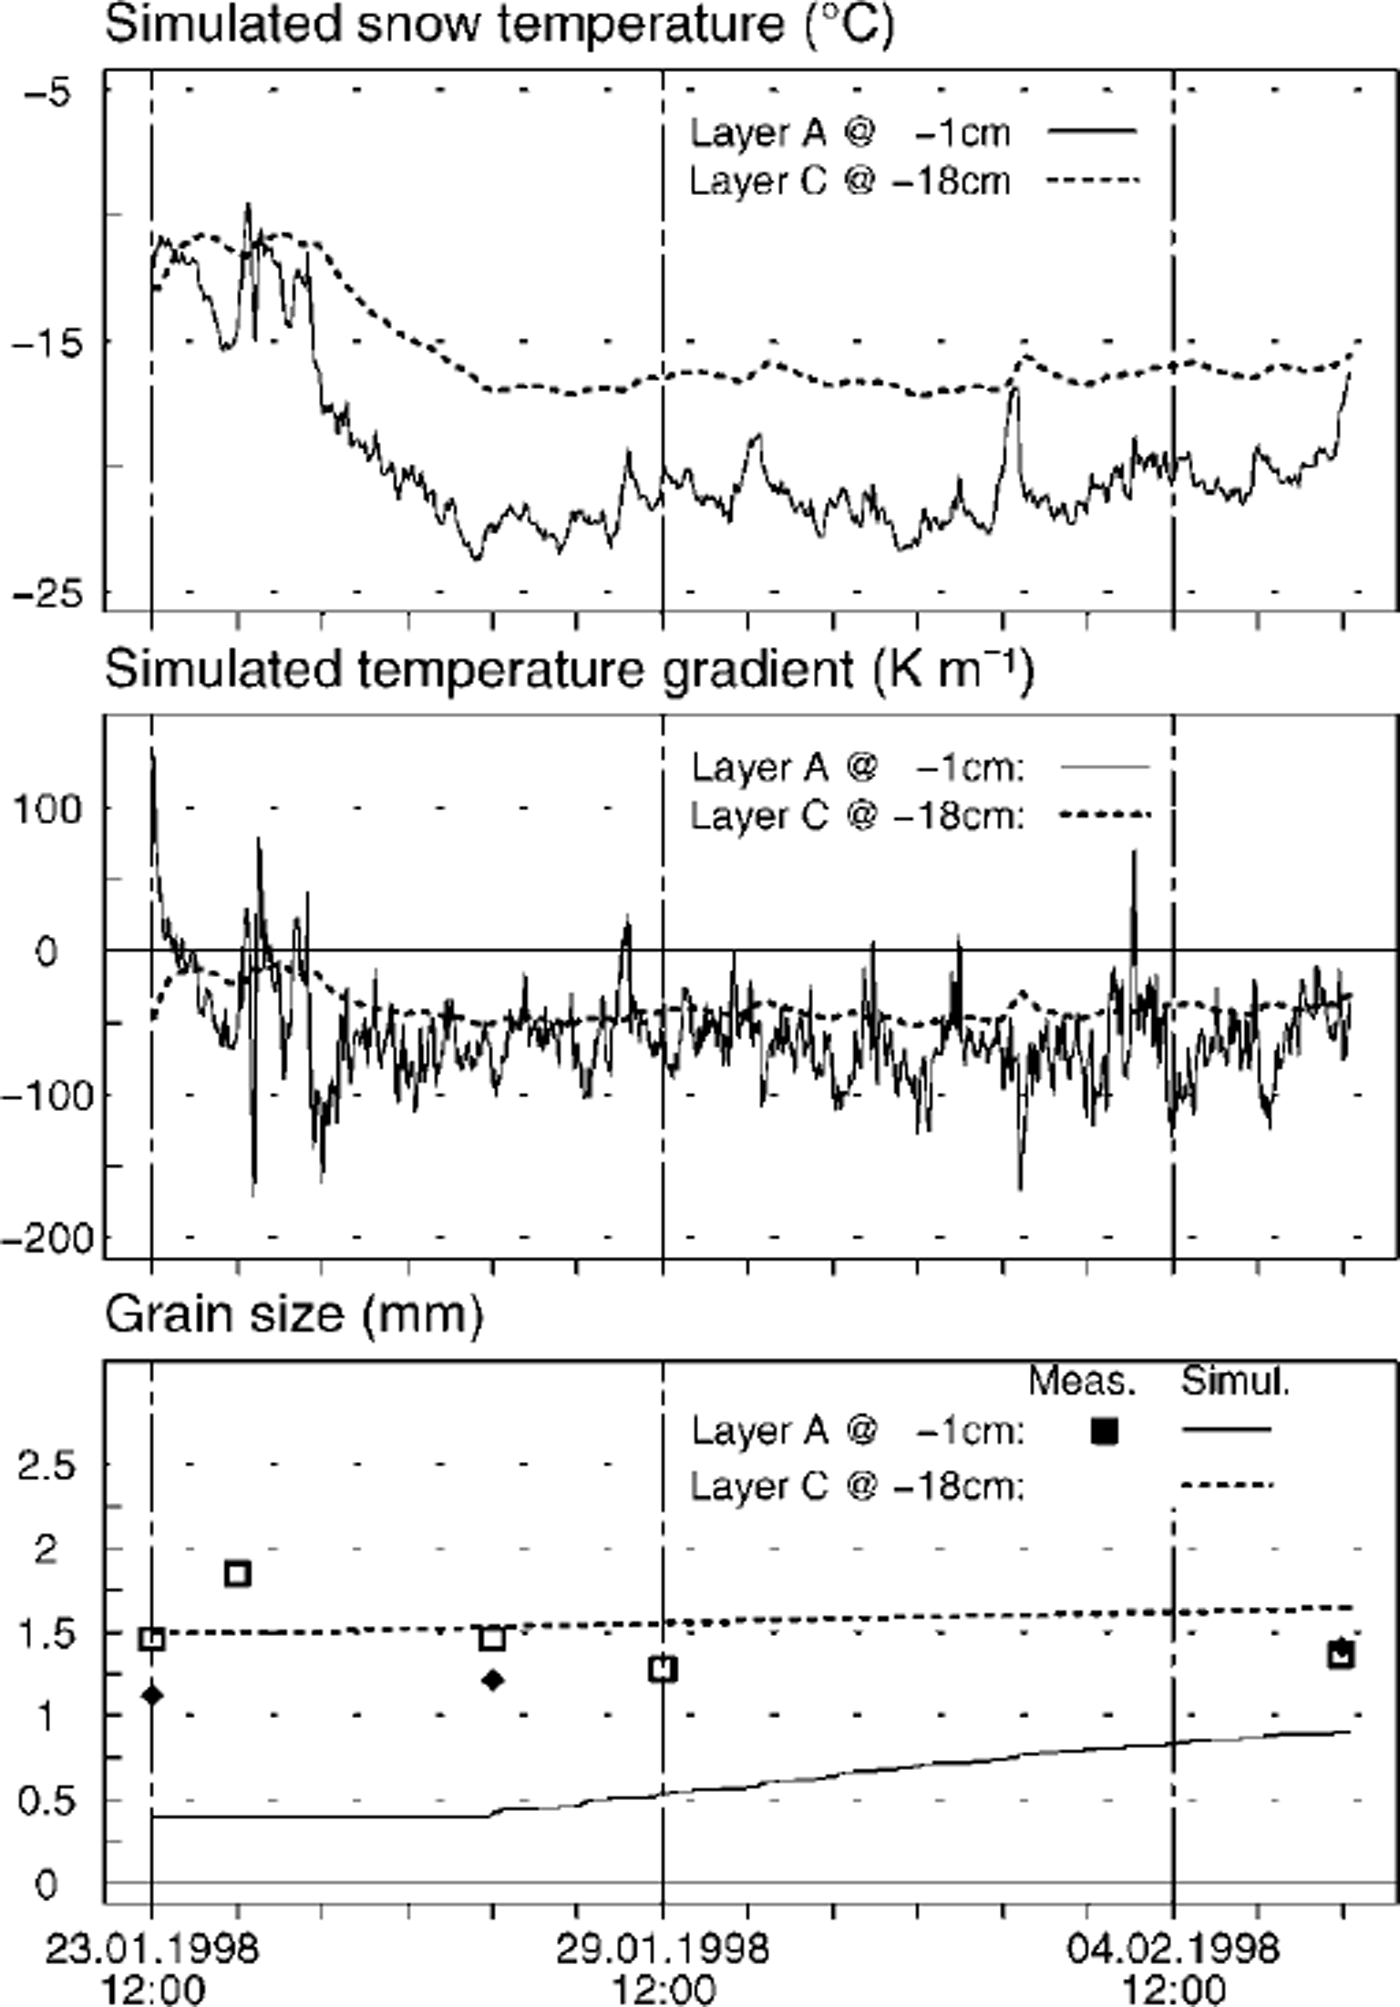
Fig. 8. Simulation results for the field case-study. The layer labelling refers to Figure 4. Note that simulated grain-sizes (bottom) are compared to values measured by image analysis (symbols).
Dendricity and sphericity of layer A being equal but nonzero at the beginning of the run, they both decrease at the same rate (see Equation (1)). Only once dendricity reaches zero are the grains of layer A allowed to grow, starting at the arbitrarily set size of 0.4 mm. Thus, for layer A, only the trend of the simulated grain-size may be compared to the values obtained from image analysis. In layer C, by contrast, there is good agreement between measurements and simulation. It is also noteworthy that both studied layers are topped by denser, crust-like layers that may act as a barrier to vapour transport, providing a plentiful supply of water vapour. Nevertheless, not much growing is observed, probably because temperature is quite low and the recrystallization process has already slowed down markedly.
Figure 9 shows both dendricity and sphericity for laboratory experiment 1 (gradient 120Km–1; density 120 kgnT3; duration 13 days). The initial values for the simulation were estimated from our visual characterization and the coarse classification in terms of dendricity and sphericity according to Reference Brun, David, Sudul and BrunotBrun and others (1992). The large discrepancy between these values and the objectively determined parameters indicates that verification of simulated shape parameters will be more difficult than for grain-size. Furthermore, the large difference in values for both measured parameters is inconsistent with the scheme proposed by Reference Brun, David, Sudul and BrunotBrun and others (1992). On the other hand, it is quite obvious that the measured dendricity shows a large bias until the end of the experiment, even if we start with a value of 1 for the simulation. This may be due to grain-arrangement effects at the beginning and to chains of depth hoar that were not disaggregated at the end of the experiment. Therefore dendricity measured this way may not discriminate well enough between both new snow and fragmented particles, on the one hand, and well-faceted shape types, on the other hand. The idea of characterizing precipitation and fragmented particles with one dedicated parameter such as dendricity remains very appealing. However, for snow-cover modelling and its verification, a more reproducible parameter than dendricity is needed.
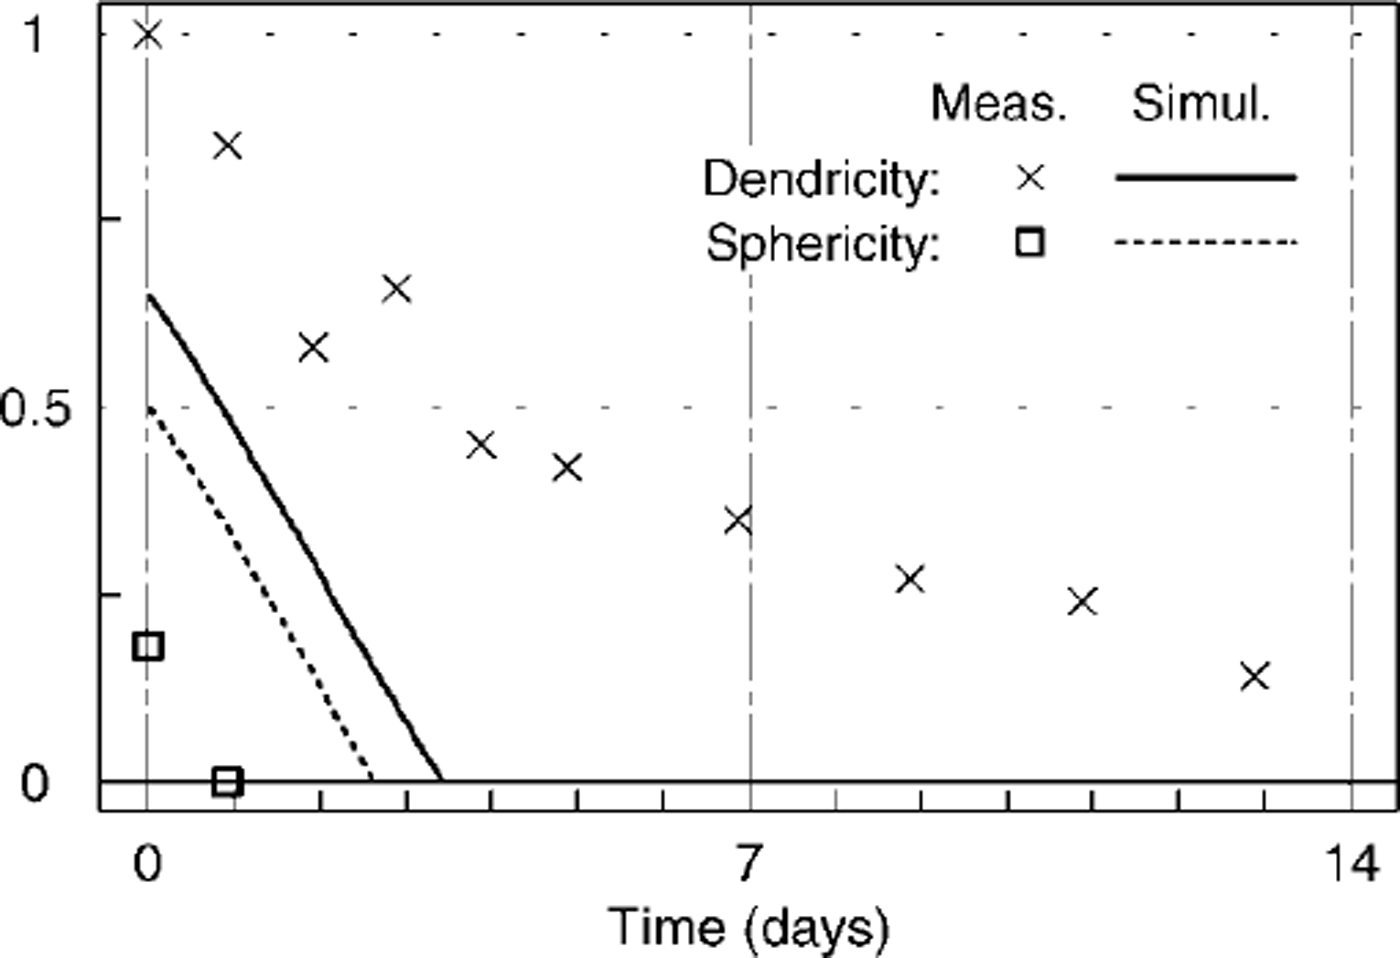
Fig. 9. Comparison of simulated grain-shape parameters with values inferred from image analysis. The simulation is for laboratory experiment 1 (see Table 1).
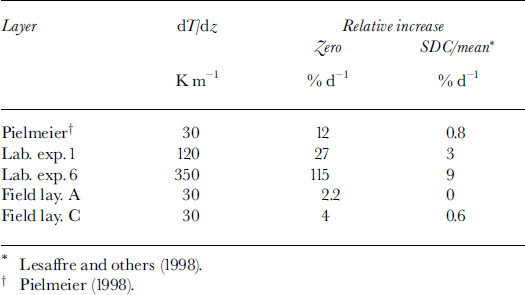
The initial discrepancy between measurement and subjective classification also makes it difficult to verify the behaviour of sphericity. However, from further visual characterizations we would fully support the suggestion that sphericity goes very rapidly to zero. This may again indicate that we need to refine the classification scheme relating observed grain shapes to their simulated parameters. Furthermore, once zero, sphericity does not reveal much about the possible evolution of grain shape or texture under sustained temperature gradients. Along these lines we looked more closely at the parameter underlying sphericity, namely SDC/mean. Unfortunately SDC/mean does not increase more than 9% d–1 for a temperature gradient of 350 Km"1 (see Table 3), which is about the magnitude of the error on its calculation. Zero curvature, however, which represents the percentage of contour pixels in which the absolute curvature is ω0.05, shows a strong dependence on temperature gradient, as we would expect for a parameter related to shape. Indeed, its rate of change increases from 12% dȡ1 to >100%dȡ1 as the gradient varies from 30 to 350 Km"1 (Fig. 10; Table 3). Zero curvature also differentiates quite well between depth hoar, faceted crystals and snow types with more or fully rounded grains (Fig. 10). The ability to discriminate between large depth-hoar grains and smaller faceted crystals may be due to the fact that zero curvature is intuitively related to grain-size: as crystals grow, the straight portions of the contours grow longer, whereas the number of corners remains almost constant. Thus the percentage of pixels in which curvature is zero increases with ongoing kinetic growth of the crystals.
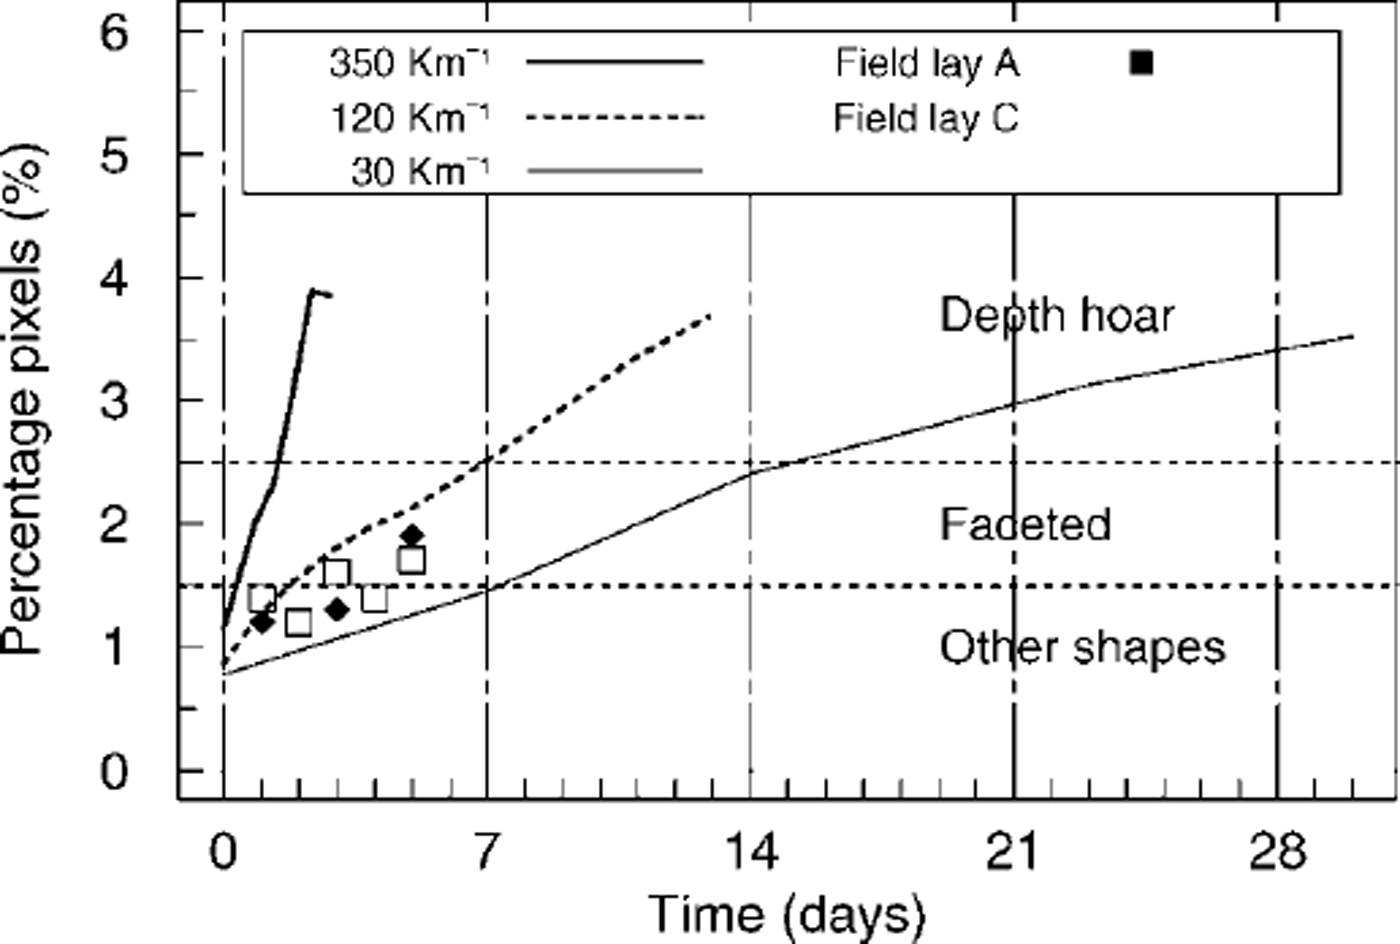
Fig. 10. Zero curvature, i.e. percentage of pixels in which the absolute curvature is ω0.05: dependence on applied temperature gradient. The possibility of differentiating among grain shapes is also shown. The experiment at 30 Km1 refers to the work by Reference PielmeierPielmeier (1998).
Table 3. Relative increase per day of zero curvature and SDC/ mean as a function of temperature gradient. Both parameters are related to sphericity
At this stage, it is too early for us to give a full account of this parameter that would enable it to be used in a snow model. But, being based on the calculation of curvature, it is ˚robust" regarding grain arrangement for image processing and we will study its behaviour further.
Conclusions
We measured grain shape and grain-size under strong temperature gradients both in the laboratory and in the field. Image processing of disaggregated snow samples allowed us to quantify our observations in an objective way. Thereby we confirmed that some parameters are quite dependent on grain arrangement.
Moreover, we started to look at a new parameter, zero curvature, that is quite insensitive to grain arrangement for image processing. Zero curvature shows a strong dependence on temperature gradient and is promising regarding differentiation among various grain shapes.
Verification of snow-cover simulations including grain-shape parameterization is difficult for various reasons. First, the objective determination of the parameters (e.g. dendricity) from disaggregated snow samples is problematic. Second, our scheme relating observed grain shape to its counterparts in snow-cover modelling must be refined. Third, we need to know more about the behaviour of these shape parameters under sustained and large gradients.
The results obtained so far and further experiments, however, should allow us to improve our understanding of snow metamorphism under large temperature gradients and thereby improve modelling of near-surface processes in the future.
Acknowledgements
The insulated box was designed by M. Schneebeli, whose help and suggestions while performing the experiments are gratefully acknowledged. We are also indebted to G. Krüsi, M. Hiller and R. Wetter who helped set up the experiment and acquire the necessary data. Many thanks also to S. Feuerlein and M. Christen who helped collect the field data, as well as to many of our colleagues for fruitful discussions. Finally, we wish to thank the reviewers for helpful comments.


