


1. Introduction
The emergence of collective motion in active matter, exemplified by phenomena like bird flocks and bacterial swarms, has attracted the attention of both physicists and biologists. Rooted in nematic interaction, one notable aspect of collective motion is the enhanced mobility that facilitates cell propagation and molecule diffusion. In one outstanding example named bacterial turbulence, the mobility of bacteria surges fivefold compared with solitary swimming (Sokolov et al. Reference Sokolov, Aranson, Kessler and Goldstein2007; Cisneros et al. Reference Cisneros, Kessler, Ganguly and Goldstein2011). Under collective motion, enhanced mobility is attributed to drag reduction within an active nematic (Dunkel et al. Reference Dunkel, Heidenreich, Drescher, Wensink, Bär and Goldstein2013; Giomi Reference Giomi2015; Guo et al. Reference Guo, Samanta, Peng, Xu and Cheng2018). In active turbulence, the formation of vortices is caused by the intrinsic instability of the active nematic under fluctuations such as density and mobility (Simha & Ramaswamy Reference Simha and Ramaswamy2002; Hatwalne et al. Reference Hatwalne, Ramaswamy, Rao and Simha2004; Saintillan & Shelley Reference Saintillan and Shelley2008; Koch & Subramanian Reference Koch and Subramanian2011). This raises a critical question: is drag reduction in an active nematic the only cause of enhanced mobility? If the enhanced mobility has alternative origins, does it stabilize large-scale nematics or increase instability that may be related to the onset of active turbulence?
Near-field hydrodynamic interactions can induce significant fluctuations in speed (Drescher et al. Reference Drescher, Dunkel, Cisneros, Ganguly and Goldstein2011; Liu, Breuer & Powers Reference Liu, Breuer and Powers2014; Yoshinaga & Liverpool Reference Yoshinaga and Liverpool2018; Vizsnyiczai et al. Reference Vizsnyiczai, Frangipane, Bianchi, Saglimbeni, Dell'Arciprete and Di Leonardo2020; Zhang et al. Reference Zhang, Leishangthem, Ding and Xu2021; Yin et al. Reference Yin, Yu, Tan, Cai, Chen, Lo and Guo2022), alongside long-range hydrodynamic interactions (Saintillan & Shelley Reference Saintillan and Shelley2008) and biological quorum sensing (Laganenka, Colin & Sourjik Reference Laganenka, Colin and Sourjik2016). A rotating helix translates faster in a confining tube (Liu et al. Reference Liu, Breuer and Powers2014). A bacterium moves faster when the flagella bundle is confined and the cell body is free, under elastic or solid confinement (Vizsnyiczai et al. Reference Vizsnyiczai, Frangipane, Bianchi, Saglimbeni, Dell'Arciprete and Di Leonardo2020; Yin et al. Reference Yin, Yu, Tan, Cai, Chen, Lo and Guo2022). Whether the same mechanism applies to a bacterium in a dense suspension demands further investigation.
Exploring the role of near-field hydrodynamics in active nematics demands experiments where the activity of particles can be precisely controlled (Peng, Liu & Cheng Reference Peng, Liu and Cheng2021). It would be particularly beneficial to regulate the relative activity of an individual swimmer compared with their peers, and to monitor the long-term behaviour of the individual swimmer and its surrounding flow. Capturing a long-time trajectory of a swimmer typically requires specialized equipment like a tracking microscope. However, a more convenient approach is to observe the rotational motion of an active rotor. To achieve these goals, forming an active rotor propelled by swimmers within an active suspension with adjustable activities would be useful.
Active rotors have been created (Di Leonardo et al. Reference Di Leonardo, Angelani, Arciprete, Ruocco, Iebba, Schippa, Conte, Mecarini, De Angelis and Di Fabrizio2010; Dewangan & Conrad Reference Dewangan and Conrad2019) and the rotating symmetry of these rotors is broken by either a ratchet shape or an interface-induced torque. We use a self-assembled two-dimensional (2-D) bacterial rotor at a water–air interface to study the effect of near-field hydrodynamics. The 2-D system allows us to detect the orientation of cells and flagella. By mixing the rotor with 2-D bacterial suspensions of different activities, we examine the rotor's rotation and investigate possible interactions between the rotor and free bacteria. We observe a nonlinear increase of the rotor's angular velocity with increasing density of free bacteria, and this increase is independent of the activity of the free bacteria. Simulations reveal that this acceleration can be explained by near-field hydrodynamic interactions – a mechanism that may also accelerate bacterial vortices in active turbulence.
2. Self-assembled chiral rotor
An S. marcescens bacterium measures 1  $\mathrm {\mu }$m in width and 2
  $\mathrm {\mu }$m in length (Li et al. Reference Li, Shi, Huang, Chen, Xiao, Liu, Chate and Zhang2019). When propelled by a flagellar bundle, a motile S. marcescens bacterium has an average swimming speed of 20
  $\mathrm {\mu }$m s
 $^{-1}$. In cell culture, a single colony of wild type S. marcescens bacteria (strain ATCC 274) is transferred into 3 ml of liquid Terrific Broth and incubated overnight (14–16 h) at 37
  $^\circ$C in a shaker at 250 rpm. The culture is diluted 100-fold into another 3 ml of Terrific Broth and cultured at 37
  $^\circ$C for 6 h in a shaker at 250 rpm. The cell culture is transferred into centrifuge tubes and washed twice with Berg's Mobility Buffer using a centrifuge at 800 g. Finally, the cell culture is concentrated into 50
  $\mathrm {\mu }$l and is ready to use. After washing with mobility buffer, 80
  $\mathrm {\mu }$l bacterial suspension of concentration from
  $1.5\times 10^{7}$ to
  $1.5\times 10^{9}$ ml
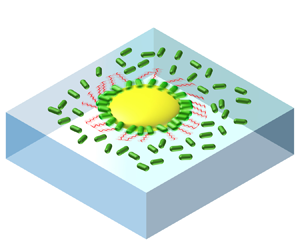
 $^{-1}$ is transferred into and partially fills a liquid chamber. For observation under a microscope, the liquid chamber is made by gluing a glass cover slip onto the bottom of a short stainless-steel tube of inner diameter 1 cm, outer diameter 5 cm and height 1 mm, as shown in figure 1(a). Within 5 min, swimming bacteria accumulate at the water–air interface in the chamber and then swim in strictly two dimensions since the cells are hydrophobic. The surface density
  $\phi$ (area fraction of the cell bodies) of bacteria first increases and then becomes constant after 5 min. By dipping a triglyceride-oil coated (by dip coating) micrometer-thick glass fibre into the bacterial suspension and then pulling out, oil droplets form at the water–air interface with a height-to-width ratio of 1:4 and the radius varies from 5 to 100
  $\mathrm {\mu }$m (see supplementary figure S1 available at https://doi.org/10.1017/jfm.2024.725). To minimize interaction among rotors, normally three droplets are deposited within the field of view of
  $180 \times 180\ \mathrm {\mu } {\rm m}^2$. The top of the chamber is then sealed by another cover slip to avoid drift caused by air flow or evaporation. Experiments are recorded with a camera at a frame rate of
  $\sim$15 fps. Thanks to its disordered translational motion, we can record a rotor for at least one minute before it moves out of the field of view.

Figure 1. Chiral rotor at a water–air interface. (a) Experimental set-up: an oil droplet and hydrophobic S. marcescens bacteria self-assemble into a rotor at a water–air interface in a liquid chamber. (b) Side view:a rotor bacterium (RB) sticks to the droplet at the oil–water–air contact line (CL). (c) Top view:  $\beta$ and
  $\alpha$ are the orientations of the cell body and the flagella. The lengths are not to scale. (d) Time lapse images of an interfacial rotor of radius
  $R=15$
  $\mathrm {\mu }$m surrounded by a small amount of free bacteria (FB) at an area fraction
  $\phi =0.05$. A colloidal bead in the oil droplet is used as a marker to track the droplet rotation. The CL is fully occupied by RB and four RB are marked by fake green colour, as illustrated in the inset. Their positions relative to the colloidal bead are found not to change throughout the experiment, as well as their orientations. (e) Probability distribution function (p.d.f.) of
  $\beta$ of RB cell bodies when the CL is not fully occupied (red) and fully occupied (black). 487 cells in 39 rotors for red data and 608 cells in 18 rotors for black data. CL of rotors are fully occupied by RB throughout this paper. (f) Fluorescence image of fluorescent labelled RB and flagella. All images are seen from the air. (g) P.d.f. of
  $\alpha$ of RB flagella. 20 flagella from two experiments at
  $\phi =0.05$ and 20 flagella from four experiments at
  $\phi =0.45$.
Upon randomly colliding into an oil droplet at the water–air interface, an S. marcescens bacterium anchors to the droplet by the cell body at the oil–water–air contact line (CL) while the flagellum propels the motion of the droplet (Darnton et al. Reference Darnton, Turner, Breuer and Berg2004; Schwarz-Linek et al. Reference Schwarz-Linek, Valeriani, Cacciuto, Cates, Marenduzzo, Morozov and Poon2012; Dewangan & Conrad Reference Dewangan and Conrad2019), as shown in figure 1(b,c). These rotor bacteria (RB) exhibit robust adhesion to the droplet within at least 30 s, as demonstrated in figure 1(d). To track the rotational motion of a rotor, colloidal particles are premixed into the oil. The particles are found to be immobile in a droplet due to the high viscosity of oil, as shown in figure 1(d). The angular displacement  $\Delta \theta$ of a rotor between two frames is measured with an accuracy of
  $1 \times 10^{-3}$ rad using a homemade MATLAB code.
By comparing the first four snapshots in figure 1(d), it is found that the rotor is rotating counter-clockwise (CCW) as viewed in the air. To understand how the rotational symmetry is broken, we first look at the orientations of the cell bodies of RB by defining  $\beta$ as the angle between the slender cell body and the radial direction to the centre of a droplet, as shown in figure 1(c). When CL are only partially occupied by RB, the cell bodies on average tilt slightly so that if the flagella align with the cell body, the rotation of the rotor is CCW, as shown in figure 1(e). Possible mechanisms on the tilt of cell bodies are discussed below. When CL are fully occupied by RB, the cell bodies are radially aligned (
 $\bar \alpha =0$) under a close packing and the fluctuation of
  $\alpha$ is largely reduced, as shown in figure 1(e). Throughout the paper, the CL of rotors are fully occupied by RB with a line density of
  $0.67\ \mathrm {\mu } {\rm m}^{-1}$.
Since the orientations of RB cell bodies under a fully occupied CL preserve the rotational symmetry of a rotor, we next examine the orientation of RB flagella. We define  $\alpha$ as the angle between flagella (or flagellar bundles) and the tangential direction, as shown in figure 1(c). By labelling with Alexa Fluor 532 (Turner, Ryu & Berg Reference Turner, Ryu and Berg2000), fluorescence imaging reveals that the ensemble-averaged orientation of RB flagella (mean length
  $l=6.3$
  $\mathrm {\mu }$m) is
  $\alpha =48^\circ$, as shown in figure 1(f,g), regardless of the density of surrounding free swimming bacteria (FB). Since
  $\bar \beta =0$,
  $48^\circ$ is also the tilt angle between RB flagella and their cell bodies.
We next discuss the tilting mechanism of the RB flagella. First, considering an assembly of droplet and a single bacterium with a solid hook, the rotating flagellum experiences an interface-induced hydrodynamic torque along the interface normal (Lauga et al. Reference Lauga, DiLuzio, Whitesides and Stone2006). This torque, similar to that experienced by a single bacterium swimming near a solid interface, tends to rotate the droplet–bacterium clockwise (CW) relative to a centre outside the assembly when viewed from the air, as the drag increases from the air interface to bulk water in a manner similar to that from bulk water to the solid interface. To fulfil a torque-free condition, the interface-induced torque is balanced by the drag torque of the assembly along the interface normal. Second, we take into consideration the flexibility of the flagellar hook, which connects the flagellum to the cell body, as shown by the red tube in figure 1(c). In this case, the hook will bend, leading to a tilt in the orientation of the flagellum in the direction depicted in figure 1(c). Examining the torques on different parts of the assembly: on the flagella, the interface-induced torque is balanced by an elastic torque from the hook; on the droplet, the elastic torque from the hook is balanced by the drag torque. The tilt angle thus can be determined by the interface-induced torque  ${\sim }10^{-18}$ N
 ${\cdot }$m (Lauga et al. Reference Lauga, DiLuzio, Whitesides and Stone2006; Bianchi et al. Reference Bianchi, Saglimbeni, Frangipane and Di Leonardo2022), the hook stiffness
  ${\sim }10^{-19}$ N
 ${\cdot }$m rad
 $^{-1}$ (Ryu, Berry & Berg Reference Ryu, Berry and Berg2000), and the rotational drag ratio between the droplet and the flagellum, along the interface normal. The exact tilt angle may also depend on possible collective motion among RB flagella, steric interactions and CL dynamics, which require further investigation. The hydrophobic junction between the cell bodies of RB and the droplet appears to lead to a much larger stiffness than the hook. Therefore, we observe the tilt of the flagella instead of a tilt of the cell body at the CL, as shown in figure 1(f,g).
Similar three-dimensional (3-D) oil droplets are found to rotate under the same hydrodynamic torques (CW near a solid surface and CWW near an air interface) (Dewangan & Conrad Reference Dewangan and Conrad2019), even though the orientations of cell bodies and flagella were not directly measured. In our system, bacteria also adhere to the bottom surface of a droplet, as shown in figure 1(d). By looking at the orientations of flagella and measuring the rotating velocity as a function of bacterial density at the bottom surface of a droplet, as shown in figure S2, we conclude that the propulsion is primarily driven by the bacteria at the CL.
We next focus on the rotation of a rotor. The trajectory of rotation of a rotor is superimposed onto a broader view of an experiment with a small amount of FB ( $\phi =0.05$), as shown in figure 2(a)(i). Its CCW rotation as a function of time is illustrated in figure 2(e) that normally lasts for hours. Since the rotation and translational motion of a rotor are decoupled, as indicated by their negligible correlation in figure 2(d), the rotation of a rotor can be studied independently without considering its translational motion. Mean square displacement (MSD) of the rotational motion is proportional to
  $t^2$ crossing the whole time scale, indicating a persistent rotation, as shown in figure 2(f). Probability distribution functions (p.d.f.s) of the rotor's angular velocity follows a normal distribution, as shown by the black dots in figure 2(g). With negligible interactions between FB and the rotor (i) at
  $\phi =0.05$, the fluctuation of angular velocity is mainly due to the fluctuation of the orientation of RB flagella, with tumbling also contributing. This is evidenced by the synchronization between
  $\omega (t)$ and
  $\alpha (t)$, as shown in figure 2(b).

Figure 2. Rotor motion in bacterial suspensions. (a) (i) to (iv) Snapshots of four experiments using rotors of radius  $R\sim 16$
  $\mathrm {\mu }$m in 2-D bacterial suspensions of different area fraction
  $\phi$ and
  $a_{F}$ (activity of a single free bacteria (FB), see main text). All CL are fully occupied by RB with activity
  $a_{R}=20$
  $\mathrm {\mu }$m s
 $^{-1}$.
  $4s$-trajectories of rotors’ rotation are shown as coloured dots. The flow fields in the surrounding bacterial suspensions are shown by arrows. The violet area in panel (iii) is irradiated by a UV laser to reduce
  $a_{F}$. (b) Time series of mean orientation of RB flagella and the rotating speed of a rotor with
  $R= 10$
  $\mathrm {\mu }$m at
  $\phi \sim 0$. (c) Trajectories of the colloidal beads in panel (a) (left to right: i to iv). (d) Correlations between the translational and rotational velocities of rotors at different
  $\phi$ (the same colour code as figure 3a). (e) Cumulative angle as a function of time for the four rotors. The solid line indicates a slope of 2. (f) Time averaged mean square displacement of angle in the four rotors. (g) P.d.f. of the angular velocities of the four rotors. Solid lines are Gaussian fittings. Inset: 385 normalized p.d.f.s of angular velocities of rotors of different
  $R$ at different
  $\phi$ and
  $a_{F}$. Here,
  $\omega '=(\omega -\omega _0)/\sigma$. The solid line is a Gaussian function that centres at 0 with a standard deviation of 1.
3. Influence of free swimming bacteria on the rotation of a rotor
Our key finding is a nonlinear increase in the mean angular velocity of a rotor as a function of FB density and the increase is independent of FB activity. We use free swimming speeds  $a_{R}$ of RB, that is, measured before RB collide to a droplet, and
  $a_{F}$ to quantify the activity of RB and FB, respectively. Here,
  $a_{R}=20\ \mathrm {\mu } {\rm m}\ {\rm s}^{-1}$ is constant throughout this paper, whereas
  $a_{F}$ is adjusted from
  $20$ to
  $10\ \mathrm {\mu } {\rm m}\ {\rm s}^{-1}$ by shining a patterned UV laser on FB only. The lower limit
  $a_{F}=10\ \mathrm {\mu } {\rm m}\ {\rm s}^{-1}$ is set by the fact that S. marcescens with very low activity tends to form clusters at a water–air interface due to a significantly lowered depletion potential compared with active ones (Schwarz-Linek et al. Reference Schwarz-Linek, Valeriani, Cacciuto, Cates, Marenduzzo, Morozov and Poon2012). When the area fraction
  $\phi >0.15$, 2-D suspensions of FB exhibits turbulence-like motion that is globally isotropic (figure S3) with spatial and temporal fluctuation, both observed in 3-D active turbulence (Cisneros et al. Reference Cisneros, Kessler, Ganguly and Goldstein2011). In active turbulence, the mean flow speed
  $V$ is faster than the swimming speed
  $a_{F}$ of a solitary bacterium. The vortex size is 25
  $\mathrm {\mu }$m with a correlation time
  $\sim$0.5 s (Rabani, Ariel & Be'er Reference Rabani, Ariel and Be'er2013), as indicated by the correlation functions in figure 6(b) and figure S3.
With an increasing  $\phi$, a rotor is surrounded by more FB and is found to rotate faster, by comparing the four rotors in figure 2(a). Interestingly, at a constant
  $\phi =0.32$, a rotor's mean angular velocity is the same despite
  $a_{F}$ being changed by a factor of 2, by comparing rotors (ii) and (iii). MSD of the rotational motion remains persistent crossing the whole time scale for all rotors, as shown in figure 2(f). P.d.f.s of the four rotors’ angular velocities retain a normal distribution, as shown in figure 2(g). Fluctuation of angular velocity increases with
  $\phi$ under the same
  $a_{F}$. At
  $\phi =0.32$, fluctuation increases with increasing
  $a_{F}$. Since the MSD yields the same average angular speed as from the p.d.f., and the p.d.f. provides additional information on the fluctuation of angular velocity, we focus on the p.d.f. analysis in this paper.
The temporal auto-correlation function of rotor's angular velocity remains invariant with  $\phi$, as shown in figure 6(b), with a correlation time
  $\sim$0.5 s akin to a free 2-D vortex. This indicates that the observed correlation time is an intrinsic property of a bacterial rotor, differing from the ratchet experiments (Di Leonardo et al. Reference Di Leonardo, Angelani, Arciprete, Ruocco, Iebba, Schippa, Conte, Mecarini, De Angelis and Di Fabrizio2010), in which both angular velocity and correlation time increase with concentration of free bacteria.
P.d.f.s of angular velocities for 385 rotors are Gaussian, as shown in the inset of figure 2(g). Symmetric distribution of velocity with an increasing  $\phi$ indicates that the observed acceleration of rotor is not a rare event under a rectified surrounding flow of FB. This will be further proved in the next section. Gaussian fittings yield mean angular velocities
  $\omega _0$ and fluctuations
  $\sigma$ for each rotor. Here,
  $\omega _0$ decreases with increasing rotor radius
  $R$, as shown in figure 3(a). This can be explained by a propelling torque
  $\propto R^2$ and a drag coefficient
  $\propto R^{3}$ leading to
  $\omega \propto 1/R$. The same scalings have been reported by Schwarz-Linek et al. (Reference Schwarz-Linek, Valeriani, Cacciuto, Cates, Marenduzzo, Morozov and Poon2012). Here,
  $\omega _0$ and
  $\sigma$ are sorted into five groups according to
  $\phi$. Inverse-law fittings yield
  $\omega _0 R$ as a function of
  $\phi$ when
  $a_{F}=20\ \mathrm {\mu } {\rm m}\ {\rm s}^{-1}$ (figure 3b). The
  $1/R$ dependence of
  $\omega _0$ at length scales across the correlation length of active turbulence of 25
  $\mathrm {\mu }$m (see figure S3) also indicates a lack of coherent motion between rotors and FB. Normalized angular velocity
  $\omega _0 R$ increases nonlinearly with
  $\phi$:
  $\omega _0 R$ is constant when
  $\phi \leq 0.15$ and increases linearly with
  $\phi$ for
  $\phi >0.15$.

Figure 3. Average and fluctuation of angular velocity for the 385 rotors. (a,d) Average and fluctuation of velocity for rotors of different radius  $R$ and
  $\phi$ while
  $a_{R}=a_{F}=20\ \mathrm {\mu } {\rm m}\ {\rm s}^{-1}$, obtained by Gaussian fittings to the p.d.f. of angular velocities. Colour codes for
  $\phi$. Shaded areas quantify standard deviation. The slope of
  $-$1 is indicated by the red lines. (b,e) Normalized average and fluctuation of angular velocities at different
  $\phi$ after inverse-law fittings to the data in panels (a) and (d). Errors are uncertainties in the fitting. (c,f) Normalized average and fluctuation of angular velocity for rotors in bacterial suspension where
  $\phi =0.35$ and
  $V$ is varied by changing
  $a_{F}$. The star in panel (c) is obtained from hydrodynamic simulation.
At  $\phi =0.35$,
  $a_{F}$ is adjusted from
  $10$ to
  $20\ \mathrm {\mu } {\rm m}\ {\rm s}^{-1}$ by using a patterned UV laser to irradiate FB only, while retaining
  $a_{R}=20\ \mathrm {\mu } {\rm m}\ {\rm s}^{-1}$. As mentioned above, immobile S. marcescens tends to form clusters and the lowest
  $a_{F}=10\ \mathrm {\mu } {\rm m}\ {\rm s}^{-1}$. For convenience, we use V instead of
  $a_{F}$ to quantify the activity of FB at
  $\phi =0.35$, revealing that
  $\omega _0 R$ is invariant with V, as shown in figure 3(c). Fluctuation of angular velocity
  $\sigma$ as a function of
  $R$ share the same trends as
  $\omega _0 R$, as shown in figure 3(d,e). However, unlike
  $\omega _0 R$,
  $\sigma R$ increases linearly with V at
  $\phi =0.35$, as shown in figure 3(f).
The orientation of RB flagella remains unchanged as  $\phi$ increases, as shown in figure 1(g). The observed enhanced angular velocity is thus not a consequence of the rectification effect, such as suppression of flagellar angle. A question emerges regarding the role of FB in a rotor's rotation at different
  $\phi$ and
  $a_{F}$.
The fluctuation of a rotor's angular velocity provides additional information on the bacterial turbulence. By manipulating  $a_{F}$, we find that
  $\omega _0$ and
  $\sigma$ are decoupled: while
  $\omega _0$ is ruled by the flagella of RB,
  $\sigma$ is regulated by the activity of surrounding flow (see figure S4 for the correlation between instantaneous angular velocity and nearby FB flow speed). The instantaneous angular velocity of a rotor can thus be decomposed into propulsion of RB flagella and long-range disturbance from active turbulence. Here,
  $\sigma R$ changes simultaneously with V as a function of
  $\phi$ with fixed
  $a_{F}$, as shown in figure 3(e). At a fixed high
  $\phi$,
  $\sigma R$ increases linearly with FB activity, as shown in figure 3(f). At high
  $\phi$,
  $\sigma$ is influenced by active turbulence and the change of
  $\sigma$ follows the same trend as V, as shown in figure 6(a). The linear relationship between
  $\omega _0$ and
  $\sigma$ at
  $a_{F}=a_{R}=20~\mathrm {\mu } {\rm m}\ {\rm s}^{-1}$, as shown in the inset of figure 3(e), implies that the same near-field hydrodynamic interaction induced acceleration may apply to free vortices that acts back on a rotor and increases its fluctuation of angular velocity.
4. A rotor disrupts vortices in active turbulence
At  $\phi >0.15$, the FB flow is measured by performing particle imaging velocimetry (PIV) or opticalflow on a video. The accuracy of PIV is tested by particle tracking (figure S5). Using opticalflow, the spatial resolution is the size of the cell body. As mentioned above, the independence of a rotor's angular velocity on
  $a_{F}$ implies that the mechanism of the observed acceleration of a rotor with an increasing
  $\phi$ is different from the second-order phase transition to active nematic in active turbulence that also exhibits a nonlinear change of V with
  $\phi$ (Aranson et al. Reference Aranson, Sokolov, Kessler and Goldstein2007). Indeed, a weak downstream flow around a rotor is observed that diminishes with increasing
  $\phi$, as shown in figure 4(c), instead of a strengthening collective motion between the rotor and FB. The time-averaged direction of motion of FB is CW (
 $V_T<0$) adjacent to a rotor. Moreover, FB move slower near the periphery of a rotor, as shown in figure 4(b). This trend is obvious when
  $\phi$ is high (violet and green lines), where the speed of FB drops below
  $a_{F}$ near the CL. However, when
  $\phi \leq 0.15$, FB motion is unhindered and their mean speed is not affected by the rotor, as shown by the yellowish lines in figure 4(b). It is unlikely that a free bacterium, upon colliding with a rotor, would simultaneously turn to the left (
 $V_T<0$) and propel the rotor to rotate faster. This scenario is improbable because the aforementioned hydrodynamic torque at a water–air interface would cause the FB to turn to the right upon collision, not to the left.

Figure 4. Motion and density of FB. (a) Decomposition of FB motion relative to the centre of a rotor. Positive directions are defined in the diagram. (b) Time-averaged  $V(r)$ at different distance
  $r$ to the CL. Colour code denotes
  $\phi$. Dashed lines are obtained by using FB with
  $a_{F}<20\ \mathrm {\mu } {\rm m}\ {\rm s}^{-1}$. Here,
  $a_{F}$ of individual bacterium is used as V when
  $\phi (r)<0.15$. (c) Time-averaged tangential and radial components of FB velocity relative to the centre of a rotor at different distance to the CL. Colour code denotes
  $\phi$. Yellow-filled stars are obtained by using FB with
  $a_{F}<20\ \mathrm {\mu } {\rm m}\ {\rm s}^{-1}$. (d) Typical time-averaged densities
  $\phi (r)$ at different distances to the CL of a rotor in suspensions of different
  $\phi =\phi (\infty )$. All grey regions in panels (b) to (d) indicate the area occupied by RB flagella
  $r-R< l \sin \alpha \sim 5$
  $\mathrm {\mu }$m.
The density of FB is almost unchanged when approaching a rotor from far away, as shown in figure 4(d). As a result, the change of speed in figure 4(b,c) is not due to a dilution of FB near the CL. In sum, figure 4 underscores that a rotor disrupts vortices and slows down nearby FB.
5. Hydrodynamic theory and numerical simulations of oil rotor acceleration
5.1. Hydrodynamic theory
First, a hydrodynamic theory is developed in this section to explore the reason for the acceleration rotation of the oil droplet when bacterial concentration increases. As shown in figure 5(a), the rotor system is modelled as an assembly of an oblate oil droplet and a flagellum consisting of two helices, wherein the bacterial body is not explicitly incorporated due to its immersion within the contact line of the oil droplet. The angle  $\alpha$ represents the inclination between the flagellum and the surface of the oil droplet. In the quasi-2-D air–liquid interface, we consider only the rotational motion of oil droplets along the
  $z$-axis and their translational motion in the
  $xy$ plane. When the bacterial motor propels the flagellum to rotate, the resulting translational motion imparts an angular velocity along the
  $z$-axis to the droplet.

Figure 5. (a) Theoretical modelling of the rotor system: an assembly of an oblate spheroid and a flagellum consisting of two helices, positioned beneath the air–liquid interface. (b) Angular velocity of the rotor as a function of its radius. (c) Schematic diagram of numerical calculations: oil droplets are composed of standard Stokelets, flagellum is composed of regularized Stokeslets, RB at the contact line is not explicitly modelled and FB is represented as a sphere. Here,  $\delta$ denotes the minimum surface distance between FB and flagellum. (d) Reduced angular velocity of the rotor for immobile (blue diamonds) and mobile (red triangles) FBs, respectively. The solid lines are guides for the eye. Experimental results for the reduced angular velocity are also presented (open circles). Inset: the surface distance versus bacterial concentration, obtained by analysing the images near a rotor at different
  $\phi$ (figure S6). (e) Reduced angular velocity as a function of the reduced rotation-translation drag coefficient for immobile spheres. The blue dashed line represents the straight line of
  $\omega _r=1.06c_r$. Inset: reduced angular velocity as a function of the reduced rotation-translation drag coefficient for mobile spheres. The red dashed line represents the straight line of
  $\omega _r=1.62c_r$. All numerical computations are implemented under
  $h=4.1$
  $\mathrm {\mu }$m.
An explicit analytical expression is derived for the rotational speed of the droplet and drag coefficients of the droplet–flagellum system, as well as the rotation rate of the bacterial flagellum. The proposed minimal model successfully captures a  $1/R$ decay of rotor speeds at large oil diameters and a
  $\cos \alpha$ dependence of rotor speeds at large orientation angles. According to our findings, we attribute the acceleration of the rotor to an increase in the translation-rotation-coupling drag coefficient caused by spatial confinement from surrounding bacteria and the air–liquid boundary.
In low-Reynolds-number flows, we consider only the translational motion of droplets on the  $xy$ plane and rotational motion along the
  $z$-axis. The relationship between force and velocity, as well as torque and angular velocity, is expressed by the following equations:
 \begin{equation} \begin{pmatrix}
F_{x'}^{D} \\ F_{y'}^{D} \\ L_{z^{'}}^{D} \end{pmatrix} =
\begin{pmatrix} A_{D} & 0 & 0 \\ 0 & A_{D} & 0 \\ 0 & 0 &
B_{D} \end{pmatrix}\begin{pmatrix} U_{x'}^{D} \\ U_{y'}^{D}
\\ \varOmega_{z'}^{D} \end{pmatrix},
\end{equation}
\begin{equation} \begin{pmatrix}
F_{x'}^{D} \\ F_{y'}^{D} \\ L_{z^{'}}^{D} \end{pmatrix} =
\begin{pmatrix} A_{D} & 0 & 0 \\ 0 & A_{D} & 0 \\ 0 & 0 &
B_{D} \end{pmatrix}\begin{pmatrix} U_{x'}^{D} \\ U_{y'}^{D}
\\ \varOmega_{z'}^{D} \end{pmatrix},
\end{equation}
where the relative position  $\{x',y',z'\}$ is measured from the hydrodynamic centre of the oil droplet, as shown in figure 5(a). Here,
  $A_D$ and
  $B_D$ represent the drag coefficients for translational and rotational motion of an oblate spheroid, respectively, for which have analytical solutions in a standard book (Happel & Brenner Reference Happel and Brenner1983). Moreover, the relationship between flagellum motion and hydrodynamic force with respect to the contact point
  $O$ can be described as follows:
 \begin{equation} \begin{pmatrix}
F_{x}^{t} \\ F_{y}^{t}\\ L_{x}^{t} \\ L_{z}^{t}
\end{pmatrix} = \begin{pmatrix} a_{x} & 0 & c & 0\\ 0 &
a_{y} & 0 & 0\\ d & 0 & e & 0 \\ 0 & 0 & 0 & b
\end{pmatrix}\begin{pmatrix} U_{x}^{t} \\ U_{x}^{t}\\
{\omega{}_{x}^{t}} \\ {\omega{}_{z}^{t}}
\end{pmatrix}.
\end{equation}
\begin{equation} \begin{pmatrix}
F_{x}^{t} \\ F_{y}^{t}\\ L_{x}^{t} \\ L_{z}^{t}
\end{pmatrix} = \begin{pmatrix} a_{x} & 0 & c & 0\\ 0 &
a_{y} & 0 & 0\\ d & 0 & e & 0 \\ 0 & 0 & 0 & b
\end{pmatrix}\begin{pmatrix} U_{x}^{t} \\ U_{x}^{t}\\
{\omega{}_{x}^{t}} \\ {\omega{}_{z}^{t}}
\end{pmatrix}.
\end{equation}
The drag coefficients  $a_x, a_y, c, e ,d, b$ for helical flagella are dependent on the specific geometry and surrounding environment, such as particle distribution and spatial confinement. These coefficients can be determined analytically using slender body theory in unbounded space (Rodenborn et al. Reference Rodenborn, Chen, Swinney, Liu and Zhang2013) or numerically by employing the method of regularized Stokeslets in complex environments (Cortez, Fauci & Medovikov Reference Cortez, Fauci and Medovikov2005). Given the torque-free and force-free conditions, the connection between forces and torques at different reference points
  $O$ and
  $O'$ yields the following equations:
 \begin{equation} \left.\begin{gathered} L_{z}^{D} ={-} ( {L_{z}^{t} + [{\Delta\boldsymbol{r} \times \boldsymbol{F}^{t}}]_{z}} ),\\ F_{x}^{t} ={-} F_{x}^{D},\\ F_{y}^{t} ={-} F_{y}^{D},\\ F_{x}^{D} = F_{x'}^{D},\\ F_{y}^{D} = F_{y'}^{D}. \end{gathered}\right\} \end{equation}
The velocities and angular velocities at reference points  $O$ and
  $O'$ have
 \begin{equation} \left.\begin{gathered} \boldsymbol{U}^{t} = \boldsymbol{U}^{D} + \boldsymbol{\varOmega}^{D} \times \Delta\boldsymbol{r},\\ \omega_{z}^{t} = \varOmega_{z'}^{t} = \varOmega, \end{gathered}\right\} \end{equation}
where  $\Delta \boldsymbol {r}=\{-R\sin (\alpha ),R\cos (\alpha )\}$,
  $\varOmega$ is oil rotor speed along
  $z$-direction, and
  $\omega _x^t\equiv \omega _T$ denotes the rotating rate of the flagellum. By combining the above (5.1)–(5.4), the relationship between
  $\varOmega$ and
  $\omega _T$ can be determined as
 \begin{equation} \varOmega= \gamma \omega_T. \end{equation}
The dimensionless rotational coefficient  $\gamma$ is found to depend on drag coefficients of the system and inclination angle,
 \begin{equation} \gamma = \frac{cA_{D}\xi_{y}{R\cos(\alpha)}}{( {B_{D} + b} )\xi_{y}\xi_{x} + {A_{D}R}^{2}a_{y}\sin^{2}(\alpha)\xi_{x} + {A_{D}R}^{2}a_{x}\cos^{2}(\alpha)\xi_{y}}, \end{equation}
where  $\xi _x = A_D+a_x$ and
  $\xi _y = A_D+a_y$ are translational drag coefficients of the overall system. For an oblate spheroid, the translational and rotational drag coefficients are related to the modified Stokes relation as
  $A_D=6{\rm \pi} \eta R K_1$ and
  $B_D=8{\rm \pi} \eta (RK_2)^3$, respectively. Equivalent radius coefficients are
  $K_1=0.6826$ and
  $K_2=0.8254$ for an spheroid with aspect ratio of 1/4. We numerically determine the drag coefficients of the flagellum using the regularized Stokeslets method, with values of
  $a_x=13.355\eta$
  $\mathrm {\mu }$m,
  $a_y=17.891\eta$
  $\mathrm {\mu }$m,
  $b=263.559\eta$
  $\mathrm {\mu } \textrm {m}^3$ and
  $c=0.985 \eta$
  $\mathrm {\mu } \textrm {m}^2$.
In the case where the oil droplet is significantly larger,  $A_D\gg a_x$,
  $a_y$ and
  $B_D\gg b$, (5.6) can be simplified to
 \begin{equation} \gamma = \frac{c R\cos(\alpha)}{B_{D} + R^{2}a_{y}\sin^{2}(\alpha) + R^{2}a_{x}\cos^{2}(\alpha)}, \end{equation}
which decays with  $R^{-2}$ at large
  $R$. Neglecting the hydrodynamic coupling among flagella, we make the assumption that the angular velocity of oil droplet rotors at high bacterial concentrations (
 $\phi >0.05$) is directly proportional to the number of bacterial flagella presenting on the contact line (RB flagella):
 \begin{equation} \omega_0 = N\varOmega = 2{\rm \pi} R\rho_{L}\gamma\omega_{T}, \end{equation}
where the line density of bacteria on contact line  $\rho _L$ is experimentally measured to be
  $0.67 \ \mathrm {\mu } \textrm {m}^{-1}$. The rotational rate of the flagellum
  $\omega _T=600\ \textrm {s}^{-1}$. Equation (5.8) indicates that the angular velocity of the whole rotor is inversely proportional to the radius of the oil droplet,
  $\omega _0\sim 1/R$, as shown in figure 5(b).
When the contact line becomes filled with bacteria, the change in  $\omega _0$ only depends on the dimensionless coefficient
  $\gamma$. According to (5.7), the dimensionless coefficient
  $\gamma$ is proportional to the translation-rotation coupling drag coefficient
  $c$. In our experiments, we observed no significant changes in the inclination angle
  $\alpha$. Regularized Stokelets calculations reveal weak dependence on surrounding bacteria in the translational drag coefficients of flagellum
  $a_x$ and
  $a_y$. Hence, we propose that drag coefficient
  $c$ predominantly governs the enhanced motion of CL flagella and leads to an accelerated rotation of the rotor.
5.2. Numerical simulations
Figure 4 demonstrates a significant decrease in bacterial movement speed adjacent to the oil droplet as bacterial concentration  $\phi$ increases. This finding is consistent with the observed accelerated rotation corresponding to higher
  $\phi$. In low-Reynolds-number flows, extensive research has demonstrated that the presence of spatial constraints, such as confinement within pipes (Zhu, Lauga & Brandt Reference Zhu, Lauga and Brandt2013; Liu et al. Reference Liu, Breuer and Powers2014) or movement through stationary obstacles (Leshansky Reference Leshansky2009), can lead to significant acceleration even when the flagella rotate at the same rate. Therefore, we propose that the acceleration of the oil droplet is attributed to a hydrodynamic interaction mechanism, wherein the motility of crowded bacteria decreases and they aggregate in close proximity to the RB flagella. The near-field hydrodynamic interaction between these decelerated FBs and the RB flagellum significantly increases the rotation-translation drag coefficient
  $c$, thereby resulting in the rotor acceleration as described by (5.7) and (5.8).
In this section, we numerically investigate the impact of crowding effects exerted by surrounding bacteria on rotor acceleration. Our objective is to elucidate the hydrodynamic interaction between RB flagella at the contact line and nearby FBs, aiming to provide a quantitative understanding of the relationship between rotor acceleration and bacterial concentration in the external environment. We adopt the Stokeslets method to solve the linearized Stokes equation for low-Reynolds-number flow (Cortez et al. Reference Cortez, Fauci and Medovikov2005). In the meshless regularized Stokeslet method (RSM), we remove unphysical singularities and singular surface integrals, allowing for more accurate calculations of flagellated bacteria motion while reducing computational costs. The disturbance velocity  $u_i$ at location
  $\boldsymbol {x}$, caused by the surface force point
  $\boldsymbol {X}$ of the swimmer, is obtained using the conventional procedure of the RSM,
 \begin{equation} u_i(\boldsymbol{x})=\sum_j^NS_{ij}^e(\boldsymbol{x},\boldsymbol{X})f_j(\boldsymbol{X}), \end{equation}
where  $S_{ij}^e$ is the fundamental solution of the Stokes equations. The standard Stokeslets are known as the Oseen tensor,
  $S_{ij}=(\delta _{ij}/r+r_ir_j/r^3)/8{\rm \pi}$, where
  $\boldsymbol {r}=\boldsymbol {x}-\boldsymbol {X}$,
  $r=|\boldsymbol {r}|$ and
  $\delta _{ij}$ is the Kronecker delta function. The regularized version of Stokeslets has been established according to a Gaussian blob (Hernández-Ortiz, de Pablo & Graham Reference Hernández-Ortiz, de Pablo and Graham2007),
 \begin{equation} S_{ij}^e=\frac{1}{8{\rm \pi}\eta}\left[ \delta_{ij}+\frac{r_ir_j}{r^2} \right]\frac{erf(r/\epsilon)}{r}+\frac{1}{8{\rm \pi}\eta}\left[ \delta_{ij}-\frac{r_ir_j}{r^2}\right]\frac{2}{\epsilon\sqrt{\rm \pi}}\,{\rm e}^{{-}r^2/\epsilon^2}, \end{equation}
where the cutoff function  $\epsilon$ eliminates the singularities located at
  $r=0$.
In the experimental set-up, the droplet–flagellum system is positioned below the air–liquid interface, as shown in figure 5(a). The stress is absent and the normal component of flow velocity vanishes at the interface. The implementation of the boundary condition can be achieved through the introduction of an image method (Mathijssen et al. Reference Mathijssen, Doostmohammadi, Yeomans and Shendruk2016). The method involves the presence of a mirrored image point force at  $\boldsymbol {X}'=(X_1,X_2,X_3+2h)$, where
  $h$ represents the distance between the point force and the interface. The flow field generated by the image system gives rise to an additional propagating Green's function, which is modified as
  $S^{total}_{ij}=S^e_{ij}(\boldsymbol {x},\boldsymbol {X})+S'_{ij}(\boldsymbol {x},\boldsymbol {X}')$, where
  $S'_{ij}(\boldsymbol {x},\boldsymbol {X}')=M_{jk}S_{ik}^e(\boldsymbol {x},\boldsymbol {X}')$ with a mirror matrix
  $\boldsymbol{\mathsf{M}}=\mathrm {diag}(1,1,-1)$.
We experimentally observe that when the bacterial concentration exceeds 0.05, the droplet contact line becomes filled with bacterial heads. Consequently, it is reasonable to assume the application of a no-slip boundary condition on the surface of the spheroid. As the RB bacterial head is embedded in the contact line of the droplet, we have not explicitly incorporated its modelling into our study. The flagellum consists of two helices with three pitches. We designate the radius of the helix as 0.3  $\mathrm {\mu }$m and the pitch length as 2.1
  $\mathrm {\mu }$m. The helices rotate along the longitudinal central axis at a fixed rate
  $\omega _T$ determined by the bacterial motor. Experimental observations reveal that the angle
  $\alpha$ between the flagellum and droplet is approximately
  $50^\circ$, while the oblate droplet exhibits an aspect ratio of
  $R:h = 4:1$ (figure S1). As illustrated in figure 5(c), the neighbouring bacteria are represented as five spheres when
  $\phi >0.09$ or three spheres when
  $\phi <0.09$. The radius of sphere 0.9
  $\mathrm {\mu }$m is calculated based on the density and distance among free bacteria (figure S7). We investigate two cases: these spheres remaining immobile or freely mobile (force-free), which correspond to high and low concentrations, respectively.
Standard Stokeslets are employed to represent the point forces acting on the oil droplets and spheres, while regularized Stokeslets are used to model the point forces exerted on flagella. Additionally, the rotor's motion is restricted to a quasi-2-D plane, with our primary focus being solely on its rotational movement along the  $z$-axis. As a result, in numerical computations, we exclusively consider the torque-free condition in the
  $z$-direction and the force-free condition within the
  $xy$ plane. To ensure the accuracy of our numerical calculations, we employ approximately 20 000 Stokeslets for the spheroid, 1800 for the flagellum and 600 for each surrounding sphere. This discretization scheme guarantees a discretization error of less than 10 %, as validated by a boundary surface leak test. The rotation rate of the flagellum (
 $\omega _T$) is considered as an input parameter, and (5.9) is solved using the the generalized minimum residual method to determine the rotational speed of the rotor in different surface distances
  $\delta$ between flagellum and FB. The distance
  $\delta$ is inversely proportional to bacterial concentration
  $\phi$, and it can be determined by the distance-density mapping by analysing images near a rotor at different
  $\phi$ (figure S6).
As shown in figure 5(d), it is observed that for  $\phi \le 0.15$, the experimental measurements of rotor angular velocity remain nearly constant with bacterial concentration, consistent with numerical calculations for mobile FBs. At higher concentrations (
 $\phi >0.15$), the rotor's angular velocity significantly increases, which quantitatively agrees with numerical RSM calculations for immobile FBs. To further investigate the factors influencing rotor acceleration, we examined the relationship between incremental angular velocity
  $\omega _r=\omega (\phi )/\omega (\phi =0)$ and incremental drag coefficient
  $c_r=c(\phi )/c(\phi =0)$ at different bacterial concentrations. Figure 5(e) demonstrates that the incremental angular velocity is approximately equal to the incremental drag coefficient for immobile bacteria,
  $\omega _r=k c_r$, where
  $k=1.06$. This experimental observation validates our theoretical prediction in (5.5). Similarly, for mobile bacteria as well,
  $\omega _r$ is also proportional to
  $c_r$, but with a larger slope (
 $k=1.62$). This discrepancy may arise from neglecting hydrodynamic interactions between tails and oil droplets in our simplified theoretical model. Our numerical RSB results provide compelling evidence that the near-field hydrodynamic interactions induced by crowded bacteria in close proximity lead to an augmentation of the rotation-translation drag coefficient of RB flagella, consequently resulting in a corresponding increase in angular velocity of the rotor.
At the critical density  $\phi _c=0.15$, where significant crowdedness induces near-field hydrodynamic effect, rotor acceleration and active turbulence (2-D in this work and 3-D in Sokolov et al. Reference Sokolov, Aranson, Kessler and Goldstein2007) starts simultaneously, as shown in figure 6(a). This observation suggest a possible link between near-field hydrodynamic interaction and the onset of instability in active turbulence. The observed acceleration can be explained without considering drag reduction in an aligned active nematic.

Figure 6. (a) Mean rotor speed (same as figure 3b), mean speed of free bacteria from this work with  $a_{R}=a_{F}=20\ \mathrm {\mu } \textrm {m}\ \textrm {s}^{-1}$ and from quasi-2-D experiments (Sokolov et al. Reference Sokolov, Aranson, Kessler and Goldstein2007), and simulated rotor speed (a combination of blue symbols for
  $\phi >0.15$ and red symbols for
  $\phi <0.15$ in figure 5d) as a function of
  $\phi$. All results are normalized by their first point values. (b) Temporal auto-correlation functions of angular velocities for rotors of different
  $R$ at different
  $\phi$ (solid lines). The dashed line is the result of free vortices at
  $\phi =0.35$.
As shown in figure 3(a), by comparing the top three lines (with high  $\phi$), it can be seen that the rotations of small rotors deviate from the
  $1/R$ relationship. This can be explained by the breakdown of (5.7) in small rotors, since drag coefficients from the 6.3
  $\mathrm {\mu }$m long flagella such as
  $a_x$ and
  $a_y$ are no longer negligible compared with those from the droplet. Equation (5.6) has to be used instead. An increased
  $\phi$ will increase both
  $c$ and the denominator in (5.7). In other words, the acceleration of a large rotor due to an increased coupling drag coefficient of flagella is weakened. A small rotor approaches a single bacterium that does not accelerate under confinement.
To conclude, we observe nonlinear acceleration of a bacterial rotor with stable chirality under a crowded environment. The acceleration origins from near-field hydrodynamic interaction. The presence of crowded bacteria with low motility increases the translation-rotation-coupling coefficient of the flagella on the rotor, consequently leading to an accelerated rotation of the rotor. This acceleration mechanism can apply to similar systems such as Volvox. In our experiments, the critical density coincides with the onset of active turbulence, indicating a possible link between enhanced mobility and the onset of instability. Considering the rotor as a rheometer, the shear rate  $\sim$1 s
 $^{-1}$ of a rotor at which we observe rotor acceleration falls into the range where the effective viscosity switches sign in a bacterial ‘superfluid’ (López et al. Reference López, Gachelin, Douarche, Auradou and Clément2015). With the new interfacial rotor, it is also interesting to study the topology of active turbulence using a bacterial suspension mixed with a large number of rotors (Reinken et al. Reference Reinken, Nishiguchi, Heidenreich, Sokolov, Bär, Klapp and Aranson2020).
Supplementary material and movies
Supplementary material and movies are available at https://doi.org/10.1017/jfm.2024.725.
Funding
This work is supported by the startup support of ShanghaiTech University (S.G.) and National Natural Science Foundation of China under grant no. 32071253 (S.G.) and no. 12374218 and 11904320 (B.Z.), Fundamental Research Funds for the Central Universities under grant no. SWU-KQ22033 and the Science and Technology Research Program of Chongqing Municipal Education Commission under grant no. KJQN202200210 (B.Z.).
Declaration of interest
The authors report no conflict of interest.
Author contributions
H.H. and B.Z. contributed equally to this work.


