Metabolic syndrome (MetS) is a complex disease defined by a cluster of interconnected metabolic abnormalities involving abdominal obesity, elevated fasting plasma glucose, raised blood pressure, high serum TAG and low HDL-cholesterol level( Reference Alberti, Zimmet and Shaw 1 ). Recently, the prevalence of MetS has increased rapidly worldwide. It is estimated that 20–25 % of the world’s adult population has MetS( Reference Kaduka, Kombe and Kenya 2 ). Given that MetS is strongly associated with increased risks of CVD( Reference Mottillo, Filion and Genest 3 ), cancer( Reference Esposito, Chiodini and Colao 4 ) and mortality( Reference Wu, Liu and Ho 5 ), preventive measures for MetS are important to public health.
Dietary modifications play an important role in prevention of MetS. Evidence has already shown that the Mediterranean dietary pattern and specific foods such as fish and dairy may have protective effects against MetS( Reference Yamaoka and Tango 6 – Reference Kim and Je 9 ). This evidence has evaluated the protective effect of a particular dietary pattern or a specific food as a whole on MetS. However, we need to be further aware of the specific components in food that have a protective effect on MetS in order to better optimize the dietary structure and follow a healthy diet. As the most abundant mineral element in the human body, Ca has many biological functions, including participating in energy metabolism( Reference Ju, Choi and Ock 10 ). Therefore, it is meaningful to evaluate the possible benefits of dietary Ca intake against the risk of MetS. As of now, there has been no published intervention study on Ca intake and MetS in human subjects. Several observational studies have reported the association of dietary Ca intake and MetS risk. However, the results of these studies were inconsistent. An inverse association between dietary Ca intake and the risk of MetS was found in some studies( Reference Al-Daghri, Khan and Alkharfy 11 – Reference Cho, Park and Shin 15 ), whereas no significant association was found in other studies( Reference Pannu, Zhao and Soares 16 – Reference Bruscato, Vieira and do Nascimento 18 ). Therefore, we carried out a comprehensive meta-analysis by combining the results from all available observational studies to assess the protective effect of dietary Ca intake on MetS and to evaluate the probable dose–response relationship between dietary Ca intake and MetS risk.
Materials and methods
We followed the Meta-analysis of Observational Studies in Epidemiology (MOOSE) guidelines in the present meta-analysis.
Literature search strategy
We searched PubMed, Embase and Web of Science up to October 2018 with the keywords ‘calcium’ combined with ‘(metabolic syndrome OR syndrome × OR insulin resistant syndrome)’ without restrictions. As an example, the detailed syntax of the search conducted in PubMed is shown in the online supplementary material, Table S1. Furthermore, the reference lists of retrieved articles were scrutinized to identify additional relevant studies.
Inclusion criteria
The inclusion criteria were as follows: (i) observational studies (including cohort, case–control and cross-sectional designs); (ii) the exposure of interest was the dietary intake of Ca; (iii) the outcome of interest was MetS; and (iv) odds ratios, relative risks or hazard ratios with corresponding 95 % CI were provided (or data were available to calculate them). For dose–response analysis, OR (95 % CI) for at least three quantitative categories of dietary Ca intake were provided, and person-years or the number of cases and participants for each category of dietary Ca intake also were provided (or data were available to calculate them); (v) the most recent and complete study was selected if data from the same population had been published more than once; and (vi) the study was published in English or Chinese.
Exclusion criteria
The exclusion criteria were as follows: (i) search results presented with abstracts, and the full texts were written in languages other than English or Chinese; (ii) unpublished studies; (iii) did not evaluate the association between dietary Ca intake and MetS; (iv) duplicated data; and (v) no adjustment for confounders.
Two investigators (L.C. and D.H.) searched and reviewed all identified studies independently. If the two investigators disagreed about the eligibility of an article, it was resolved by negotiation.
Data extraction
Using a standardized data-collection form, the following data were extracted from each included study: the first author’s name, publication year, the country where the study was conducted, gender, age of participants, sample size, the number of MetS cases, dietary Ca intake assessment method, diagnostic criteria of MetS, the OR with corresponding 95 % CI and adjustment for the most confounders. The OR for the highest v. the lowest category of Ca intake were extracted, except for the OR (95 % CI) from Kim et al. ( Reference Kim, Chon and Noe 29 ). We extracted the OR for the second-highest v. the lowest category of Ca intake in that study in order to align the range of the highest category between included studies.
For dose–response analysis, the number of cases and participants and the OR (95 % CI) for each category of dietary Ca intake were extracted. The median or mean level of dietary Ca for each category was assigned to the corresponding OR for every study. For quantile-based data, if numbers of cases and participants were not provided, groups were assumed to be of equal size( Reference Bekkering, Harris and Thomas 19 ).
The cross-sectional study quality assessment criteria recommended by the Agency for Healthcare Research and Quality( Reference Zeng, Zhang and Kwong 20 ) were used to assess the quality of the included literature.
Statistical analysis
Pooled measurement was calculated as the inverse variance-weighted mean of the logarithm of OR with 95 % CI to assess the strength of association between dietary Ca and MetS. The DerSimonian and Laird random-effect model was used to combine study-specific OR (95 % CI)( Reference Higgins, Thompson and Deeks 21 ). The I 2 statistic was adopted to describe the proportion of total variation in study estimates that is due to heterogeneity rather than chance( Reference Higgins and Thompson 22 ). I 2 lies between 0 and 100 %, with I 2 values of 25, 50 and 75 % representing low, moderate and high heterogeneity, respectively( Reference Higgins, Thompson and Deeks 21 ). The random-effect model was adopted as the pooling method if substantial heterogeneity was present (I 2>50 %) was found; otherwise, the fixed-effect model was used. Meta-regression with restricted maximum likelihood estimation was performed to explore the potentially important covariates that might exert substantial impacts on between-study heterogeneity( Reference Higgins and Thompson 23 ). Subgroup analysis was performed by continent, gender, dietary Ca assessment and adjustment for BMI and exercise. The leave-one-out sensitivity analysis( Reference Patsopoulos, Evangelou and Ioannidis 24 ) was performed to evaluate the key studies that have important impacts on between-study heterogeneity. Influence analysis was performed with one study removed at a time to assess whether the results could have been affected markedly by a single study. The funnel plot and Egger’s test were used to examine publication bias( Reference Egger and Schneider 25 ).
For dose–response analysis, a two-stage random-effects dose–response meta-analysis( Reference Orsini, Li and Wolk 26 ) was performed. In the first stage, a restricted cubic spline model with three knots at the 10th, 50th and 90th percentiles( Reference Harrell, Lee and Pollock 27 ) of the levels of dietary Ca was estimated using generalized least-squares regression, taking into account the correlation within each set of published OR. Then the study-specific estimates were combined using the restricted maximum likelihood method in a multivariate random-effects meta-analysis( Reference Jackson, White and Thompson 28 ). A P value for non-linearity was calculated by testing the null hypothesis that the coefficient of the second spline is equal to 0.
All statistical analyses were performed with statistical software package Stata version 15.0. All reported probabilities (P values) were two-sided, with P<0·05 considered statistically significant.
Results
Literature search and study characteristics
According to our search strategy, 23 745 articles were identified, of which there were 10 748 articles from Web of Science, 9927 articles from Embase, 3067 articles from PubMed and three articles from reference lists. After deleting the duplications, 16 462 articles were left. After reviewing the titles and abstracts, fifty-three articles were retrieved. We further excluded forty-four articles; the reasons for their exclusion are detailed in the online supplementary material, Table S2. The detailed processes of the database search are shown in Fig. 1.
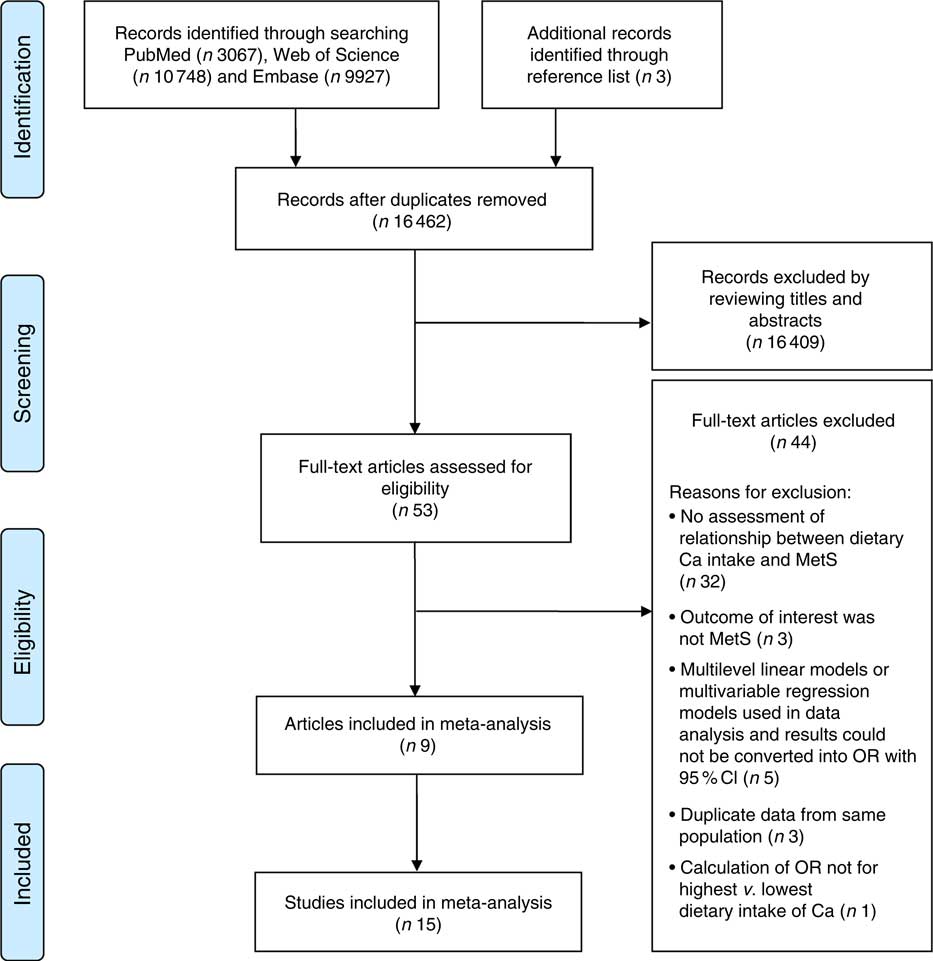
Fig. 1 Flow diagram of the literature search for studies on the association between dietary calcium intake and the risk of metabolic syndrome (MetS) included in the present meta-analysis
As a result, nine articles( Reference Al-Daghri, Khan and Alkharfy 11 – Reference Bruscato, Vieira and do Nascimento 18 , Reference Kim, Chon and Noe 29 ) with fifteen cross-sectional studies according to gender were included in the meta-analysis. With regard to the study region, twelve studies( Reference Al-Daghri, Khan and Alkharfy 11 , Reference Kim, Yang and Kim 12 , Reference Shin, Kim and Lee 14 , Reference Cho, Park and Shin 15 , Reference Motamed, Ebrahimi and Safarian 17 , Reference Kim, Chon and Noe 29 ) were conducted in Asia, two studies( Reference Liu, Song and Ford 13 , Reference Bruscato, Vieira and do Nascimento 18 ) in the Americas and one study( Reference Pannu, Zhao and Soares 16 ) in Oceania.
Dietary Ca intake was measured by two methods, one is 24 h dietary recall( Reference Al-Daghri, Khan and Alkharfy 11 , Reference Cho, Park and Shin 15 – Reference Bruscato, Vieira and do Nascimento 18 , Reference Kim, Chon and Noe 29 ) and the other is FFQ( Reference Kim, Yang and Kim 12 – Reference Shin, Kim and Lee 14 ). There were two sets of diagnostic criteria applied for MetS: one is the National Cholesterol Education Program Adult Treatment Panel III (NCEP-ATP III)( Reference Kim, Yang and Kim 12 – Reference Cho, Park and Shin 15 , Reference Kim, Chon and Noe 29 ); the other is the International Diabetes Federation (IDF)( Reference Al-Daghri, Khan and Alkharfy 11 , Reference Motamed, Ebrahimi and Safarian 17 , Reference Bruscato, Vieira and do Nascimento 18 ). The primary potential confounders including age, sex, energy intake, BMI or body weight, exercise and smoking were accounted for in all studies. The quality assessment score of each study was 8, indicating that the methodological quality was generally good (see online supplementary material, Table S3). The characteristics of the studies are presented in Table 1.
Table 1 Characteristics of studies included in the present meta-analysis on the association between dietary calcium intake and the risk of metabolic syndrome
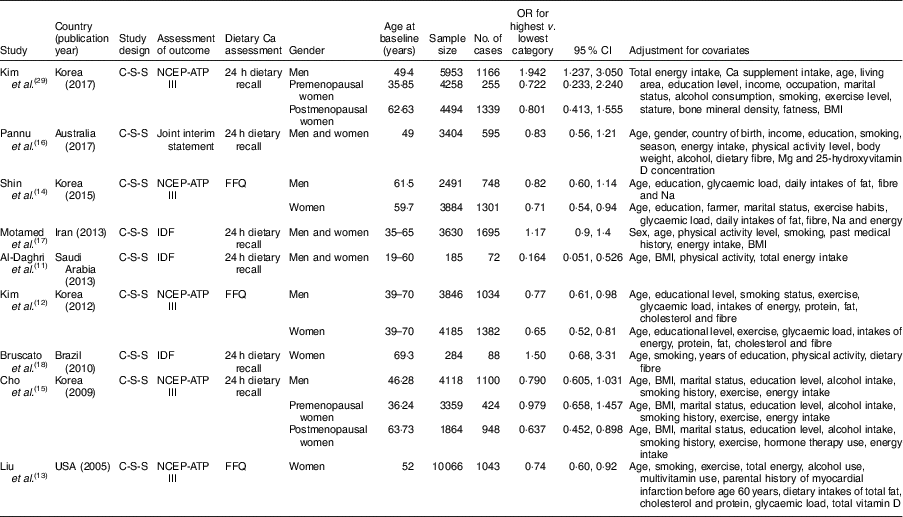
C-S-S, cross-sectional study; NCEP-ATP III, National Cholesterol Education Program Adult Treatment Panel III; Joint interim statement, a joint interim statement of several major organizations for the clinical diagnosis of metabolic syndrome (Alberti et al., 2009, PMID 19805654); IDF, International Diabetes Federation.
Quantitative synthesis
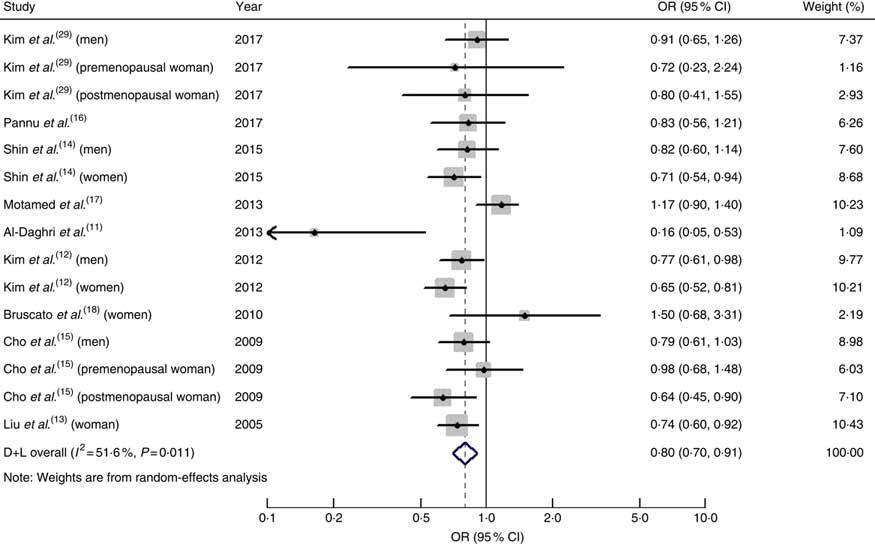
The pooled OR of MetS for the highest v. the lowest dietary intake of Ca was 0·80 (95 % CI 0·70, 0·91; I 2=51·6 %, P heterogeneity=0·011; Fig. 2).
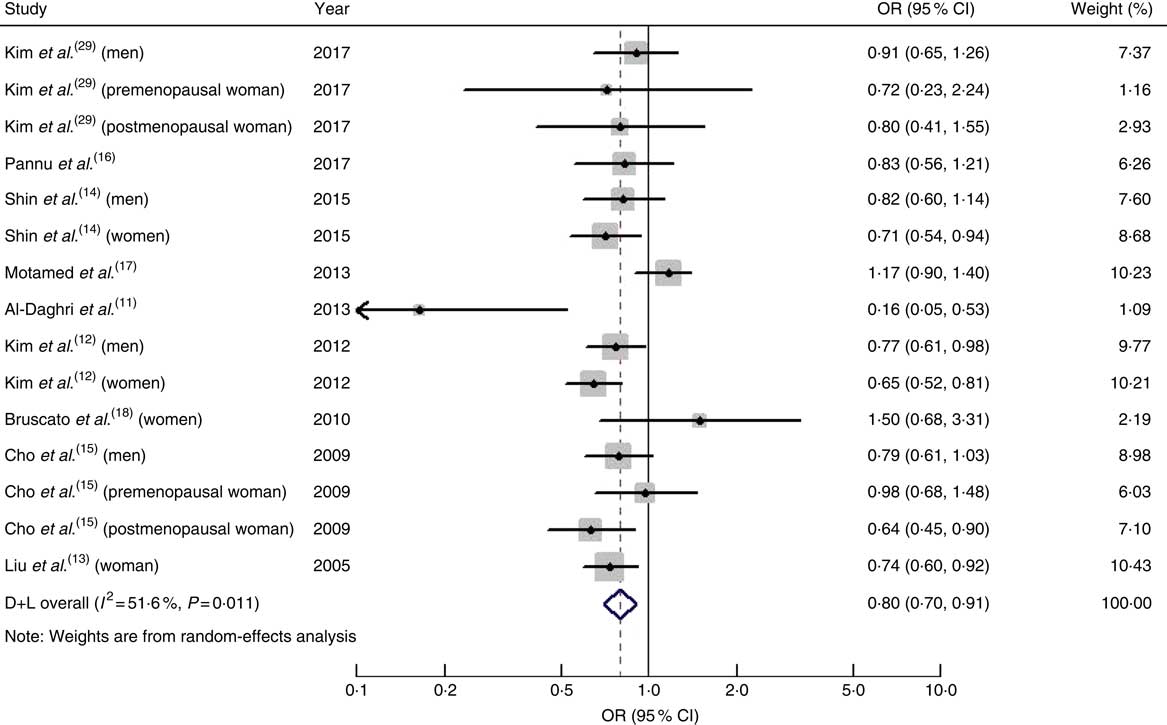
Fig. 2 (colour online) Forest plot for the pooled OR and 95 % CI of studies on dietary calcium intake and metabolic syndrome. The study-specific OR and 95 % CI are represented by the black diamond and horizontal line, respectively; the area of the grey square is positively proportional to the specific-study weight to the overall meta-analysis. The centre of the open diamond and the dashed vertical line represent the pooled OR, and the width of the open diamond represents the pooled 95 % CI. D+L denotes the random-effect model
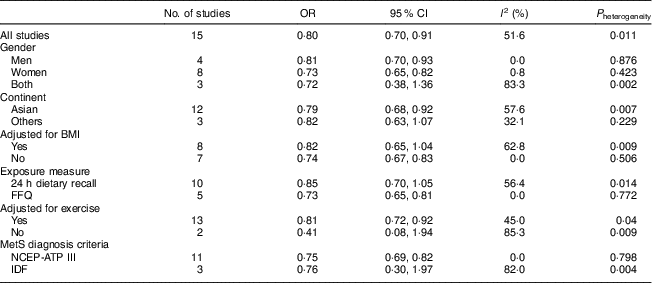
When we performed subgroup analysis by geographical region, the OR were 0·79 (95 % CI 0·68, 0·92; I 2=57·6 %, P heterogeneity=0·007) for studies conducted in Asia and 0·82 (95 % CI 0·63, 1·07; I 2=32·1 %, P heterogeneity=0·229) for studies conducted on other continents.
When men and women were analysed separately, the pooled OR of the risk of MetS was 0·81 (95 % CI 0·70, 0·93; I 2=0·00 %, P heterogeneity=0·876) in men and 0·73 (95 % CI 0·65, 0·82; I 2=0·8 %, P heterogeneity=0·423) in women.
Summary risk estimates of MetS for dietary Ca intake by study characteristics are presented in Table 2.
Table 2 Summary estimates for risk of metabolic syndrome (MetS) with dietary calcium intake according to study characteristics
NCEP-ATP III, National Cholesterol Education Program Adult Treatment Panel III; IDF, International Diabetes Federation.
For dose–response analysis, data from eight articles( Reference Kim, Yang and Kim 12 – Reference Bruscato, Vieira and do Nascimento 18 , Reference Kim, Chon and Noe 29 ) including fourteen studies were used. A non-linear relationship was found between dietary intake of Ca and risk of MetS (P non-linearity<0·001); the OR (95 % CI) of MetS were 0·97 (0·93, 1·01), 0·87 (0·82, 0·93), 0·82 (0·76, 0·89), 0·87 (0·79, 0·95) and 0·92 (0·82, 1·02) for dietary Ca intake of 79, 279, 534, 699 and 800 mg/d, respectively (Fig. 3). The threshold was in the region of 280 mg/d, with the reduction of MetS risk by 13 %. Characteristics of studies and participants included in the dose–response analysis of the association between dietary Ca intake and risk of MetS are given in the online supplementary material, Table S4.
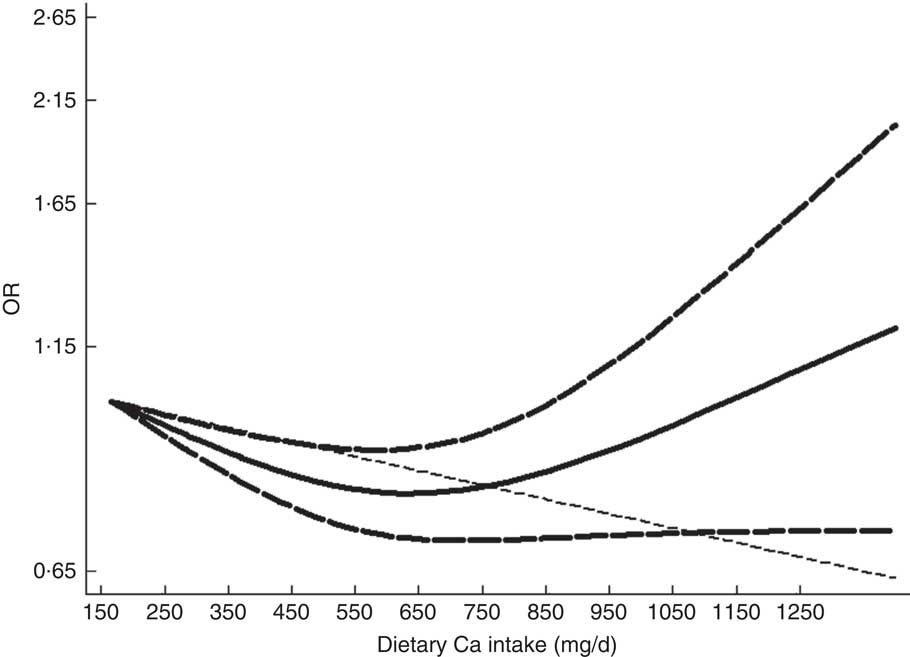
Fig. 3 The dose–response analysis of dietary calcium intake and the risk of metabolic syndrome.
![]() represents the OR and
represents the OR and
![]() represent the 95 % CI (spline model);
represent the 95 % CI (spline model);
![]() line represents the linear relationship (linear model)
line represents the linear relationship (linear model)
Meta-regression and sensitivity analysis
Moderate heterogeneity was found in the analysis of dietary Ca intake (I 2=67·4 %, P heterogeneity<0·001) and risk of MetS. Univariate meta-regression analysis, including covariates of publication year (P=0·687), continent (P=0·818), gender (P=0·651), sample size (P=0·93), number of cases (P=0·937) and dietary assessment method (P=0·145), showed that no covariate had a significant impact on between-study heterogeneity. The leave-one-out sensitivity analysis indicated that the study conducted by Motamed et al.( Reference Motamed, Ebrahimi and Safarian 17 ) contributed to the between-study heterogeneity. After excluding that study, the heterogeneity decreased (I 2=18·30 %, P heterogeneity=0·254); the pooled OR (95 % CI) were 0·80 (0·70, 0·91) and 0·76 (0·69, 0·84) before and after the removal of that study, respectively. Although the pooled OR was increased slightly, the strength of the association did not change obviously.
Influence analysis and publication bias
No individual study had an excessive influence on the pooled effect between dietary Ca intake and risk of MetS in influence analysis (see online supplementary material, Fig. S1). The visual inspection of the funnel plot (Fig. S2) and Egger’s test (P=0·659) showed no evidence of significant publication bias in the analysis between dietary Ca intake and risk of MetS.
Discussion
To our knowledge, the present meta-analysis is the first to quantitatively evaluate the association of dietary Ca intake with risk of MetS. The results indicated that dietary Ca intake was significantly associated with a decreased risk of MetS. The association of dietary Ca intake with the risk of MetS was significant in women and among studies conducted in Asia. For dose–response analysis, a non-linear relationship was found between dietary intake of Ca and risk of MetS (P non-linearity<0·001). The association became significant when the dietary Ca intake was above 280 mg/d and below 850 mg/d. The risk of MetS increased when dietary Ca intake exceeded 1200 mg/d, but was not statistically significant (OR=1·27; 95 % CI 0·97, 1·66).
Several biological mechanisms for the inverse relationship of Ca with the development of MetS have been proposed. First, Ca is essential for insulin-mediated intracellular processes. Intracellular Ca levels are tightly controlled within a narrow range to maintain insulin signalling transduction. Ca deficiency may lead to the secretion of parathyroid hormone and increase intracellular Ca2+ influx, inducing cellular Ca overload and impaired insulin sensitivity( Reference Zemel 30 ). Second, animal studies indicated a key role for intracellular Ca2+ in the regulation of adipocyte metabolism( Reference Zemel 31 ). Increased dietary Ca reduces intracellular Ca2+ influx, decreasing fatty acid synthesis and increasing lipolysis, leading to decreased TAG stores( Reference Zemel 30 , Reference Zemel 32 ). Third, Ca intake may down regulate the renin–angiotensin–aldosterone system and improve the Na–K balance, thereby lowering blood pressure( Reference Resnick 33 ). Fourth, Ca may be related to intestinal binding to fatty acids or bile acids, thereby decreasing fat absorption and reducing cholesterol levels( Reference van Meijl, Vrolix and Mensink 34 ). Fifth, Ca may be a contributor to the prevention of obesity via the suppression of 1,25-dihydroxyvitamin D( Reference Zemel 30 ).
Between-study heterogeneity is common in meta-analysis because of characteristics of the sample, diversity in population stratification, measurement of Ca intake, variation of the covariates, etc. Moderate heterogeneity was found in the present meta-analysis. Thus, we used univariate meta-regression to explore the source of heterogeneity. Meta-regression did not find the covariates of sample size, publication year, gender, continent, dietary assessment method and number of cases as important contributors to the heterogeneity. In the leave-one-out sensitivity analysis, one study was found to be a contributor to the between-study heterogeneity. After excluding that study, the pooled OR was 0·76 (95 % CI 0·69, 0·84). The heterogeneity decreased; the result was stable, however.
Our study has several strengths. First, the present meta-analysis included a large number of participants, allowing a much greater possibility of reaching a reasonable conclusion. The quality assessment score of each study was not less than 7, indicating that the methodological quality was generally good. Second, primary potential confounders in original studies were fully taken into account. Age, gender and exercise have been adjusted for in all included studies. Total energy intake and BMI (or body weight) have been adjusted for in all included studies, with the exception of one study that made no adjustment for total energy intake and another one study that made no adjustment for BMI (or body weight), respectively. Moreover, smoking has been adjusted for in most studies. The mean quality score of included studies was 8 (the maximum score is 11 points), indicating that the results were more credible. Third, a dose–response analysis was performed to find a quantitative estimation of the association between MetS and dietary Ca intake.
Nevertheless, our meta-analysis has several limitations. First, it was based on cross-sectional studies, which could only demonstrate associations but could not derive causal relationships, and therefore did not warrant a causal inference. Second, potential confounders adjusted for in each study were different and it might have affected the results to some extent, and residual confounding should be of concern as well. The pooled OR were 0·82 (95 % CI 0·65, 1·04; I 2=62·8 %, P heterogeneity=0·009) for studies adjusting for BMI and 0·74 (95 % CI 0·67, 0·83; I 2=0·00 %, P heterogeneity=0·506) for those without adjustment for BMI. Our pooled OR was underestimated by about 8·1 % when compared with the OR for BMI-adjusted. When compared with exercise-adjusted, our pooled OR was underestimated by about 1·25 %. Third, the assessment methods of dietary Ca intake were different, which might lead to unstable results to some extent. When stratified by dietary Ca assessment methods, the pooled OR was 0·85 (95 % CI 0·70, 1·05; I 2=56·4 %, P heterogeneity=0·014) by using 24 h dietary recall. A significant association was found for studies using FFQ (OR=0·73; 95 % CI 0·65, 0·81; I 2=0·00 %, P heterogeneity=0·772). Perhaps the reason is that the food frequency method is more representative of the long-term food intake than the 24 h recall method. As a result, our pooled OR was underestimated by about 9·6 % when compared with the OR based on the FFQ method. Fourth, the diagnostic criteria of MetS were different and use of the NCEP-ATP III was more common in diagnosing MetS. When stratified by the diagnostic criteria of MetS, the pooled OR was 0·76 (95 % CI 0·30, 1·97; I 2=82 %, P heterogeneity=0·004) by IDF. A significant association was found for studies using NCEP-ATP III (OR=0·75; 95 % CI 0·69, 0·82; I 2=0·00 %, P heterogeneity=0·798). Compared with OR based on NCEP-ATP III, our pooled OR was underestimated by about 6·7 %.
Conclusion
In conclusion, the findings from the present meta-analysis provide evidence that dietary Ca intake is inversely associated with the prevalence of MetS. Further studies, especially well-designed prospective cohort studies and studies involving the association of Ca intake through diet and Ca concentration in serum, would provide stronger evidence.
Acknowledgements
Financial support: This research received no specific grant from any funding agency in the public, commercial or not-for-profit sectors. Conflict of interest: None. Authorship: L.C. and W.J. designed the study, participated in its design, coordination and interpretation of the data, and were involved in drafting the manuscript or revising it critically for important intellectual content. L.C. and D.H. performed the bibliographical search, data extraction and interpretation of the data. Ethics of human subject participation: Not applicable.
Supplementary material
To view supplementary material for this article, please visit https://doi.org/10.1017/S1368980019000247


