INTRODUCTION
There has been a rise in tuberculosis (TB) notifications in the UK since 1987 [1]. However, excluding TB in London, rates of TB in the UK are relatively low and stable. In the context of North East (NE) London, high rates of TB are observed in some primary care trust areas (PCTs) whilst in others rates are relatively low [2]. This demonstrates the complexity of TB epidemiology in the UK and London and is suggestive of a range of factors that give rise to high rates of TB in specific geographical areas.
As TB is a notifiable disease specialist TB healthcare professionals report demographic and clinical variables of patients who are notified to public health authorities. The Enhanced Tuberculosis Surveillance (ETS) system was introduced in 1999 to aid notification [Reference Van3]. These collected data show the different demographic and clinical profiles of patients observed in NE London and may account for variations in TB rates. This is a valuable health information source, for example, in identifying commissioning priorities for different PCTs. This requires appropriate statistical support and effective communication to decision makers [4, 5]. However, analysis of large amounts of data with a large proportion of categorical/nominal data (e.g. gender, ethnicity, etc.) that can display multiple associations may prove to be difficult to interpret if bivariate comparisons are made. Factor analysis and principal components analysis (PCA) are inappropriate methods of analysis for these data which include a mix of continuous and categorical data. Multiple correspondence analysis (MCA) is an analytical method that allows analysis of multiple categorical variables [Reference Greenacre6]. The usefulness of this method lies in its reduction of large quantities of data and inclusion of any number of categorical variables although it does not provide a statistical assessment of association. We demonstrate the use of MCA as a tool for performing epidemiological ‘mapping’ of TB patient variables. This may prove to be useful in identifying commissioning priorities in NE London.
METHOD
MCA
Greenacre [Reference Greenacre7] describes correspondence analysis (CA) in its simplest form as a two-way cross-tabulation summarizing the distribution of frequencies to display a data ‘map’ in two-dimensional space. MCA is the multivariable extension of CA that allows explanation of relationships between two or more variables [Reference Kaciak and Louviere8]. By including more than two variables in this type of analysis the complexity is increased; relationships between variables are described in terms of the variance of data. As this technique involves categorical variables the variance of the data, specific to each variable category, can be plotted in dimensional space; the variance for each category can be ‘averaged’ to one point in space (the centroid). This results in two graphical outputs – object plots which show the spread of category data variance, and variable plots which can display joint category plots. The latter is useful in that entered variables may then be described by the proximity of variable categories to other categories' points, their inertia (degree of variance), and whether they lie along particular dimensions in common with other category points. This technique differs from PCA in that it permits analysis of multiple categorical variables [Reference Howe, Hargreaves and Huttly9]. However, continuous data, such as age, may be categorized and entered for analysis. For a full description of the use of MCA see Greenacre [Reference Greenacre6].
Analytical strategy
Data from the ETS dataset for NE London between the years 2002 and 2007 were selected and entered for analysis; this included data for seven PCTs. Denotified TB cases, where initial TB diagnosis was later changed, were excluded (n=441). Data were entered into a data-frame in SPSS (version 14.0; SPSS Inc., USA) for analyses. After categorizing continuous data (patient age), data were entered for MCA using the ‘optimal scaling’ option in SPSS. A two-dimensional graphical output plot of data displaying variable categories was selected (variable plot – joint category plot function in SPSS).
RESULTS
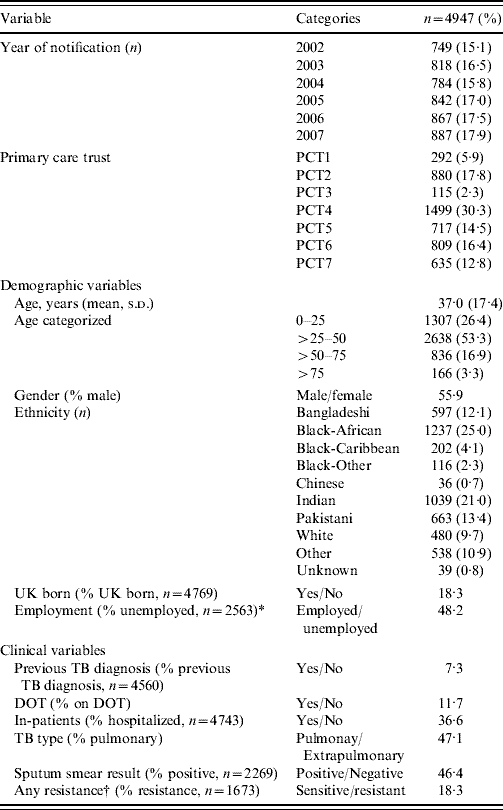
Data for 4947 TB patients between the years 2002 and 2007 were entered for analysis. In this cohort of patients, male gender was slightly more common and the three most common ethnicities were Black African, Indian Asian, and Pakistani Asian; only 18·3% of patients were born in the UK (Table 1). A minority of patients (11·7%) had their consumption of treatment supervised by directly observed treatment (DOT) and over a third of patients were hospitalized. For three variables in particular (Table 1: employment, sputum smear test, bacterial resistance) there were large amounts of missing data. However, for data available, 46·4% of patients tested had a positive sputum smear result (n=2269) and 18·3% of patients exhibited TB strains of any bacterial resistance to first-line TB medicines (n=1673).
Table 1. Demographic and clinical TB patient data, 2002–2006

DOT, Directly observed treatment.
Percentages calculated from n=4947 unless other sample size quoted due to missing data.
* Employment excluding children, retired, housewives, asylum seekers or any ambiguity regarding current employment.
† ‘Any resistance’ refers to resistance to any of isoniazid, rifampicin, streptomycin, ethambutol, pyrazinamide.
MCA was used to analyse these data in three ways: data were entered for analysis in their entirety, data were analysed by PCT, and data were analysed by year.
Complete dataset analysis
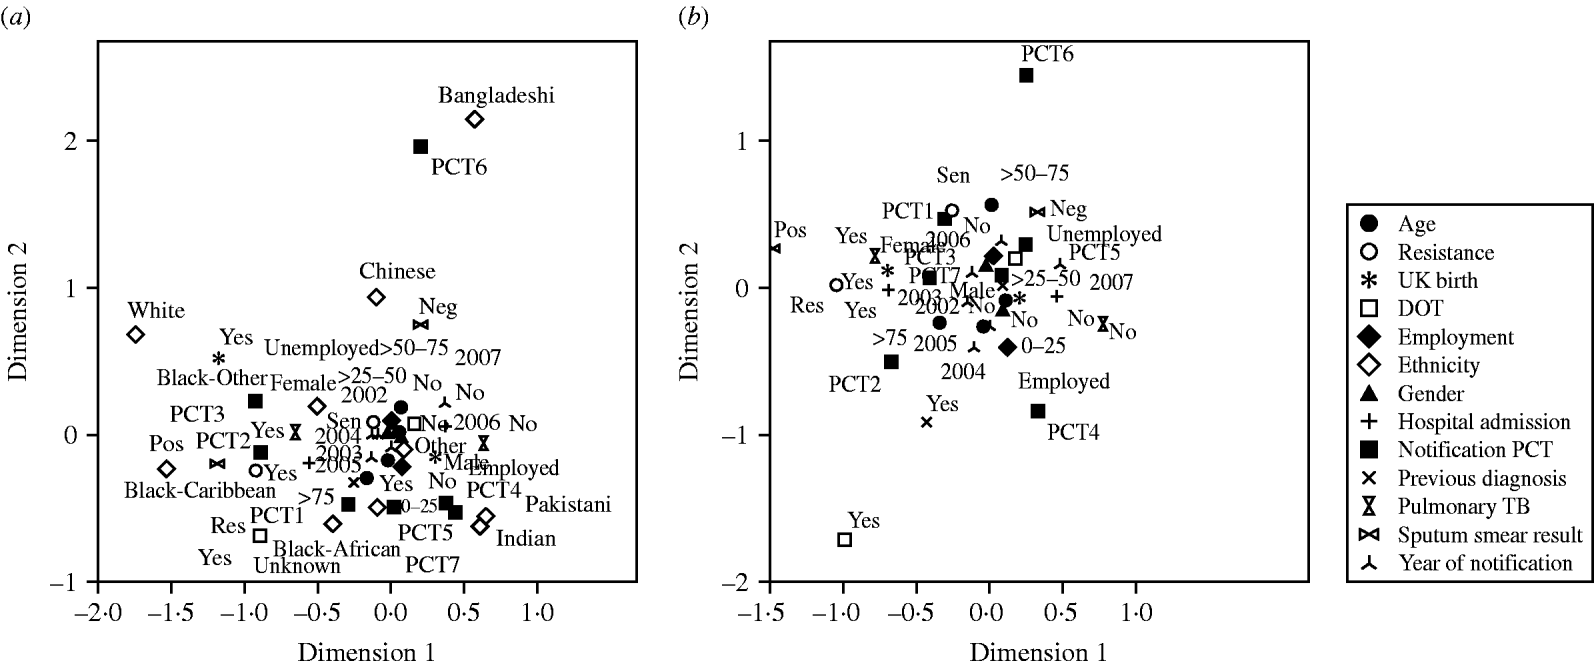
When all of the data were analysed together the joint category plot was complex and difficult to interpret reliably (Fig. 1a). However, PCT6 associated with ‘Bangladeshi’ ethnicity as an outlying group. This finding demonstrated the known higher prevalence of Bangladeshi TB patients in this PCT [10]. However, this strong association dominated the output. Therefore, to investigate associations between other variables without the dominating effect of ethnicity on PCT6, ethnicity was excluded and the analysis repeated (Fig. 1b). This suggested that both PCT6 and DOT (‘Yes’) categories were outliers from the dataset.

Fig. 1. Multiple correspondence analysis graphical output of TB variable categories. (a) All variables, all years. (b) All variables, all years except ethnicity.
Analysis by PCT
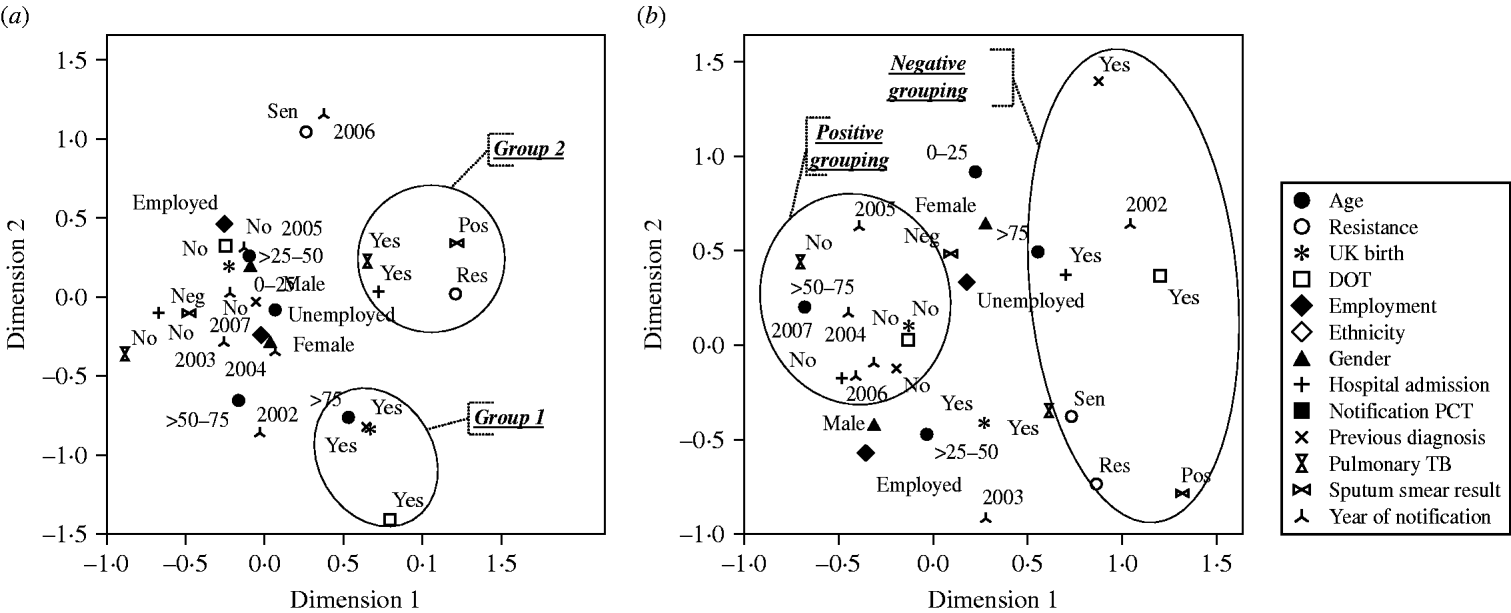
MCA was repeated by analysing by each separate PCT. Figure 2a displays an example of the output for PCT2 and is suggestive of an association between two groups of variable categories: Group 1: DOT (‘Yes’), previous diagnosis (‘Yes’), UK born (‘Yes’) and age >75 years. Group 2: hospital admission (‘Yes’), positive sputum smear result (‘Pos’), drug resistance (‘Res’) and pulmonary TB (‘Yes’). The output for PCT7 is suggestive of a division between recent and earlier years of notification (Fig. 2b). More recent years (2004–2007) appear to group with more positive variable categories such as patients not being admitted to hospital (‘No’), no previous diagnosis (‘No’) and no DOT (‘No’). Earlier years (2002–2003) appear to associate with less positive variable categories such as previous TB diagnosis (‘Yes’), DOT (‘Yes’), and positive sputum smear result (‘Pos’).

Fig. 2. Multiple correspondence analysis graphical output of TB variable categories by primary care trust (PCT). (a) PCT2; (b) PCT7.
Analysis by year
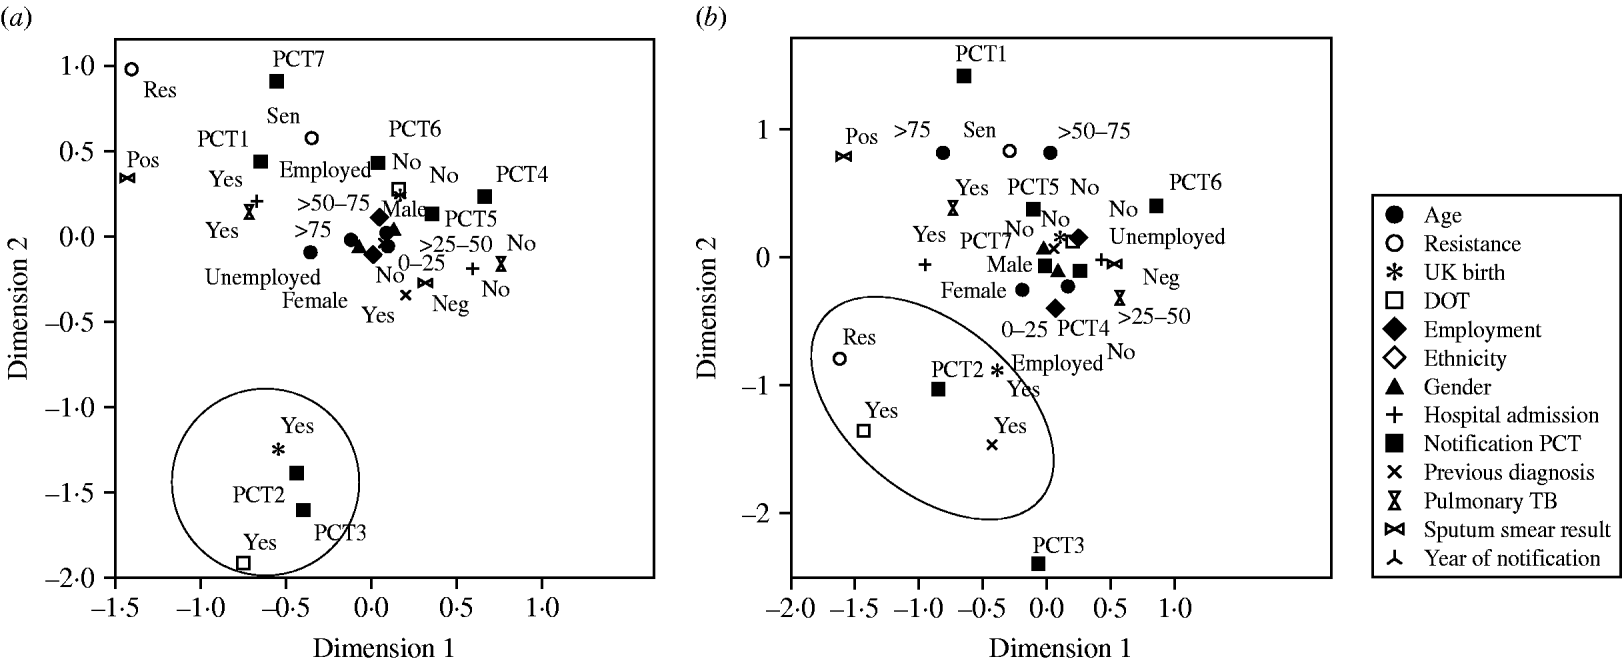
Finally, MCA was repeated by analysing by year. For example, Figure 3a displays data from 2002 with a possible association between PCT2 and PCT3 with the variable categories DOT (‘Yes’) and UK born (‘Yes’). However, in 2007 this specific grouping was not observed although PCT2 appeared to associate with DOT (‘Yes’), previous TB diagnosis (‘Yes’), UK born (‘Yes’) and resistance (‘Res’) suggesting a complex case-load for this PCT (Fig. 3b).

Fig. 3. Multiple correspondence analysis graphical output of TB variable categories by year. (a) 2002; (b) 2007.
DISCUSSION
A commissioning framework report published by the Department of Health and informed by the governmental White Paper ‘Our health, our care, our say: a new direction for community services’ [4] highlighted the need for understanding the requirements of both populations and individuals as well as more effective sharing and use of information [5]. Data reported by healthcare systems is used to inform decisions concerning the commissioning of health services. Although these processes tend to be quite blunt, nevertheless, health commissioning would be ill-informed without the use of such data sources. It is pertinent to identify local trends in data to best focus healthcare resources and commission services appropriately. MCA is a well reported technique for the reduction of data and has previously been utilized in a wide range of different disciplines, e.g. analysis of wealth indices [Reference Howe, Hargreaves and Huttly9], more informative analyses of data for cardiac implantable devices [Reference Guéguin11], and investigations into subjective well-being, poverty and ethnicity [Reference Neff12]. This technique has previously been advocated for its use in the analysis of large datasets of categorical data, identifying themes according to data variance, and for scaling methods.
The current study used MCA to epidemiologically ‘map’ data that related to TB patients in NE London between 2002 and 2007. This identified a number of trends between data variables, differences between PCTs, and changes over time. For example, there appeared to be an association between patients that were born in the UK, patients that received DOT, and patients that were admitted to hospital. There may also be links between these variable categories and resistance to anti-tuberculous drugs and higher age group (>75 years). These associations are rational in that, within the TB population in London where most patients were born outside the UK, UK-born patients who contract TB are more likely to be older due to reactivation of disease rather than primary infection, and older patients are more likely to be admitted to hospital. MCA output for one PCT (PCT7) appeared to suggest recent improvement in that more positive variable categories, such as no hospital admission, associated closer to recent year categories (2004–2007) whereas less positive categories, such as previous TB diagnosis, associated closer to earlier year categories (2002–2003).
When analysed by year a similar grouping of more negative variable categories with two PCTs in particular (PCT2 and PCT3) was observed in 2002, and a similar grouping again observed for one of these PCTs (PCT2) in 2007. This suggests that cohorts of patients located within these PCTs had a greater burden of patients with complex needs in terms of provision of DOT and managing drug resistance, and that this issue had probably been resolved over time for PCT3. This clearly has resource implications. Treating patients with drug resistance, for example, has been estimated to be ten times the cost of treating a patient with drug-sensitive forms of TB [Reference White and Moore-Gillon13]. Therefore, year-by-year analyses of this kind may inform where priorities lie. The various associations can be validated with further investigation to identify whether there are indeed greater priorities for certain PCTs in relation to specific patient groups and this, in turn, can inform commissioning priorities.
With such a large dataset where small associations are more likely to achieve statistical significance, MCA provides meaningful analyses that account for interactions between variables in the dataset as a whole. Another benefit of MCA is that it allows analysis of numerous variables of a categorical nature – the only continuous variable in the current study was patient age which was categorized for analysis. Analysis of a wider set of more descriptive variables in the current study, focusing on other aspects of patient complexity, for example, would better inform TB priorities for each PCT. However, to our knowledge, this is the first instance of an analysis of this type being performed with the explicit aim of identifying commissioning priorities. In addition, we believe this to be the first reporting of a TB dataset in this way.
A number of variables had large amounts of missing data. For example, sputum smear results and results for drug sensitivities were available for less than half of the cohort. This may relate to such results only having been recorded by TB services when they were deemed of clinical importance, such as resistance to a particular drug (recording only where tests had been performed and results obtained). However, it implies that these variables, in particular, were not reliably reported. Better recording of data would help to ensure that analyses were more reliable. Interestingly, MCA is a method used to explore patterns of missing data by categorizing missing data and including it in analyses, e.g. see Greenacre [Reference Greenacre7]. This technique could have been applied for the current dataset to assess whether missing data for specific variables differed from data that were better reported. Although this was beyond the aim of our study we are currently assessing data from the ETS dataset to better understand what the missing data might represent and, therefore, clarify reasons for non-reporting of data. In the current study only two-dimensional analyses were carried out to simplify the interpretation of results. In reality, the association between variables may be multidimensional and reveal further relationships between variable categories. However, for the purposes of using MCA as a commissioning tool multidimensional analyses are unlikely to be of significant added benefit.
In conclusion, we present an analytical technique that allows analysis of multiple datasets that can contain different data types. This tool can be used as an epidemiological method to inform commissioning priorities in healthcare such as TB service provision. Whilst users should be aware of the limitations, MCA is an efficient technique that effectively produces a data map displaying association. This may be of particular use where large amounts of heterogenous data are available.
ACKNOWLEDGMENTS
Our thanks to the continued efforts of TB Services in North East London without whose help this work could not have been conducted.
DECLARATION OF INTEREST
T.W.R. and W.R. are both employed on a full-time basis by the National Health Service.


