

In the original article, Figure 4 was replicated for Figures 5, 6 and 9. The authors and the publishers would like to apologise for this error. The correct Figures are shown below.

Fig. 1. Total negative symptoms over 2-years of EI.

Fig. 2. Expressivity over 2-years of EI.

Fig. 3. Motivation over 2-years of EI.
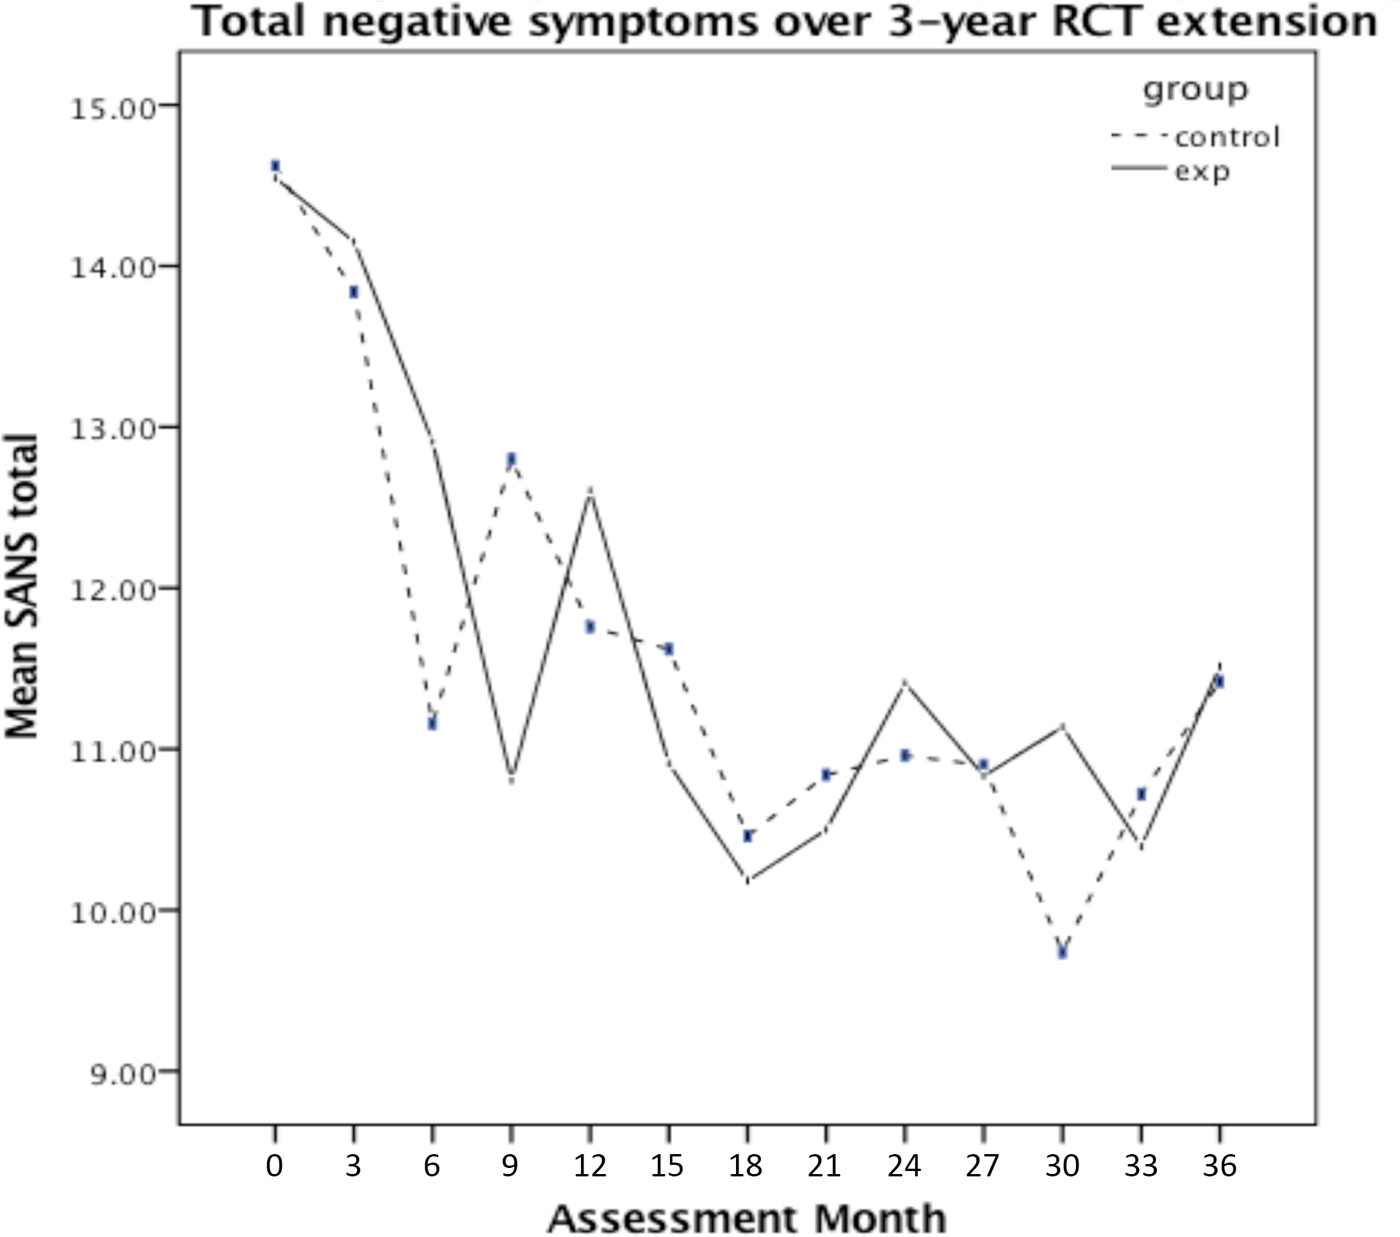
Fig. 4. Total negative symptoms over the 3-year RCT extension.

Fig. 5. Expressivity over the 3-year RCT extension.

Fig. 6. Motivation over the 3-year RCT extension.

Fig. 7. Mean total negative symptoms over the 5-year critical period. b(r) = baseline at randomization.
Fig. 8. Expressivity over the 5-year critical period. b(r) = baseline at randomization.

Fig. 9. Motivation over the 5-year critical period. b(r) = baseline at randomization.


