Introduction
Cryptobenthic fishes have been defined as adult fishes of typically <5 cm that are visually and/or behaviourally cryptic, and maintain a close association with the benthos (Depczynski & Bellwood, Reference Depczynski and Bellwood2003). Nonetheless, there are exceptions, with some species (e.g. the giant goby Gobius cobitis) reaching up to 30 cm (Gibson, Reference Gibson1970). Except for some viviparous benthic species (such as the eelpout Zoarces viviparus), most of them have a bipartite life cycle, with a pelagic larval phase that ends at reef settlement (Leis, Reference Leis and Sale1991), and benthic juvenile and adults. Because of the restricted movement of the latter between reefs, species rely on their pelagic larval duration to disperse and maintain biogeographic ranges as well as connectivity between populations (Riginos & Victor, Reference Riginos and Victor2001; Kohn & Clements, Reference Kohn and Clements2011).
By revealing early life history traits it is possible to understand pre-settlement processes (Bergenius et al., Reference Bergenius, Meekan, Robertson and McCormick2002; Plaza et al., Reference Plaza, Landaeta, Espinoza and Ojeda2013). A powerful tool to reveal early life traits of fishes is the analysis of otolith microstructure (Panella, Reference Panella1971; Campana & Neilson, Reference Campana and Neilson1985). These structures have identifiable banding patterns or rings of daily periodicity that reflect the punctuated nature of growth (Chambers & Miller, Reference Chambers, Miller, Secor, Dean and Campana1995), which has been validated in several cryptobenthic fish species (Mansur et al., Reference Mansur, Catalán, Plaza, Landaeta and Ojeda2013; Carvalho et al., Reference Carvalho, Moreira, Queiroga, Santos and Correia2015). By applying otolith microstructure analysis in larval stages of fish it is possible to estimate population and individual growth rates, individual size at time to hatch, yolk sac resorption and onset of exogenous feeding, mortality rates, or to separate larvae which have grown under different environmental conditions or under different moon phases (Robertson et al., Reference Robertson, Petersen and Brawn1990; Stenevik et al., Reference Stenevik, Fossum, Johannessen and Folkvord1996; Fontes et al., Reference Fontes, Santos, Afonso and Caselle2011; Landaeta et al., Reference Landaeta, López, Suárez-Donoso, Bustos and Balbontín2012; Contreras et al., Reference Contreras, Rodríguez-Valentino, Landaeta, Plaza, Castillo and Alvarado-Niño2017; La Mesa et al., Reference La Mesa, Vera-Duarte and Landaeta2017).
One large (up to 18 cm length) cryptobenthic fish typical of shallow waters of north and central Chile is the labrisomid blenny, Auchenionchus crinitus (Jenyns, 1842). This subtidal species is distributed from Pucusana, Perú (12°28′S 76°48′W) to Viña del Mar, Chile (33°01′S 71°33′W), and is sympatric with two other species of the genus Auchenionchus: A. variolosus and A. microcirrhis (Stephens & Springer, Reference Stephens and Springer1973; Sáez & Pequeño, Reference Sáez and Pequeño2009). Adult labrisomids are carnivorous, predating on crabs, shrimps, isopods and amphipods (Muñoz & Ojeda, Reference Muñoz and Ojeda1997), while larvae of A. variolosus feed mostly on eggs and nauplii of calanoid copepods (Vera-Duarte & Landaeta, Reference Vera-Duarte and Landaeta2016). Daily deposition of microincrements in the sagittae otolith has been validated for A. crinitus (Mansur et al., Reference Mansur, Catalán, Plaza, Landaeta and Ojeda2013). Nonetheless, there is a lack of information about the early life traits of A. crinitus. Therefore, the goal of this study was to analyse the early life history of this labrisomid blenny, during autumn–winter conditions, by using otolith microstructure analysis.
Materials and methods
Study area
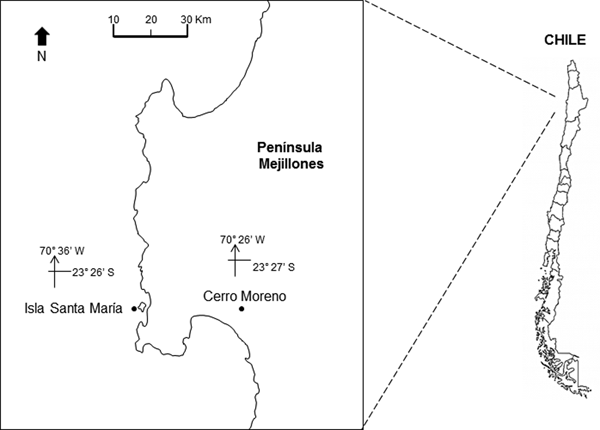
The study area is located off northern Chile (Humboldt Current System), at Isla Santa María (ISM) (23°26′S 70°36′W) in Mejillones Peninsula (Figure 1). The location is a sheltered area, with artisanal fishing, spear fishing and kelp harvesting. It is characterized by rocky bottom, barren ground and kelp forests of Lessonia trabeculata and Macrocystis integrifolia. The bathymetry does not exceed 18 m (Uribe et al., Reference Uribe, Ortiz, Macaya and Pacheco2015).
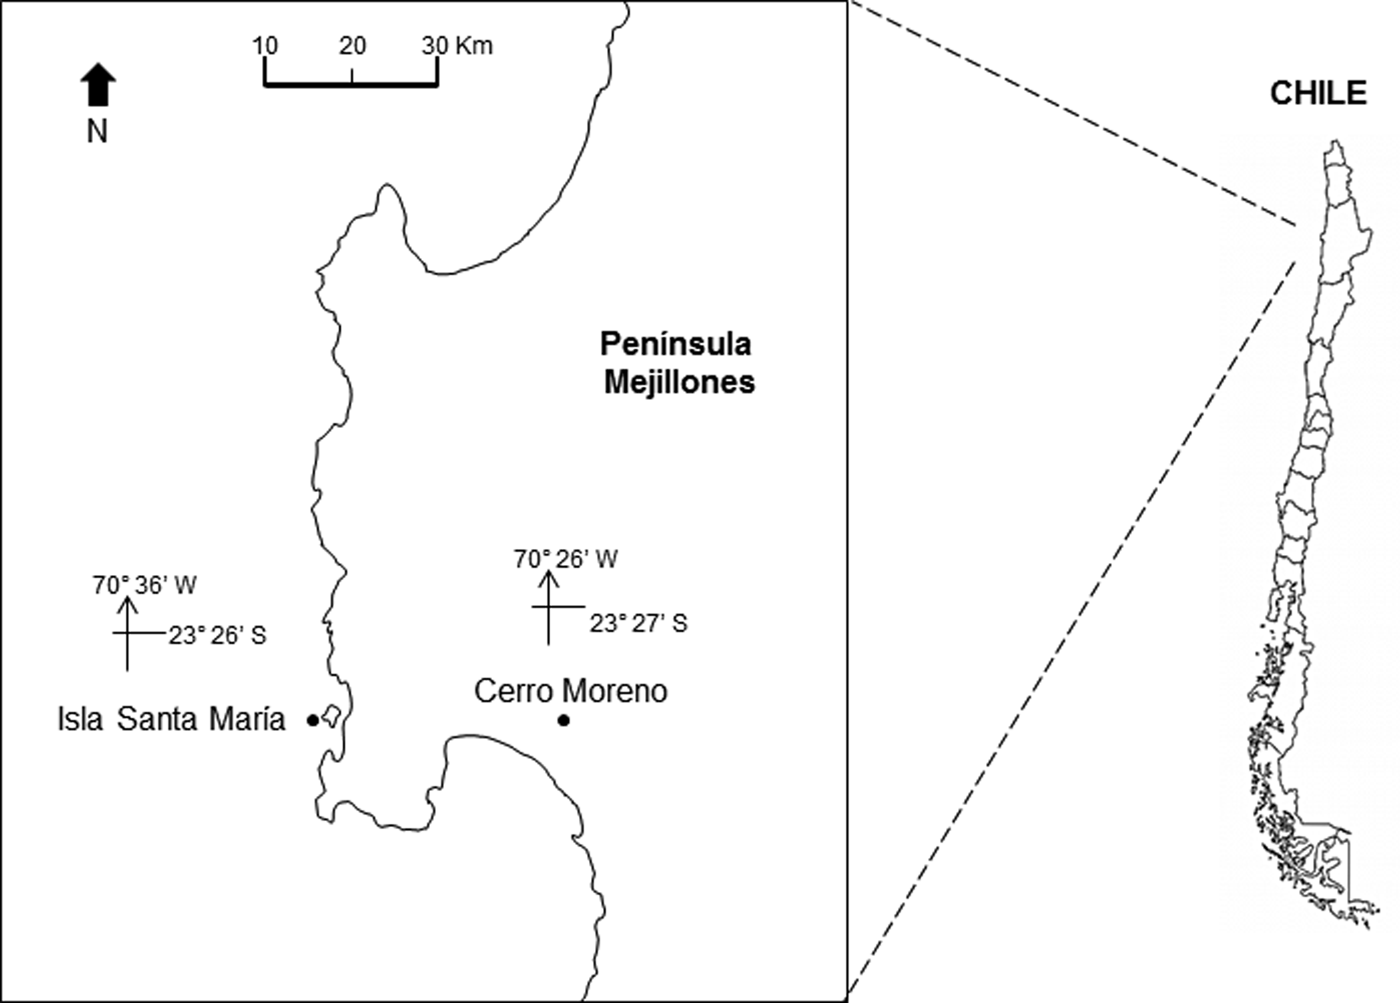
Fig. 1. Location of the study site, Isla Santa Maria (ISM), Mejillones Peninsula, Antofagasta, northern Chile. The location of the meteorological station, at Cerro Moreno airport, is also indicated.
Fieldwork
The daily prevailing wind was available from a Meteorological Station at Cerro Moreno Airport (23°27′S 70°26′W; Figure 1) supervised by the Dirección Meteorológica de Chile. The Ekman transport was estimated to assess the effect of winds on the offshore displacement of surface coastal waters. The equation M E = −τ/f was used, where M E is the Ekman transport (1000 kg m−1 s−1), f is the Coriolis parameter and −τ is the along-shore wind stress at the surface of the water (Pond & Pickard, Reference Pond and Pickard1983). Tau (τ) was estimated using the equation: τ = ρa × Cd × W; where ρa is the air density (1.2 kg m−3), Cd is the drag coefficient (0.0014) and W is the along-shore wind speed (m s−1).
Every 15 days between May (austral-autumn) and August (austral-winter) 2014, five dates (S1–S5) were sampled off ISM (Table 1). Temperature and salinity of the water column were obtained with a CTD (Seabird SBE-19 plus) at the beginning and end of every sampling day from surface to 15 m depth. Ichthyoplankton samples were collected using a Bongo net (60 cm mouth diameter; 300 µm mesh size), equipped with one TKS flow meter (The Tsurumi-Seiki Co., Ltd; Tsurumi-ku, Yokohama, Japan) to quantify the filtered water. The plankton was collected parallel to the coastline, at 1–2 knots during 10–15 min from a depth of 10–18 m to surface (double-oblique tow) during the morning, on board an artisanal boat. Every sampling date, eight collections were made. The samples were fixed with 5% formalin buffered with sodium borate (N = 40). After 24 h, formalin-fixed samples were preserved in 96% ethanol to avoid negative effects on otolith microstructure of fish larvae.
Table 1. Sampling periods, standardized abundance (ind. 100 m−3) and size structure (NL or SL, mm) of larval labrisomid Auchenionchus crinitus from northern Chile during austral autumn–winter 2014

MAD, median absolute deviation; SE, standard error.
Laboratory work
In the laboratory, all larval fish were separated, counted and identified into the lowest possible taxon. Labrisomid blenny larvae, Auchenionchus crinitus, were identified based on characteristic pigments, i.e. presence of a punctuated pigment in the base of the anus and a dendritic melanophore ventrally in the mid-tail, and genetically confirmed. Larval abundance was standardized to individuals (ind.) 100 m−3 using the flowmeter counts. The notochord length (NL), from the tip of the snout to the tip of the notochord in pre-flexion larvae or the standard length (SL), from base of the hypural bones in flexion and post-flexion larvae, was measured (N = 486) to the nearest 0.01 mm under an Olympus SZ-61 stereomicroscope with a Moticam 2500 (5.0 M pixel) video camera connected to a PC with the Moticam Image Plus 2.0 software. The larval measurements were not corrected for shrinkage.
Larval abundance per sampling day was compared using Kruskal–Wallis H test, because data departed from normality (Shapiro–Wilk test, W = 0.81, P < 0.001). Median and MAD (median absolute deviation) were used to describe basic statistics, when data departed from normality.
The left and right sagittal otoliths were removed from 405 well-preserved larvae (4.01 mm NL–12.50 mm SL; Figure 2). No previous grinding or polishing was necessary for the otolith reading. The otoliths were embedded in epoxy resin on a glass slide. The daily age was estimated by counting the number of otolith primary increments with a Motic BA310 light microscope at 1000× magnification under oil immersion.
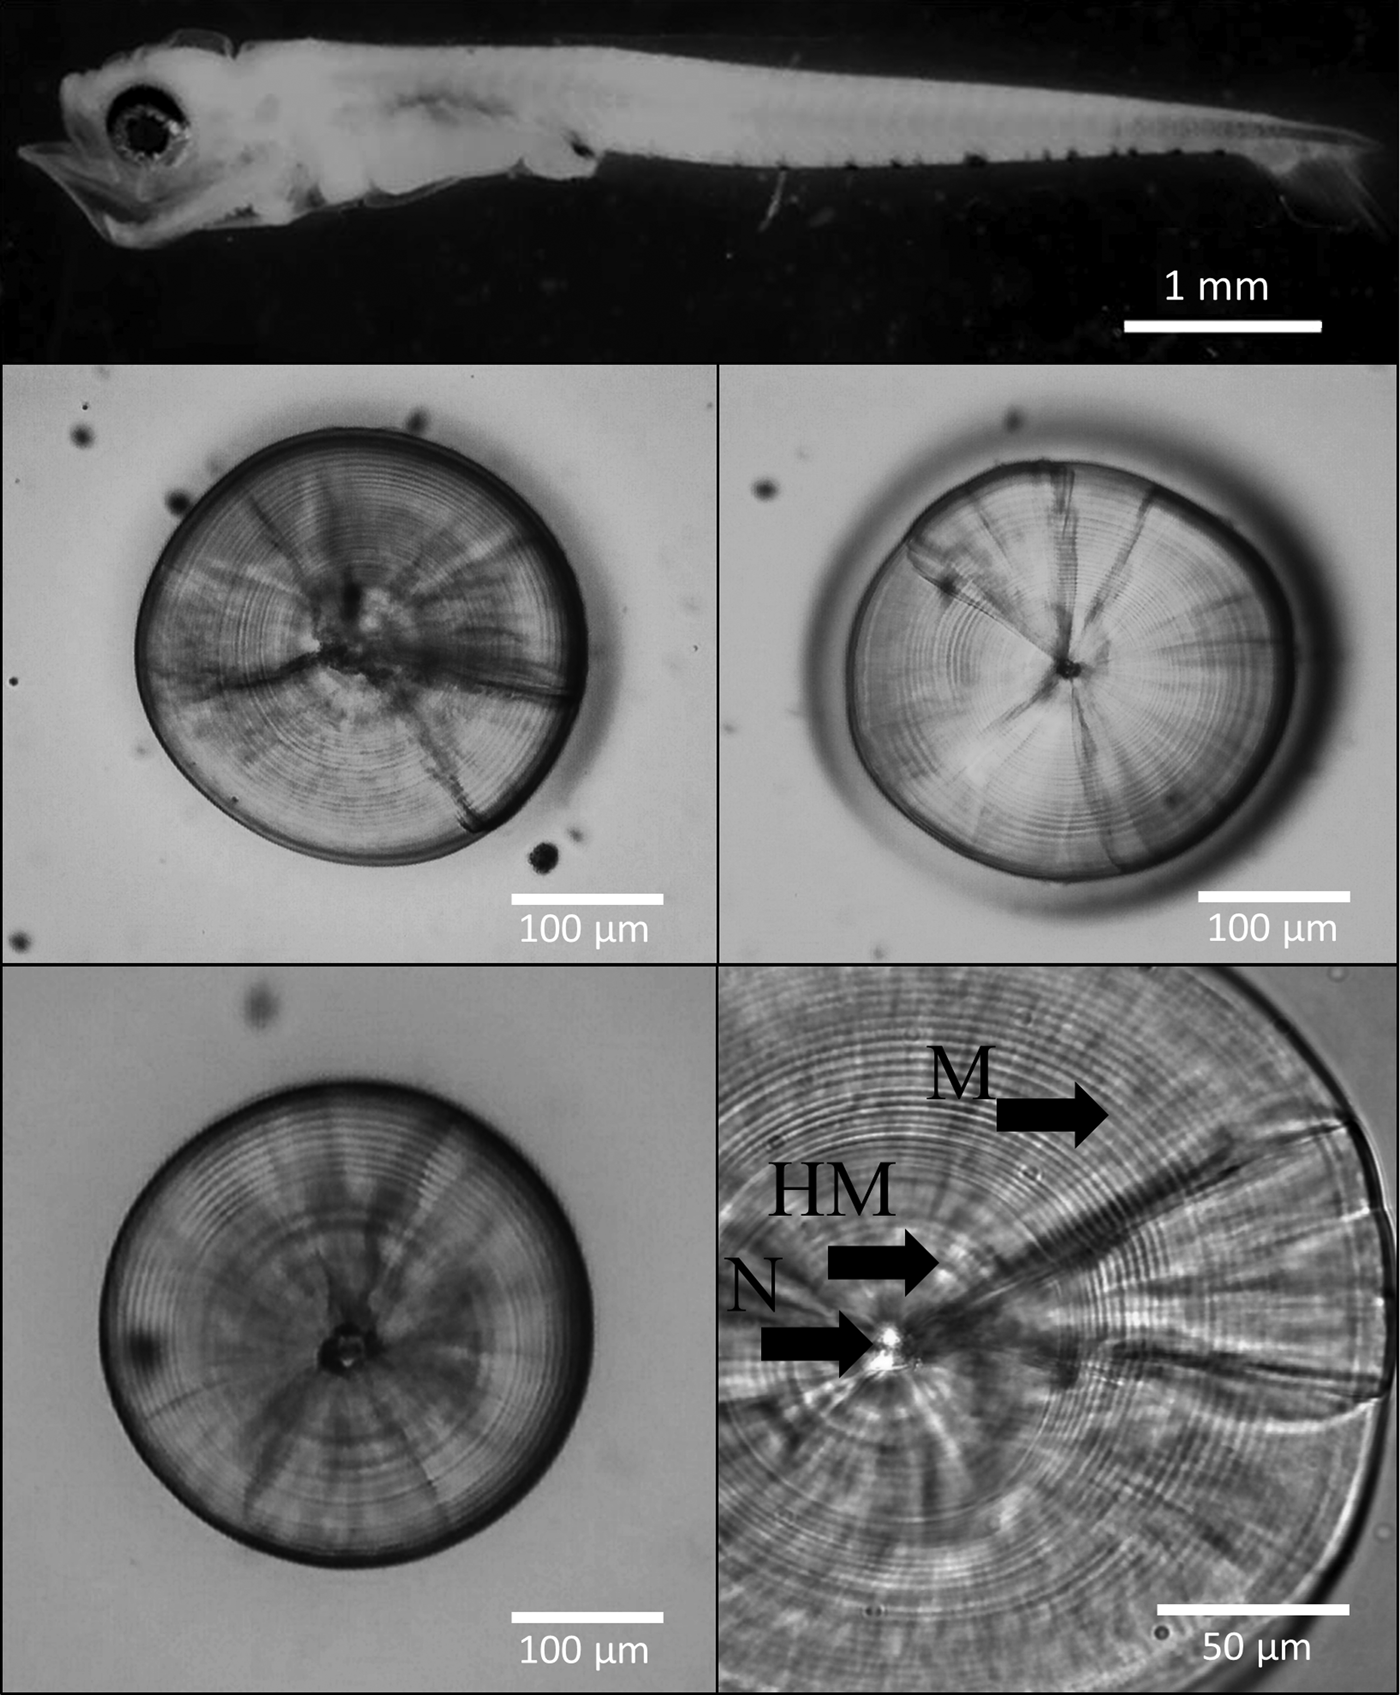
Fig. 2. Larva of the labrisomid blenny Auchenionchus crinitus (Jenyns, 1842), 5.5 mm SL, and sagittal otoliths of several specimens. N, nucleus; HM, hatch mark; M, microincrements. Notice the lack of damage on the edges of the sagittae due to fixation in buffered 5% formalin for 24 h.
Following Campana (Reference Campana, Stevenson and Campana1992), three independent counts were performed by the same reader (Valentina Nowajeswki, VN) on both the right and left sagittae (N = 395 pairs). Ages estimated using a subset of sagittae by the main reader (VN) and an experienced reader (Mauricio Landaeta) were not significantly different (Wilcoxon test, P = 0.31). Counts were performed after a prominent hatch mark (HM, Figure 2). The daily periodicity of microincrement deposition in A. crinitus has been previously validated by Mansur et al. (Reference Mansur, Catalán, Plaza, Landaeta and Ojeda2013). Nonetheless, the first mark was not validated as a hatch mark. When the coefficient of variation (CV = standard deviation/mean × 100) of the increment counts among the three readings was <10%, the mode of the three counts was calculated and utilized for the analysis. When the CV was >10%, the otolith reading was discarded (N = 24). Once selection of the values was done, comparison of readings was carried out with a Wilcoxon matched pairs test, testing the null hypothesis that reading of the left sagitta is the same as that of the right sagitta. Because the null hypothesis of the same result in both otoliths cannot be rejected (W = 71.50; P = 0.51), any of the otoliths can be utilized for analyses.
The hatch day composition of all aged larvae was subsequently estimated in a calendar year, and cohorts were identified according to the temporal pattern of hatching. Additionally, back-calculated hatching dates were related to the lunar cycle. For each sampling date, the days since new moon were counted (DNM), and thereby assigned DNM values for 0 to 29 for each date, in which 0 represented the new moon. The DNM values were converted to angles (°) by dividing by 29 (the length, in days, of the lunar cycle) and then multiplying by 360°, so that the data could be analysed using circular statistics. To assess whether the hatching events showed lunar periodicity, the data were analysed with Rayleigh and Rao's spacing tests (Batschelet, Reference Batschelet1981) using Past 3.11 software.
Least-squares simple linear regressions (SL = a + bA + εi) between the microincrement counts (age, A) and larval lengths (NL and SL) were adjusted, separately for each batch identified during autumn–winter 2014. In the model, the slope corresponded to the batch growth rate, and the intercept corresponded to the estimated hatch size. The comparison of the slopes of the regression models was carried out following Zar (Reference Zar2010).
Results
Physical settings
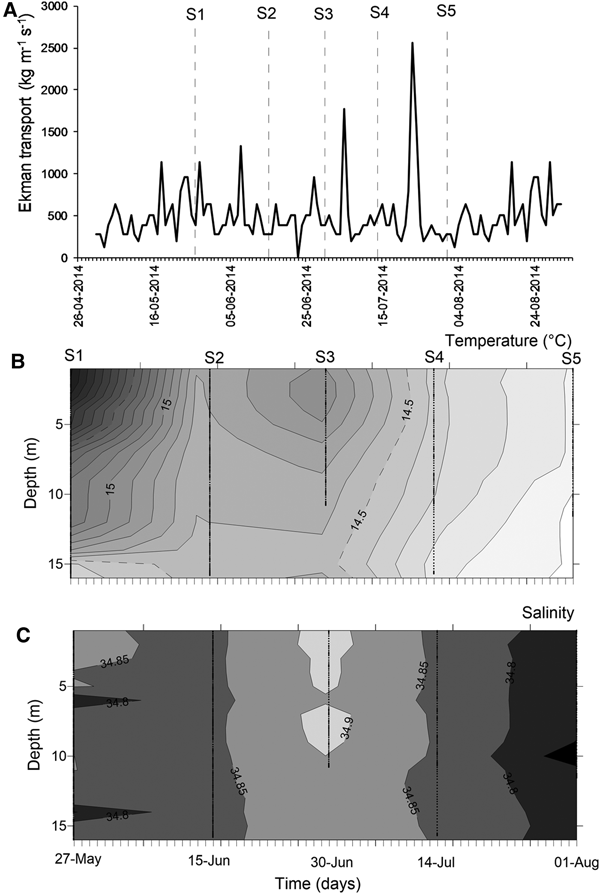
At mesoscale, several upwelling events were detected through the temporal series of wind-derived Ekman transport of autumn–winter 2014 (Figure 3A). Prior to the S1, there was ~10 days of winds favourable for upwelling events. After that, peaks of Ekman transport occurred only for few (<4) days, such as those occurring during 5 July (1774.9 kg m−1 s−1) and 23 July 2014 (2555.9 kg m−1 s−1) (Figure 3A). Moreover, the biological sampling did not match with large events of offshore transport.
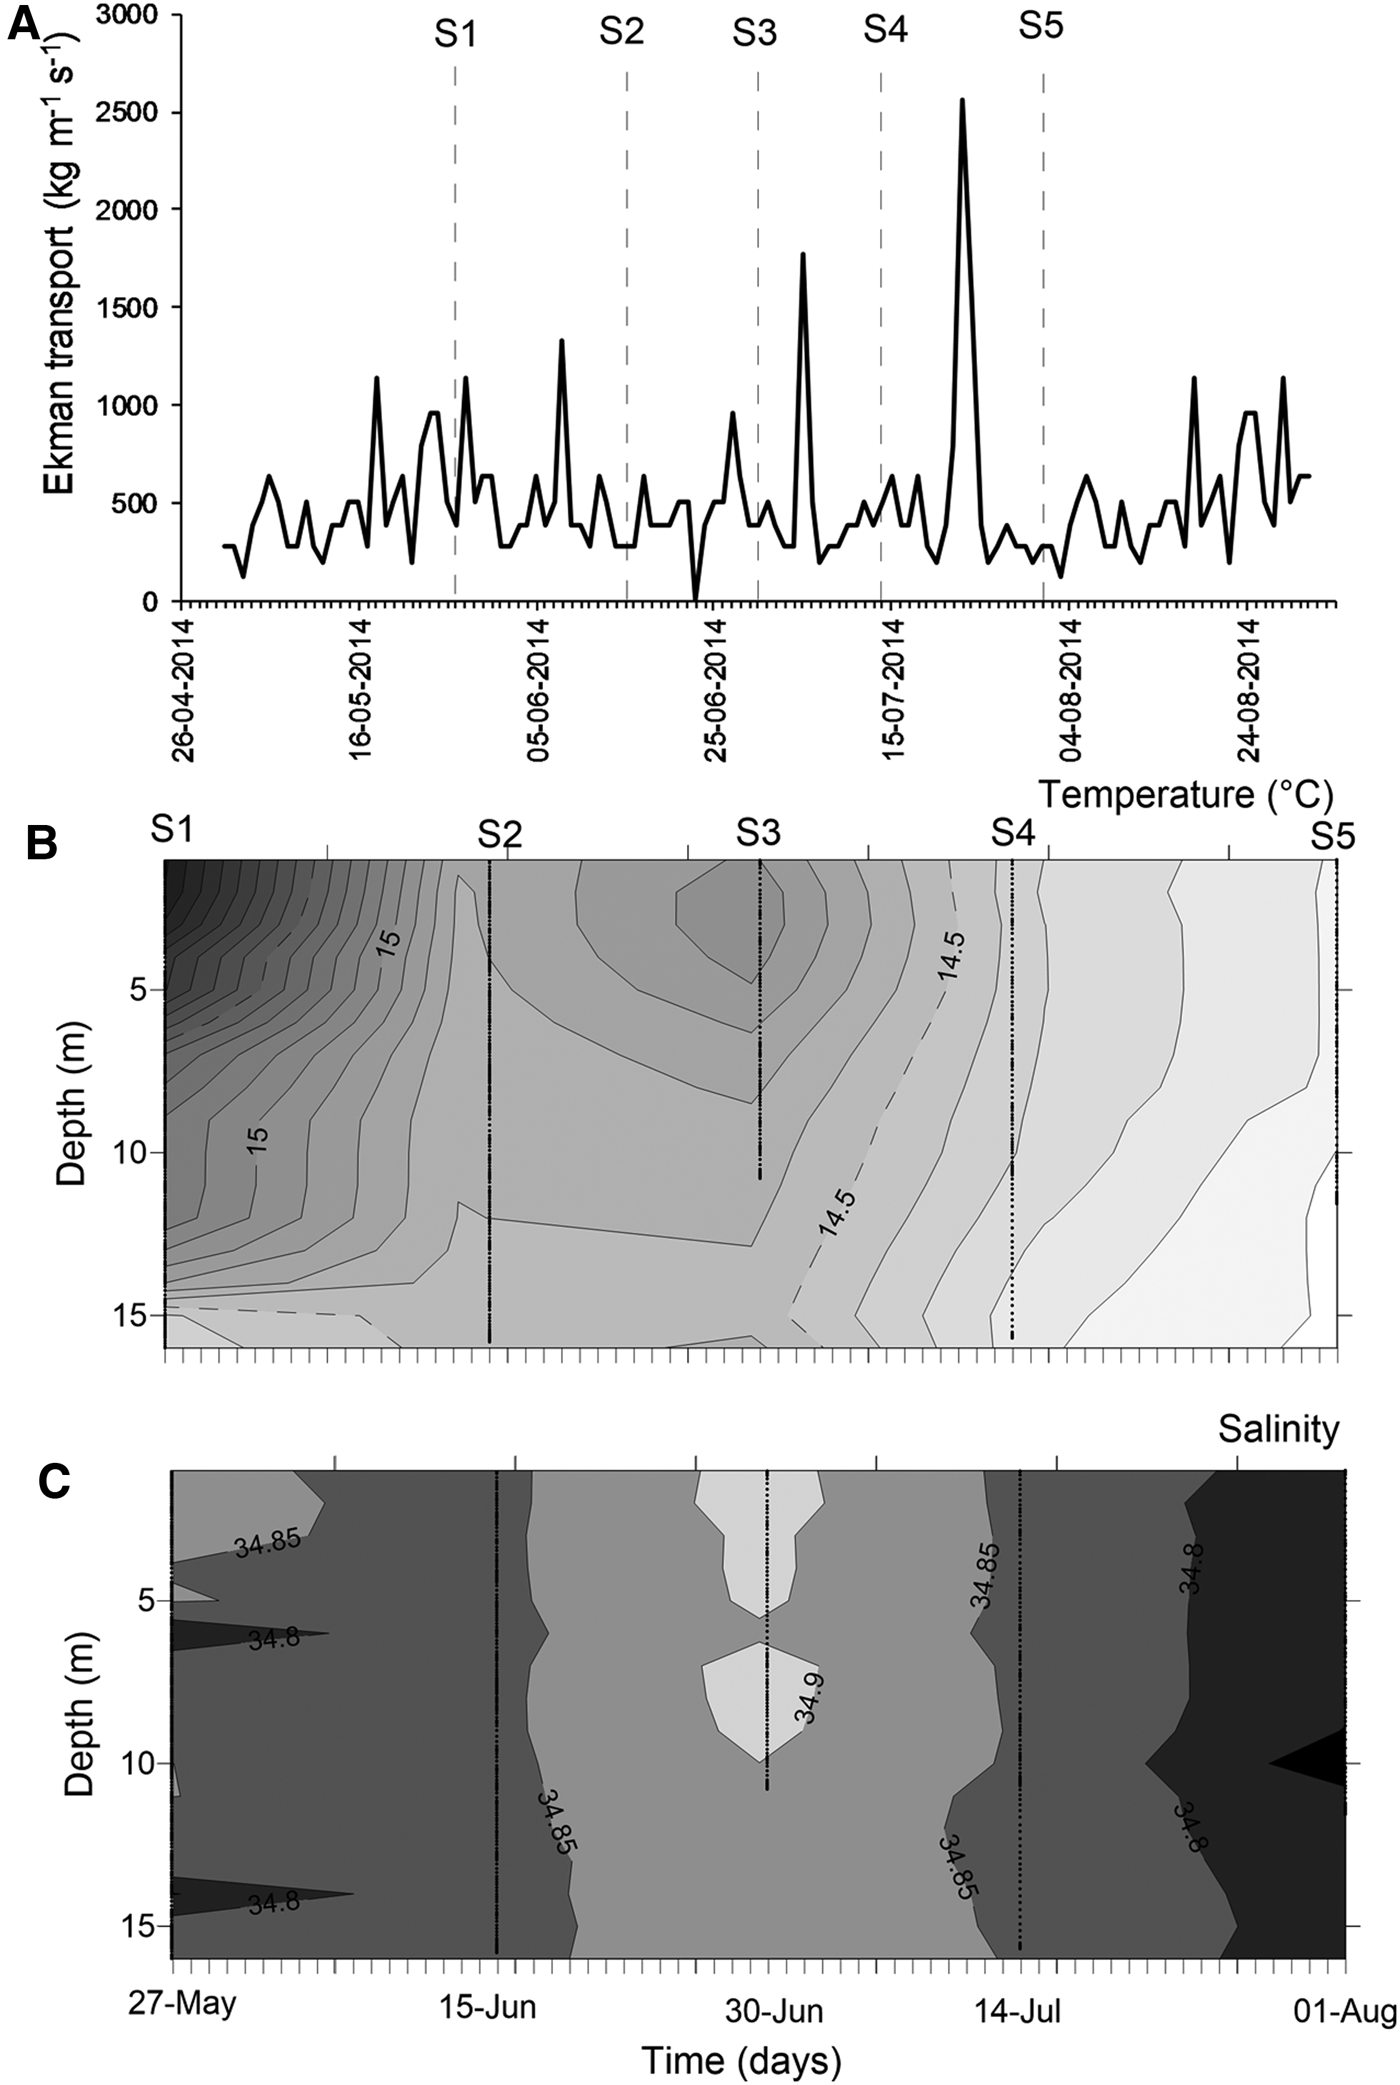
Fig. 3. Environmental conditions during the sampling period, austral autumn–winter 2014 off northern Chile. (A) Temporal series of wind-derived Ekman transport; (B) vertical section of water temperature (°C); (C) vertical section of salinity. S1–S5 corresponds to the sampling dates.
During the sampling period, seawater temperature in shallow areas ranged between 13.97 and 16.32°C (mean ± SD, 14.73 ± 0.58°C). The warmest waters occurred during mid-May (Figure 3B), when the greatest vertical gradient was also detected (1.59–2.09°C). During the rest of the study, the water column was well-mixed, with temperature varying from 13.97 to 14.99°C (14.43 ± 0.27°C). Similarly, salinity was conservative, ranging between 34.65–34.95 (34.84 ± 0.04); an intrusion of relatively saltier waters was observed during late June 2014 (Figure 3C). Except for the first sampling day, no clear evidence of upwelling waters was detected in nearshore areas during autumn–winter 2014.
Larval abundance and size structure
During 27 May and 15 June 2014 (austral autumn), larval abundances were 39.06 ± 5.08 ind. 100 m−3 (median ± MAD), with a significant increase during 30 June and 1 August 2014 (110.98 ± 47.66 ind. 100 m−3) (Kruskal–Wallis test, H4,40 = 16.32, P = 0.002, Figure 4, Table 1).
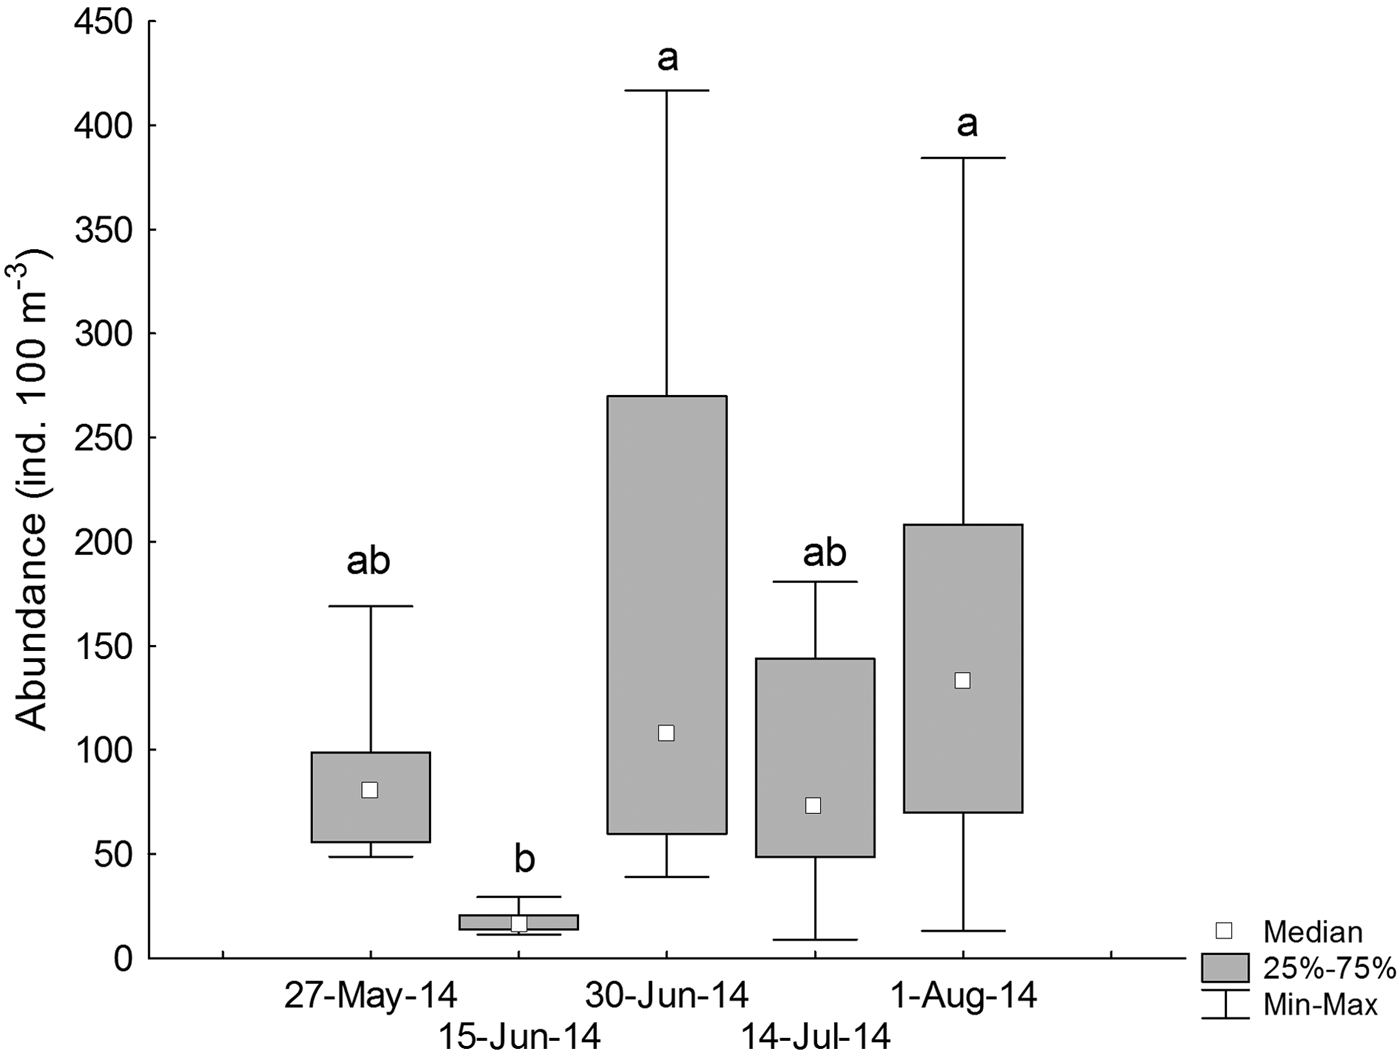
Fig. 4. Temporal variations in the standardized abundance (ind. 100 m−3) of larval labrisomid blenny Auchenionchus crinitus. Different letters indicate significant differences (P < 0.05) among sampling dates.
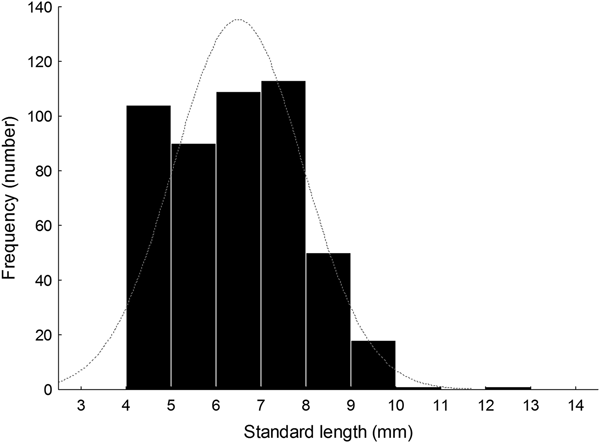
Larval length varied between 4.01 and 12.50 mm SL (N = 486, median ± MAD, 6.55 ± 1.13 mm SL) (Figure 5, Table 1). Size distribution did not follow a normal distribution (Shapiro–Wilk's test, W = 0.97; P < 0.001, Figure 5). The length distribution showed positive skewness and a leptocurtic distribution with a value greater than would be expected under the normal distribution on 15 June 2014 (Table 1); furthermore, the size distribution of collected larvae on other sampling days showed low skewness; some days had negative kurtosis values that would suggest an almost uniform distribution (Table 1).

Fig. 5. Histogram of notochord or standard length (NL or SL, mm) of larval labrisomid blenny Auchenionchus crinitus collected during the whole studied period. Grey dotted line corresponds to the expected normal distribution.
Back-calculated hatch dates
The back-calculated hatch dates indicate the presence of three cohorts during the study period, two from autumn (cohort 1 from 6 May to 24 May; cohort 2 from 27 May to 19 June) and one from winter (cohort 3 from 20 June to 18 July) (Figure 6A). The first two main hatching events occurred during neap tides, and the third one was spread over most of the lunar cycle. Hatching was not homogeneous throughout the lunar cycle (Rayleigh test, R = 0.37, P < 0.001; Rao's spacing test, U = 330.4, P < 0.001) (Figure 6B), and centred during full moon (circular mean = day 13.09, 95% confidence interval: 12.02–14.18 day of the lunar cycle).

Fig. 6. Back-calculated hatch days of labrisomid blenny Auchenionchus crinitus during autumn–winter 2014 off northern Chile. (A) Hatch-days on an annual basis, (B) hatch-days on a lunar basis.
Size at hatch and larval age and growth by batch
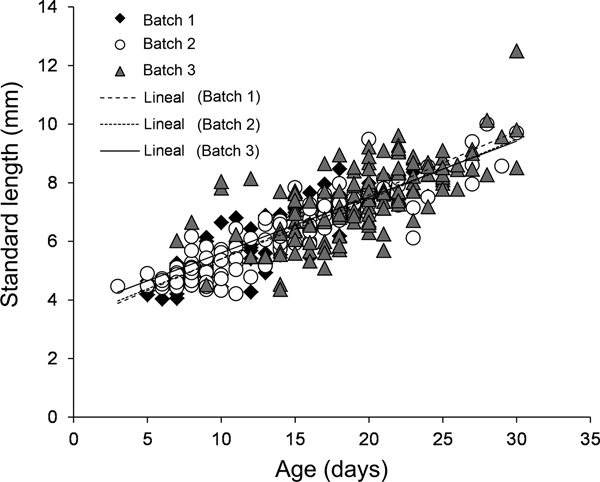
For all three batches, the estimated age of larval A. crinitus varied between 3 and 30 days old. Estimated size at hatch varied from 3.23 ± 0.16 mm NL during May to 3.70 ± 0.35 mm NL during late July. Batch 1 experienced a mean growth rate of 0.22 ± 0.01 mm day−1, while larvae hatched during early June (batch 2) and late July (batch 3) grew at 0.20 ± 0.01 mm day−1 and 0.19 ± 0.02 mm day−1, respectively (Figure 7). Estimated larval growth rates were similar among batches (homogeneity of slope test, F = 0.85, P = 0.43).

Fig. 7. Growth rate models for all three batches of larval Auchenionchus crinitus collected during the study period. Black diamonds, batch 1; white circles, batch 2; grey triangles, batch 3.
Discussion
Microstructure analysis of sagittal otoliths of larval labrisomid blenny Auchenionchus crinitus allows inferring the hatching of three batches during autumn–winter 2014 in nearshore waters off Isla Santa María, Antofagasta, northern Chile. Back-calculated hatch dates occurred throughout the lunar cycle, except during the new moon. This indicates that there is no timing periodicity with the moon, and it may be related to the adult timing of the reproductive events in labrisomid fish (Gibran et al., Reference Gibran, Santos, dos Santos and Sabino2004).
Larval A. crinitus increased in abundance from autumn to winter. During winter, a relatively large concentration of Chl-a in the inshore areas has been described (Morales et al., Reference Morales, Blanco, Braun, Reyes and Silva1996), supporting a large abundance of copepods (Hidalgo et al., Reference Hidalgo, Escribano, Vergara, Jorquera, Donoso and Mendoza2010), the main prey item of labrisomid larval fishes (Vera-Duarte & Landaeta, Reference Vera-Duarte and Landaeta2016).
Seawater hydrographic features were kept relatively similar during autumn and winter, as well as the estimated size-at-hatch and growth rates of larval A. crinitus. For cryptobenthic fish species, larval growth rates seem to vary at larger temporal scales, such as in stargazers (family Dactyloscopidae, Rodríguez-Valentino et al., Reference Rodríguez-Valentino, Landaeta, Castillo-Hidalgo, Bustos, Plaza and Ojeda2015; Castillo-Hidalgo et al., Reference Castillo-Hidalgo, Plaza, Díaz-Astudillo and Landaeta2018). The lack of seasonality in the early life history traits of A. crinitus may be linked to the environmental stability of the water column structure.
Growth rates estimated for larval A. crinitus were similar to those described for other cryptobenthic fish larvae (clingfishes, Contreras et al., Reference Contreras, Landaeta, Plaza, Ojeda and Bustos2013; triplefin, Palacios-Fuentes et al., Reference Palacios-Fuentes, Landaeta, Jahnsen-Guzmán, Plaza and Ojeda2014; sand stargazer, Rodríguez-Valentino et al., Reference Rodríguez-Valentino, Landaeta, Castillo-Hidalgo, Bustos, Plaza and Ojeda2015) and adults (e.g. gobiids Eviota spp., 0.20–0.25 mm day−1, Depczynski & Bellwood, Reference Depczynski and Bellwood2006). Instead, mesopelagic larval species grew slower (0.05–0.06 mm day−1) in shallow waters of northern Chile (Landaeta et al., Reference Landaeta, Contreras, Bustos and Muñoz2015), while epipelagic species, such as anchovy Engraulis ringens, grow faster (0.50–0.85 mm day−1) during their early life stages in the same period (May–June, Contreras et al., Reference Contreras, Rodríguez-Valentino, Landaeta, Plaza, Castillo and Alvarado-Niño2017). This suggests that growth patterns, which may be affected by oceanographic conditions, are species-specific in their responses, considering pelagic vs benthic adults. In species with benthic adults, larval growth rates are remarkably similar, suggesting that the life history strategy explains changes in growth rate.
Larval A. crinitus collected with Bongo nets in the water column varied between 3 and 30 days old. According to otolith microstructure analysis of young-of-the-year collected in tidal pools, the pelagic larval duration (PLD) for the species is 73–75 days (Mansur et al., Reference Mansur, Plaza, Landaeta and Ojeda2014). It is plausible that after the first month of life, postlarvae inhabit near-bottom, subtidal environments, entering next to the tide rock pools.
Acknowledgements
We appreciate the field and lab support of Dra. Gabriela Muñoz (Universidad de Valparaíso) and Dra. María T. González (Universidad de Antofagasta). Comments of two anonymous reviewers improved an early version of the manuscript.
Financial support
This research was partially funded by Comisión Nacional de Investigación Científica y Tecnológica (CONICYT) through projects Fondecyt 1120868 and Fondecyt 1150296.


