Introduction
Countries need to conserve biodiversity and utilize natural resources wisely if they are to avoid, halt and reverse ongoing environmental degradation (Stephenson et al., Reference Stephenson, Bowles-Newark, Regan, Stanwell-Smith, Diagana and Höft2016). To do so effectively, governments and their agencies need robust environmental data to make informed decisions. Yet in Africa, as elsewhere, that information is often lacking (Stephenson et al., Reference Stephenson, Bowles-Newark, Regan, Stanwell-Smith, Diagana and Höft2016; Schmeller et al., Reference Schmeller, Böhm, Arvanitidis, Barber-Meyer, Brummitt and Chandler2017), partly because of insufficient support for, and investment and expertise in, biodiversity monitoring. Here we describe citizen-science based monitoring schemes for birds in three African countries that are beginning to deliver policy-relevant results.
Birds have many characteristics that make them useful indicators of environmental change: they occur in nearly all habitats, often reflect trends in other taxa and are moderately sensitive to environmental change, and our level of knowledge about their numbers, ranges and ecology is relatively high (Furness & Greenwood, Reference Furness and Greenwood1993; Gregory et al., Reference Gregory, van Strien, Voříšek, Meyling, Noble, Foppen and Gibbons2005). Work in Europe and North America has shown that Wild Bird Indices, which combine trend data for multiple species, can be used to inform environmental and conservation decision making and improve the management of natural resources. Specifically, Wild Bird Indices are composite indicators describing the average trends in relative abundance of native species, with each species’ trend weighted equally in the index (Gregory et al., Reference Gregory, van Strien, Voříšek, Meyling, Noble, Foppen and Gibbons2005). Such indicators provide a simple way of measuring and communicating progress towards biodiversity targets and can communicate information on anthropogenic pressures, such as habitat change or loss, and climate change (Stephens et al., Reference Stephens, Mason, Green, Gregory, Sauer and Alison2016). Environmental degradation can have profound consequences for the lives of people, reducing the natural resources and ecosystem services upon which they depend, and thus Wild Bird Indices are being used in many countries, particularly in Europe. However, such indices must be interpreted with care, as many bird species are mobile and respond to environmental changes over large and often distinct areas, and they may use the environment in a different manner to other taxa.
Programmes to monitor populations of breeding birds, covering predominantly terrestrial habitats, have become established in many European and North American countries since the 1960s. Across Europe there are currently 39 national monitoring schemes, and the Pan-European Common Bird Monitoring Scheme (EBCC, 2017) uses species indices from annual surveys of breeding birds in 28 countries to produce European and European Union (EU) bird indices. These cover c. 170 species, with the objective of using birds as indicators of the state of nature across Europe. The supranational multi-species indicators have been adopted as measures of progress towards the EU's biodiversity goals, including Structural, Headline and Sustainable Development Indicators (European Commission, 2016).
Such indices are relevant to the Strategic Plan for Biodiversity developed under the Convention on Biological Diversity, specifically Strategic Goals B (reduce the direct pressures on biodiversity and promote sustainable use) and C (improve the status of biodiversity by safeguarding ecosystems, species and genetic diversity), and to the Aichi Biodiversity Targets used to measure progress towards these goals (Targets 5, 7 and 12; CBD, 2017), as well as to United Nations’ Sustainable Development Goal 15 (Butchart et al., Reference Butchart, Walpole, Collen, van Strien, Scharlemann and Almond2010; Secretariat of the Convention on Biological Diversity, 2014; Tittensor et al., Reference Tittensor, Walpole, Hill, Boyce, Britten and Burgess2014).
The Wild Bird Index concept is being applied elsewhere, often in State of the Nation's Birds reports, for example, in North America (North American Bird Conservation Initiative, U.S. Committee, 2014), Australia (O'Connor et al., Reference O'Connor, Ehmke and Cunningham2015), and Uganda (Nature Uganda, 2015). Although some land bird monitoring schemes are well developed and are becoming established elsewhere (e.g. Australia, China, India, Japan, South Korea, Taiwan), few other schemes exist, especially in the tropics, where biodiversity richness is at its highest.
Following a review of the capacity of the African Partner organizations of BirdLife International in 2010, monitoring schemes were initiated in Botswana and Kenya, and revised in Uganda. These countries were selected on the basis of the enthusiasm of national partners, volunteer capacity and a tradition of bird monitoring to expand upon. Here we describe the progress of these schemes and illustrate what can be achieved in Africa in terms of biodiversity monitoring based on citizen science (public engagement in scientific research activities; European Commission, 2014). The indices we present are provisional because the time series analysis is short, and more work is needed to refine and interpret the trends, but their potential is clear.
Methods
The establishment of the monitoring schemes is described in Supplementary Material 1, including details of field methods, sampling design and volunteer engagement. A semi-random sampling approach was preferred, given the low availability of observers, as it encourages participation in circumstances of uneven participant distribution. This is based on similar approaches that have been employed in Europe (e.g. Bulgaria). Both line and point count transects were considered to be suitable survey techniques (Senyatso et al., Reference Senyatso, Sheehan, Eaton and Butchart2008). The final decision on which technique to use in each country was based on local conditions and existing experience. In Botswana, surveys involved walking a 2 km transect, undertaking a 5-minute count of all birds seen or heard at 11 points spaced at 200 m intervals. Surveys were undertaken twice per year, in February and November. In Uganda, a line transect method was used, recording all birds seen or heard along a 2 km transect, with counts divided into 200 m sections. Surveys were undertaken twice per year, in January/February and July/August. The scheme in Kenya followed a similar approach to Botswana, with surveys undertaken twice per year, in February and August. The timings reflect the different peak times for the detection of resident and migrant species.
Species trends and selection of indicator species
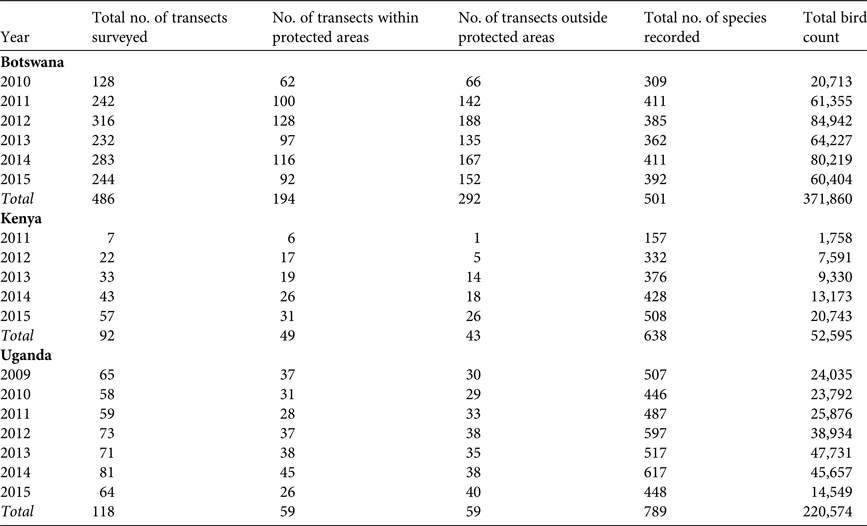
We conducted trend and indicator analyses with data from Botswana and Uganda, but not Kenya, as too few transects were surveyed there in the first 3 years of the scheme (Table 1). We employed a standardized approach to identify species trends reliably. For many species the frequency and number of individuals recorded from the surveys meant that there were insufficient data to generate robust indices. For Botswana and Uganda the most widespread species were selected by the mean number of occupied transects per annum. In Botswana, species recorded on ≥ 20 transects per year were selected, except for any species for which year-to-year indices increased or decreased by a magnitude of > 10, or the standard error of the multiplicative slope index was > 0.5 (following the methods of the European Bird Census Council; EBCC, 2016a). In Uganda, although fewer transects have been surveyed annually, there was a greater species abundance per tetrad. Species recorded on ≥ 15 transects per year were selected, with the same caveats as outlined above. This selection process facilitates the inclusion of widespread species that are typically recorded in low numbers (e.g. the Cape crombec Sylvietta rufescens in Botswana and the African thrush Turdus pelios in Uganda), as well as those that are typically flocking or erratic in their movements (e.g. gamebirds, the marabou Leptoptilos crumeniferus and the red-billed quelea Quelea quelea), which may be recorded only on a small proportion of transects but in large numbers. On this basis, we report trends for 95 species in Botswana and 78 in Uganda.
Table 1 The numbers of transects surveyed and bird species recorded during bird population monitoring in Botswana (2010–2015; Fig. 1), Kenya (2011–2015; Fig. 2) and Uganda (2009–2015; Fig. 3), for all transects, and for transects within and outside protected areas.
The Botswana transects were categorized in terms of habitats as primarily grassland, savannah or arid broadleaf woodland, and the Uganda transects as primarily farmland (more intensive farming practices there meant that it was possible to define farmland as a separate category), grassland, tropical forest, savannah, or urban (although too few urban transects have been surveyed thus far for meaningful analysis, and farmland and grassland transects were combined because of low sample sizes). The transects were categorized by the respective scheme organizers using land-cover maps.
We were also interested in understanding whether the trends of habitat specialists may differ from those of generalists, as has been reported elsewhere (Gregory et al., Reference Gregory, van Strien, Voříšek, Meyling, Noble, Foppen and Gibbons2005). To this end, we used the species specialization index of Julliard et al. (Reference Julliard, Clavel, Devictor, Jiguet and Couvet2006) to determine which species with reliable trends were habitat generalists or specialists. The species specialization index measures the variability of bird densities across habitat classes, using the coefficient of variation (standard deviation/mean density).
We were interested in the fate of Afro-Palaearctic migratory birds wintering in Africa, given the increasing conservation concern for this group on their breeding grounds (Vickery et al., Reference Vickery, Ewing, Smith, Pain, Bairlein, Škorpilová and Gregory2014). Although by the end of 2015 45 European migrant species had been recorded in the Botswana scheme and 57 in the Uganda scheme, only six species in Botswana (the European bee-eater Merops apiaster, the red-backed shrike Lanius collurio, the lesser grey shrike Lanius minor, the barn swallow Hirundo rustica, the willow warbler Phylloscopus trochilus and the spotted flycatcher Muscicapa striata) and six in Uganda (the European bee-eater, the sand martin Riparia riparia, the barn swallow, the willow warbler, the whinchat Saxicola rubetra and the western yellow wagtail Motacilla flava) were recorded in sufficient numbers to calculate reliable species trends.
As the importance of protected areas for biodiversity conservation has been the subject of much research (e.g. Chape et al., Reference Chape, Harrison, Spalding and Lysenko2005; Gaston et al., Reference Gaston, Jackson, Cantú-Salazar and Cruz-Piñón2008; Beresford et al., Reference Beresford, Eshiamwata, Donald, Balmford, Bertzky and Brink2013), we compared composite bird trends from our surveys within and outside protected areas. To do so, transects in each country were identified as being within protected areas or not, and a similar approach to the initial species selection was used (using the same statistical conditions for species inclusion). In each country only species for which we had identified reliable trends for both within and outside protected areas were included. For Botswana, we selected species that were recorded on ≥ 20 transects per year, within and outside protected areas, resulting in 43 species for which we were able to calculate trends. For Uganda, to ensure that a sufficient number of species were included, we selected species that were recorded on ≥ 14 transects per year, both within and outside protected areas, resulting in 12 species.
Species composition, by country and indicator, is summarized in Supplementary Material 2.
Data analysis
Species trends were produced using TRIM v. 2.53 (Pannekoek & van Strien, Reference Pannekoek and van Strien2005), which analyses time series of counts with missing observations using Poisson regression (van Strien et al., Reference van Strien, Pannekoek, Hagemeijer and Verstrael2004). Counts were modelled as a function of site and year effects. Specifically, we used a TRIM change-point model with a change-point in every year, correcting for autocorrelation and overdispersion. The multi-species Wild Bird Indices were produced using MSI-tool (Soldaat et al., Reference Soldaat, Pannekoek, Verweij, van Turnhout and van Strien2017), a script that runs in R 3.2.3 (R Development Core Team, 2017), which accounts for sampling error in the calculation of such indicators with bootstrapped confidence limits and tests for significance based on the Monte Carlo simulation. The script uses the species’ annual indices and standard errors from the TRIM output. Given the short time periods involved, we report linear trends only. For each indicator, 10,000 simulations were specified, the index was set to 100 and the standard error was set to zero in the first year. We used standard trend classifications and significance levels from the outputs of TRIM and MSI-tool (Supplementary Table S1).
Results
Coverage
Transect coverage for each country is summarized in Table 1 and Figs 1–3. In Botswana > 350 volunteers were registered and 170 have undertaken a count. Reliable species trends were calculated for 95 bird species (Supplementary Material 2 & 3). In Uganda there were c. 100 regular participants, with 120 people participating in total. Reliable species trends were calculated for 78 bird species (Supplementary Material 2). In Kenya 160 people have participated in the count scheme so far, but data are not yet sufficient to calculate trends.
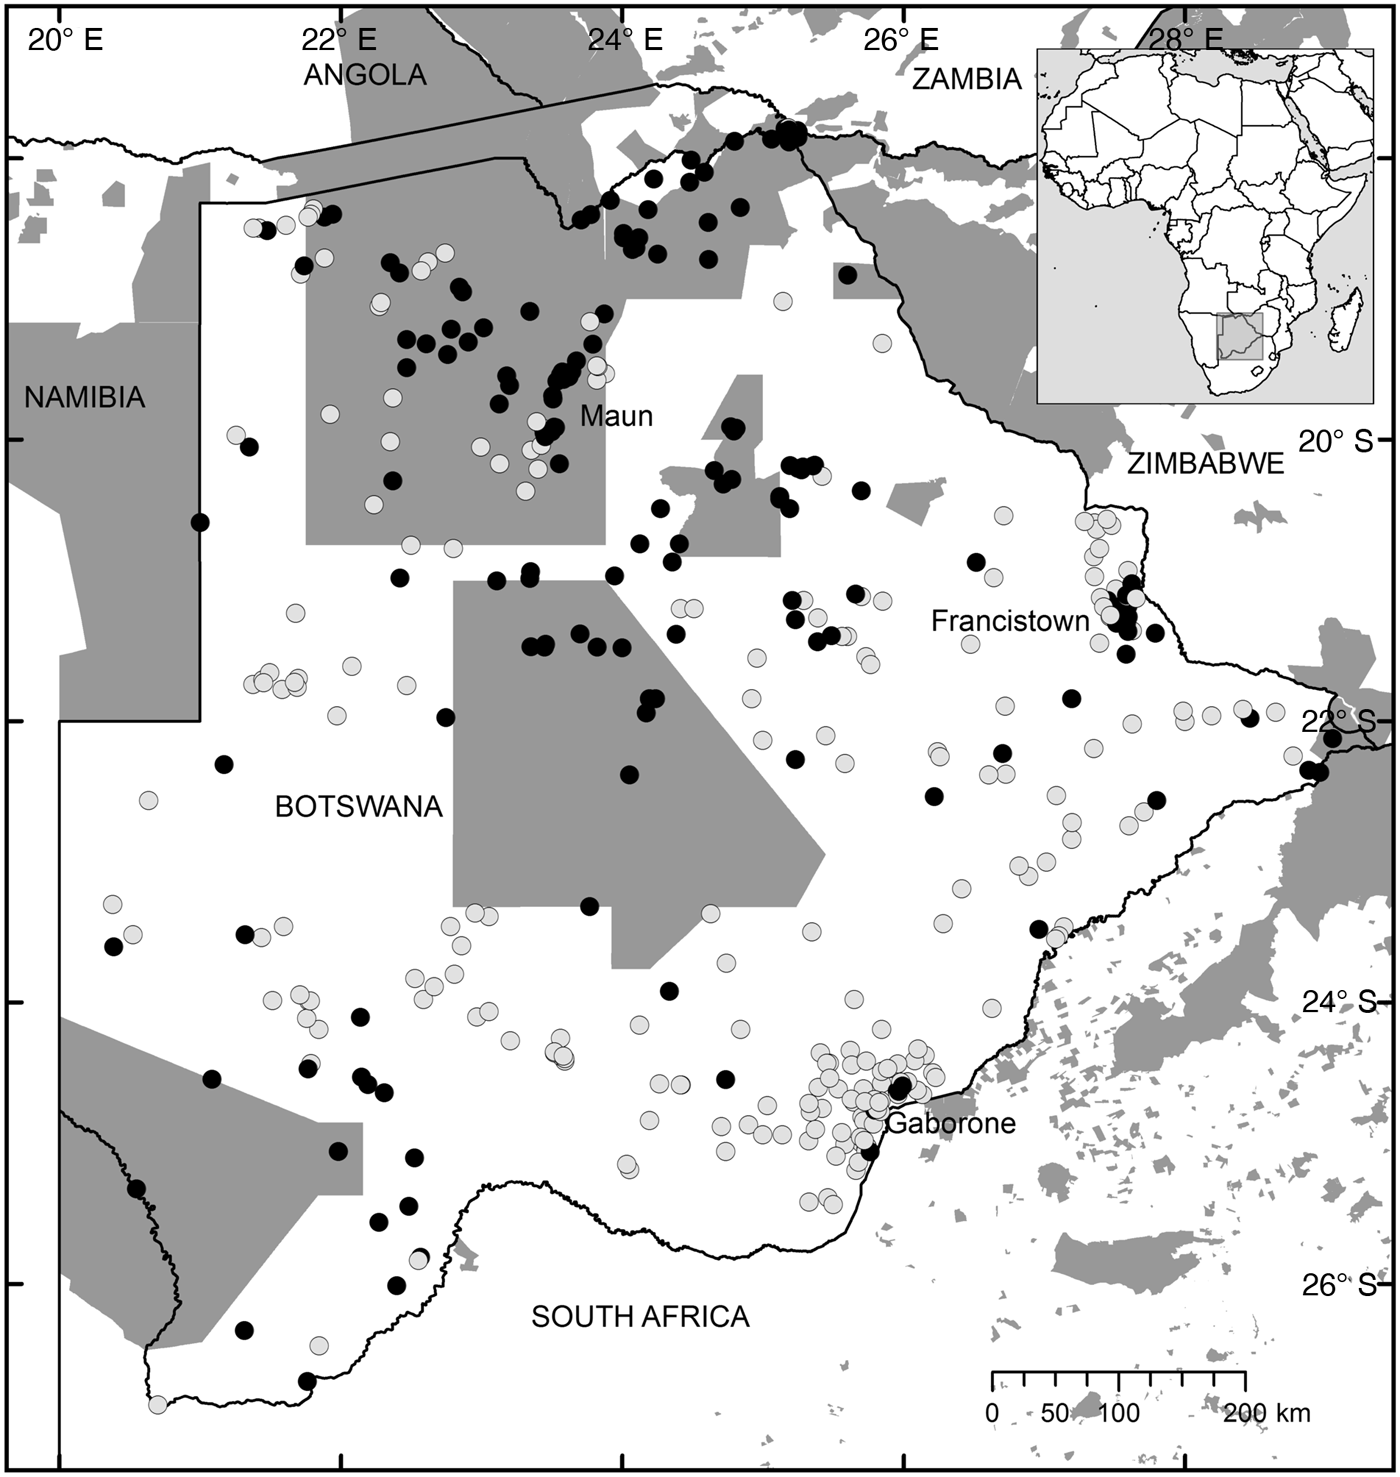
Fig. 1 The distribution of transects within (black filled circles) and outside (grey filled circles) protected areas in Botswana, surveyed at least once during 2010–2015. The main protected areas are shaded dark grey; smaller protected areas are not shown.
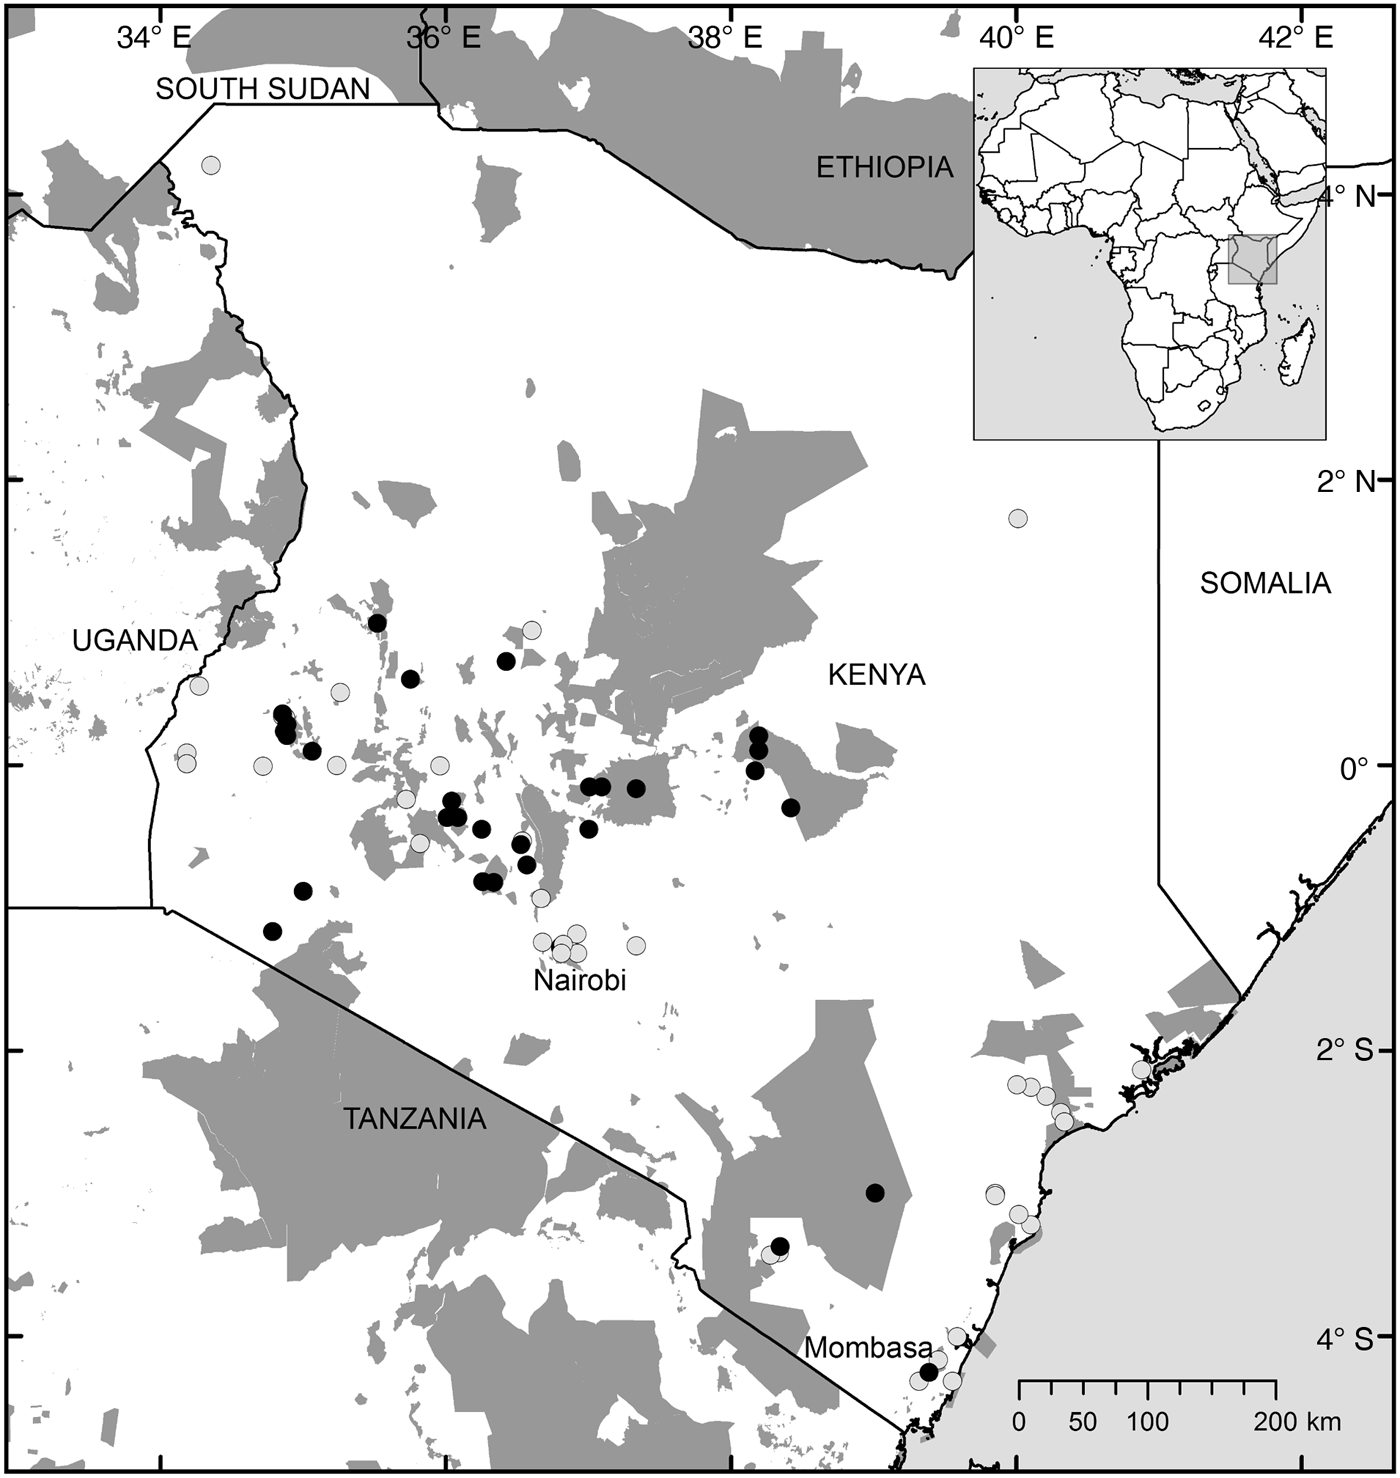
Fig. 2 The distribution of transects within (black filled circles) and outside (grey filled circles) protected areas in Kenya, surveyed at least once during 2011–2015. The main protected areas are shaded dark grey; some smaller protected areas are not shown.

Fig. 3 The distribution of transects within (black filled circles) and outside (grey filled circles) protected areas in Uganda, surveyed at least once during 2009–2015. The main protected areas are shaded dark grey.
Wild Bird Indices
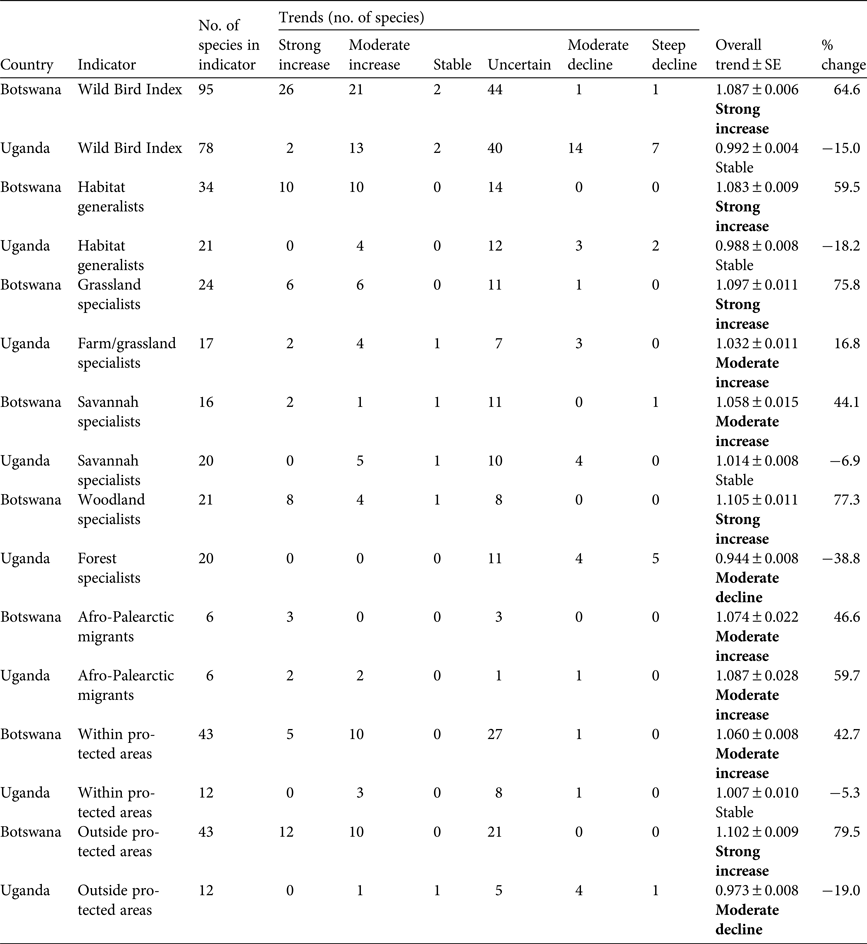
In Botswana the Wild Bird Index increased by 65% during 2010–2015 (Fig. 4, Table 2), with 47 of the 95 species showing a significant increase, and only two species showing a significant decline (Table 2). In Uganda the overall trend between 2009 and 2015 was stable, although showing a small recent decline, with 15 of the 78 species showing a significant increase and 21 species showing a significant decline (Fig. 4, Table 2). This suggests tentatively that common bird populations are faring better in Botswana than Uganda. However, we stress that the monitoring period is short and the trend analysis is preliminary and relates to the more abundant species. In Botswana the most frequently recorded species was the ring-necked dove Streptopelia capicola (present in 84% of transect counts), although the most abundant species was the red-billed quelea (an overall count of at least 40,250 from 483 records during 2010–2015). In Uganda the common bulbul Pycnonotus barbatus was the most abundant (an overall count of > 11,000 individuals from 713 records) and most frequently recorded species, recorded on 91% of transects. Trend graphs for each species in the Botswana and Uganda Wild Bird Indices are shown in Supplementary Material 3.

Fig. 4 (a) Wild Bird Indices for Botswana (95 species) and Uganda (78 species), with 95% confidence limits. (b) The percentage of the species within each TRIM significance classification for each country.
Table 2 A summary of the Wild Bird Indices for Botswana (2010–2015) and Uganda (2009–2015), with the number of species included in each index, the species trends, the overall trend, and the percentage change in the index during the monitoring period. Significance levels are in bold.
Habitat generalists and specialists
We defined habitat specialists as those with a species specialization index > 0.33 for Botswana and > 0.40 for Uganda (to reflect the number of species and the distribution of values), with 34 and 21 species, respectively, categorized as generalists. To allocate each of the specialists to a broad habitat, we used habitat-specific relative abundance (R. Julliard, pers. comm.), calculated as abundance i/overall mean abundance, within habitat i. Across the three broad habitat categories in Botswana and Uganda, the habitat with the highest habitat-specific relative abundance score was selected as the preferred habitat for each species. In Botswana we identified 24 grassland, 16 savannah and 21 woodland specialists, and in Uganda 17 farmland/grassland, 20 forest and 20 savannah specialists (Supplementary Material 2). Habitat generalists in Botswana showed a significant strong increase during 2010–2015, with 20 of the 34 species showing a significant increase (Table 2, Figs 5 & 6). In Uganda the trend was stable during 2009–2015, with four of the 21 species showing a significant increase, and five showing a significant decline (Table 2, Figs 7 & 8). In Botswana the indicators for grassland and woodland specialists showed significant strong increases during 2010–2015, with the trend for savannah specialists showing a significant moderate increase (Table 2). Of the grassland and woodland specialists, 50 and 57%, respectively, showed a significant increase, compared to 19% of the savannah specialists (Table 2). In Uganda the indicator for farmland/grassland specialists showed a significant moderate increase (+17%), with 35% of species showing a significant increase and 18% a significant decline (Table 2). The indicator for forest specialists showed a significant moderate decline (−39%), with 45% of species showing a significant decline and none showing an increase. The indicator for the 20 savannah specialists in Uganda was stable.
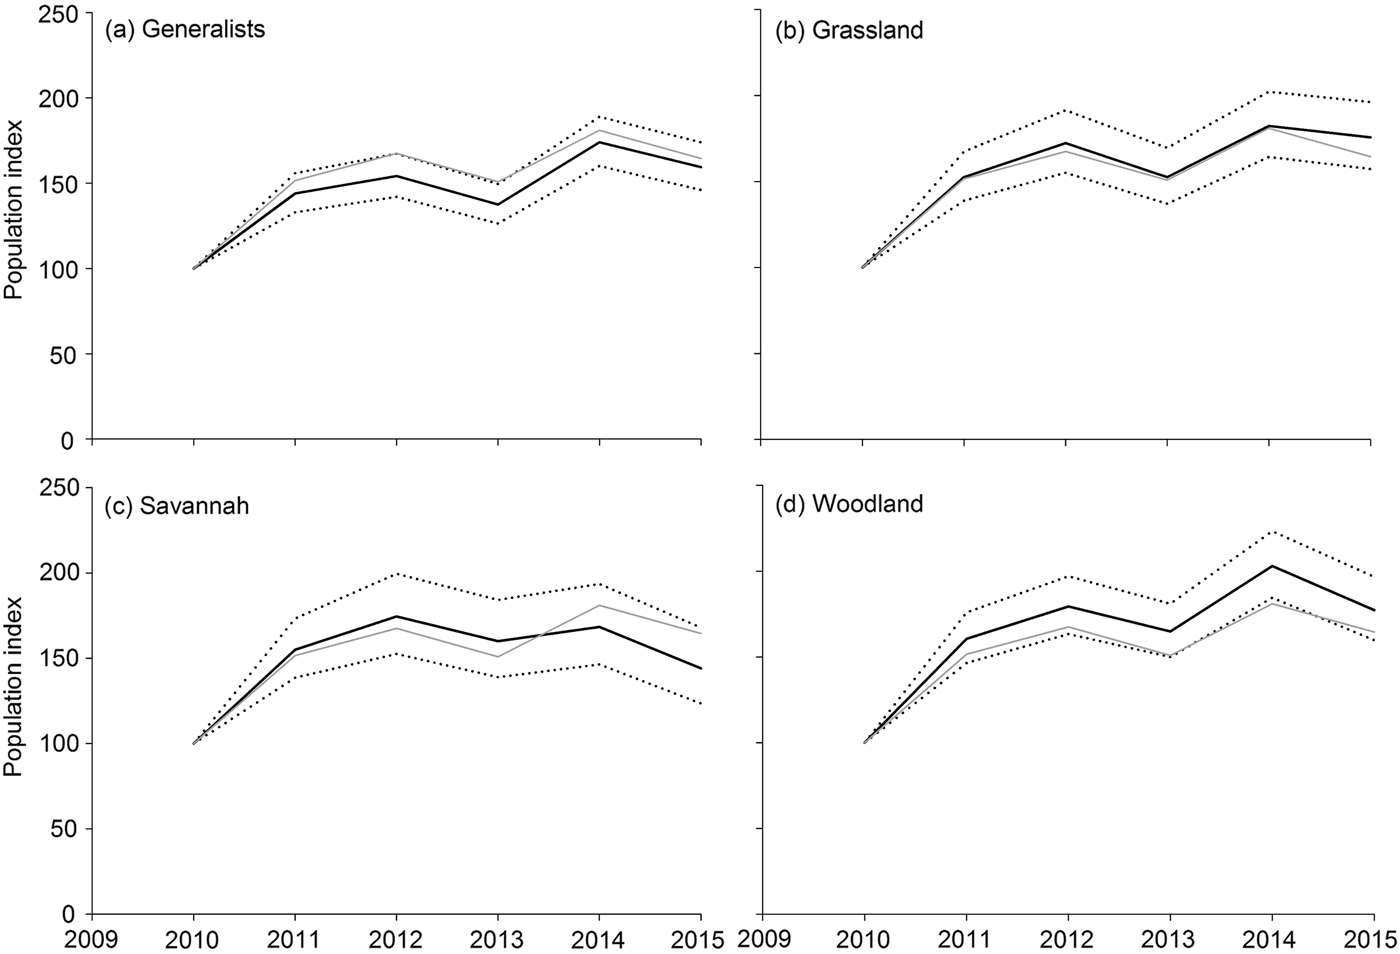
Fig. 5 Wild Bird Indices for (a) habitat generalists (34 species), (b) grassland specialists (24 species), (c) savannah specialists (16 species) and (d) woodland specialists (21 species) in Botswana (with 95% confidence limits), with the overall Wild Bird Index for the country shown in grey.
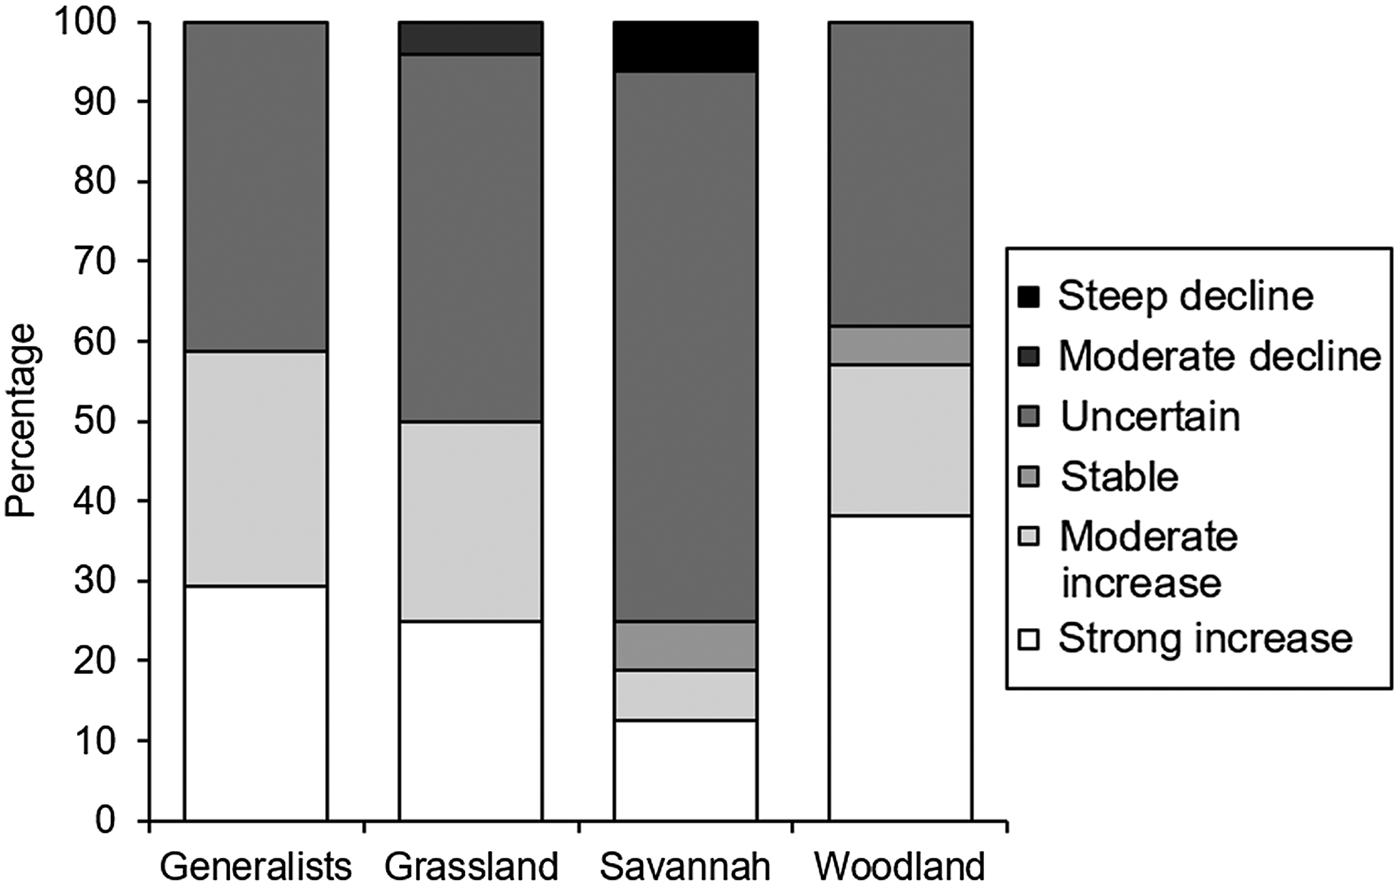
Fig. 6 The percentage of wild bird species in Botswana within each TRIM significance classification.
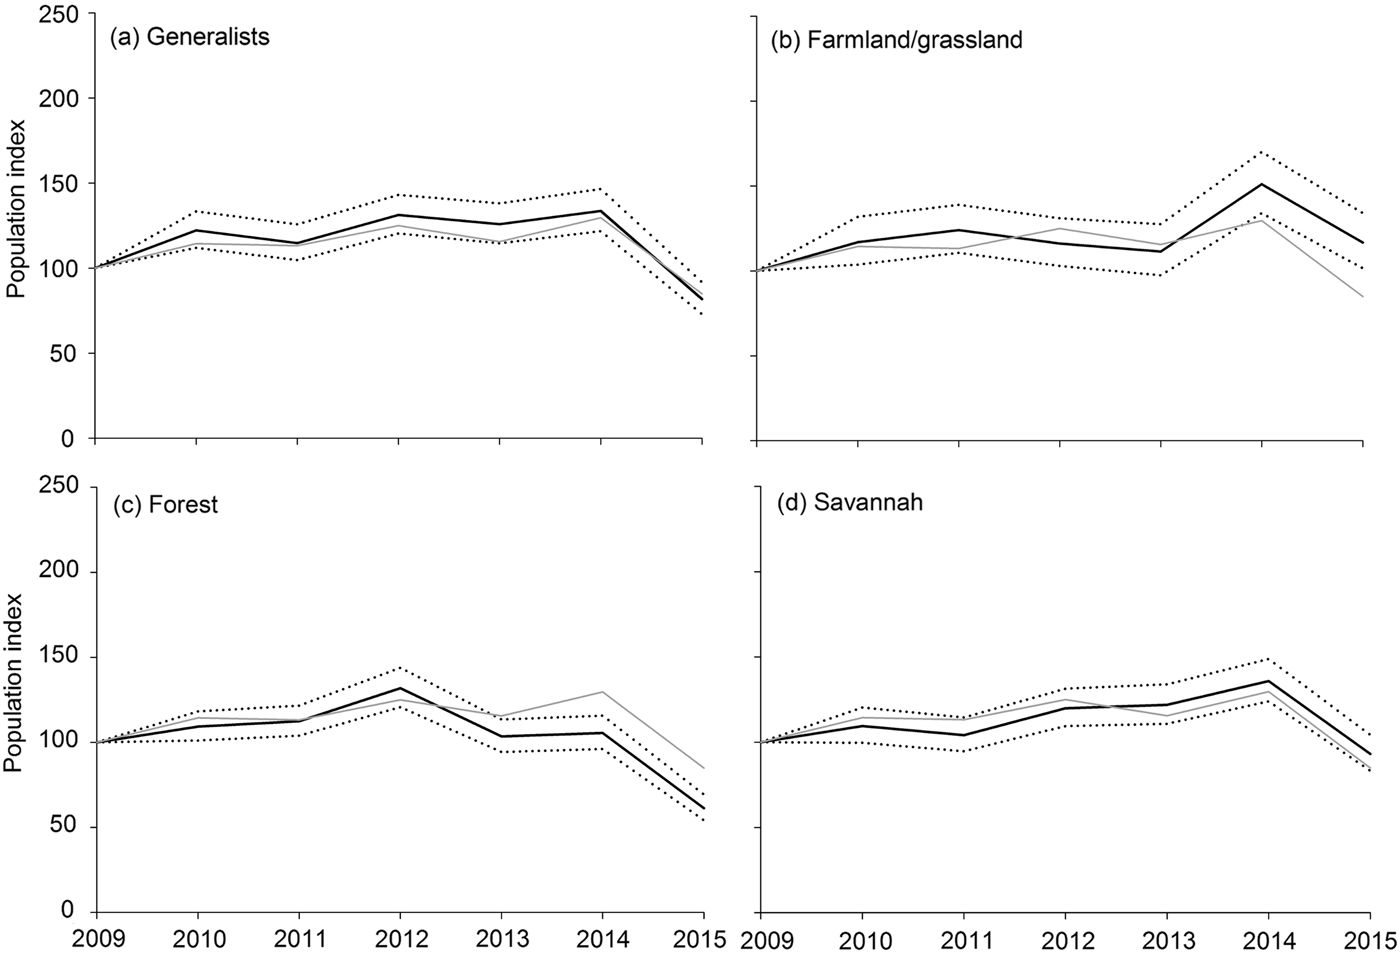
Fig. 7 Wild Bird Indices for (a) habitat generalists (21 species), (b) farmland/grassland specialists (17 species), (c) forest specialists (20 species) and (d) savannah specialists (20 species) in Uganda (with 95% confidence limits), with the overall Wild Bird Index for the country shown in grey.
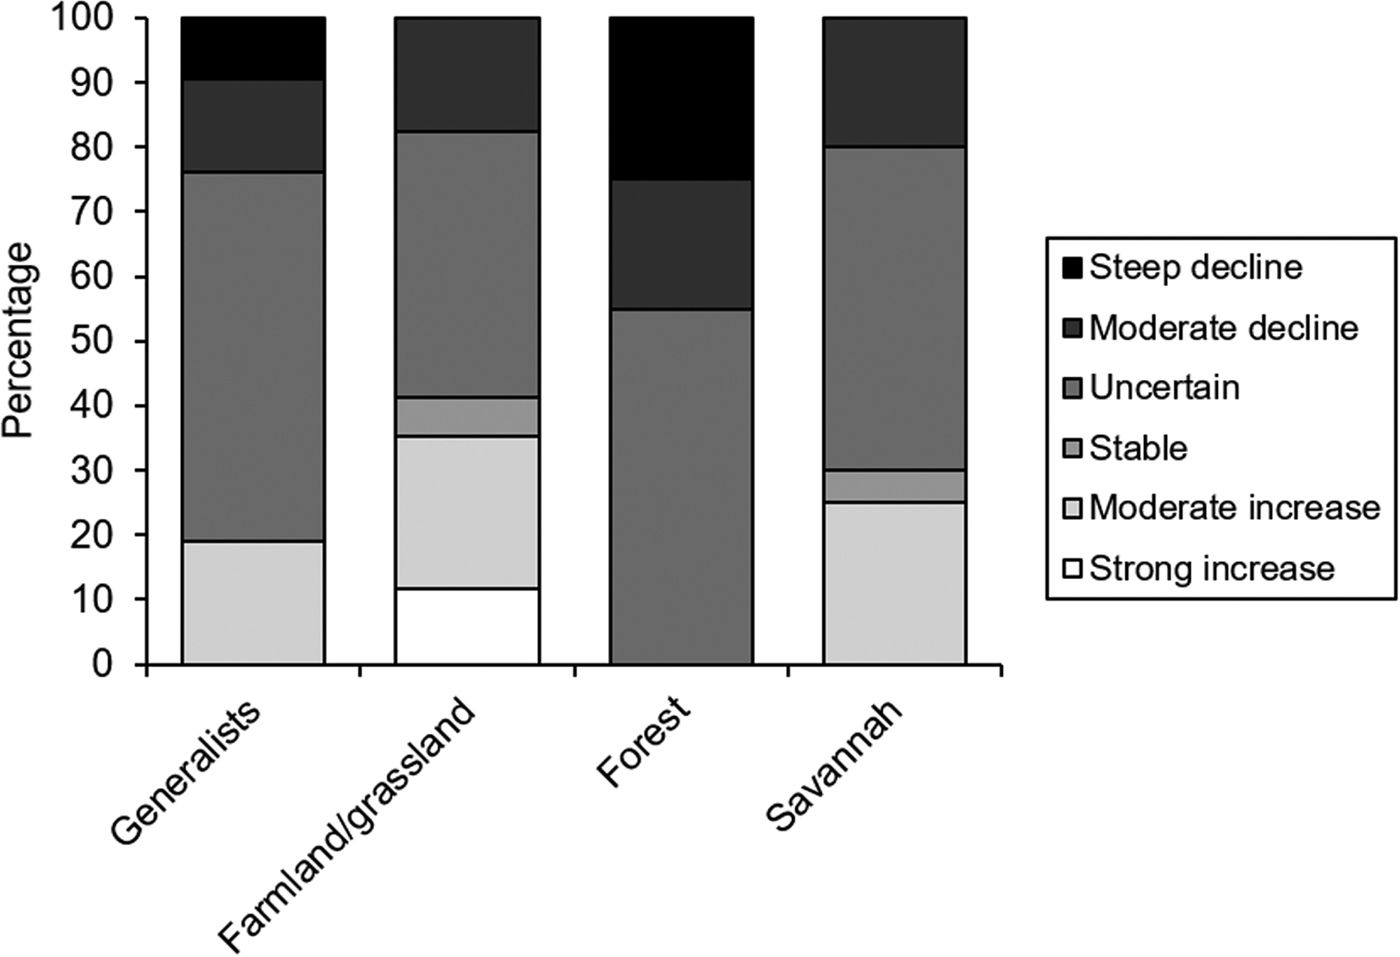
Fig. 8 The percentage of wild bird species in Uganda within each TRIM significance classification.
Afro-Palearctic migrants
The overall trends of Afro-Palearctic migrants in Botswana and Uganda showed a significant moderate increase (Table 2, Fig. 9), with three species in Botswana (the European bee-eater, the barn swallow and the spotted flycatcher) and four in Uganda (the sand martin, the barn swallow, the willow warbler and the whinchat) showing a significant increase. Only the yellow wagtail in Uganda showed a significant decline.

Fig. 9 Wild Bird Index for Afro-Palearctic migrants in Botswana and Uganda, with 95% confidence limits.
Within and outside protected areas
In Botswana the trend within protected areas was a significant moderate increase (+42%), and the trend outside protected areas was a significant strong increase (+80%, Table 2, Figs 10a & 11). In Uganda the trend within protected areas was stable and the trend outside was a moderate decline (−19%, Table 2, Figs 10b & 11).
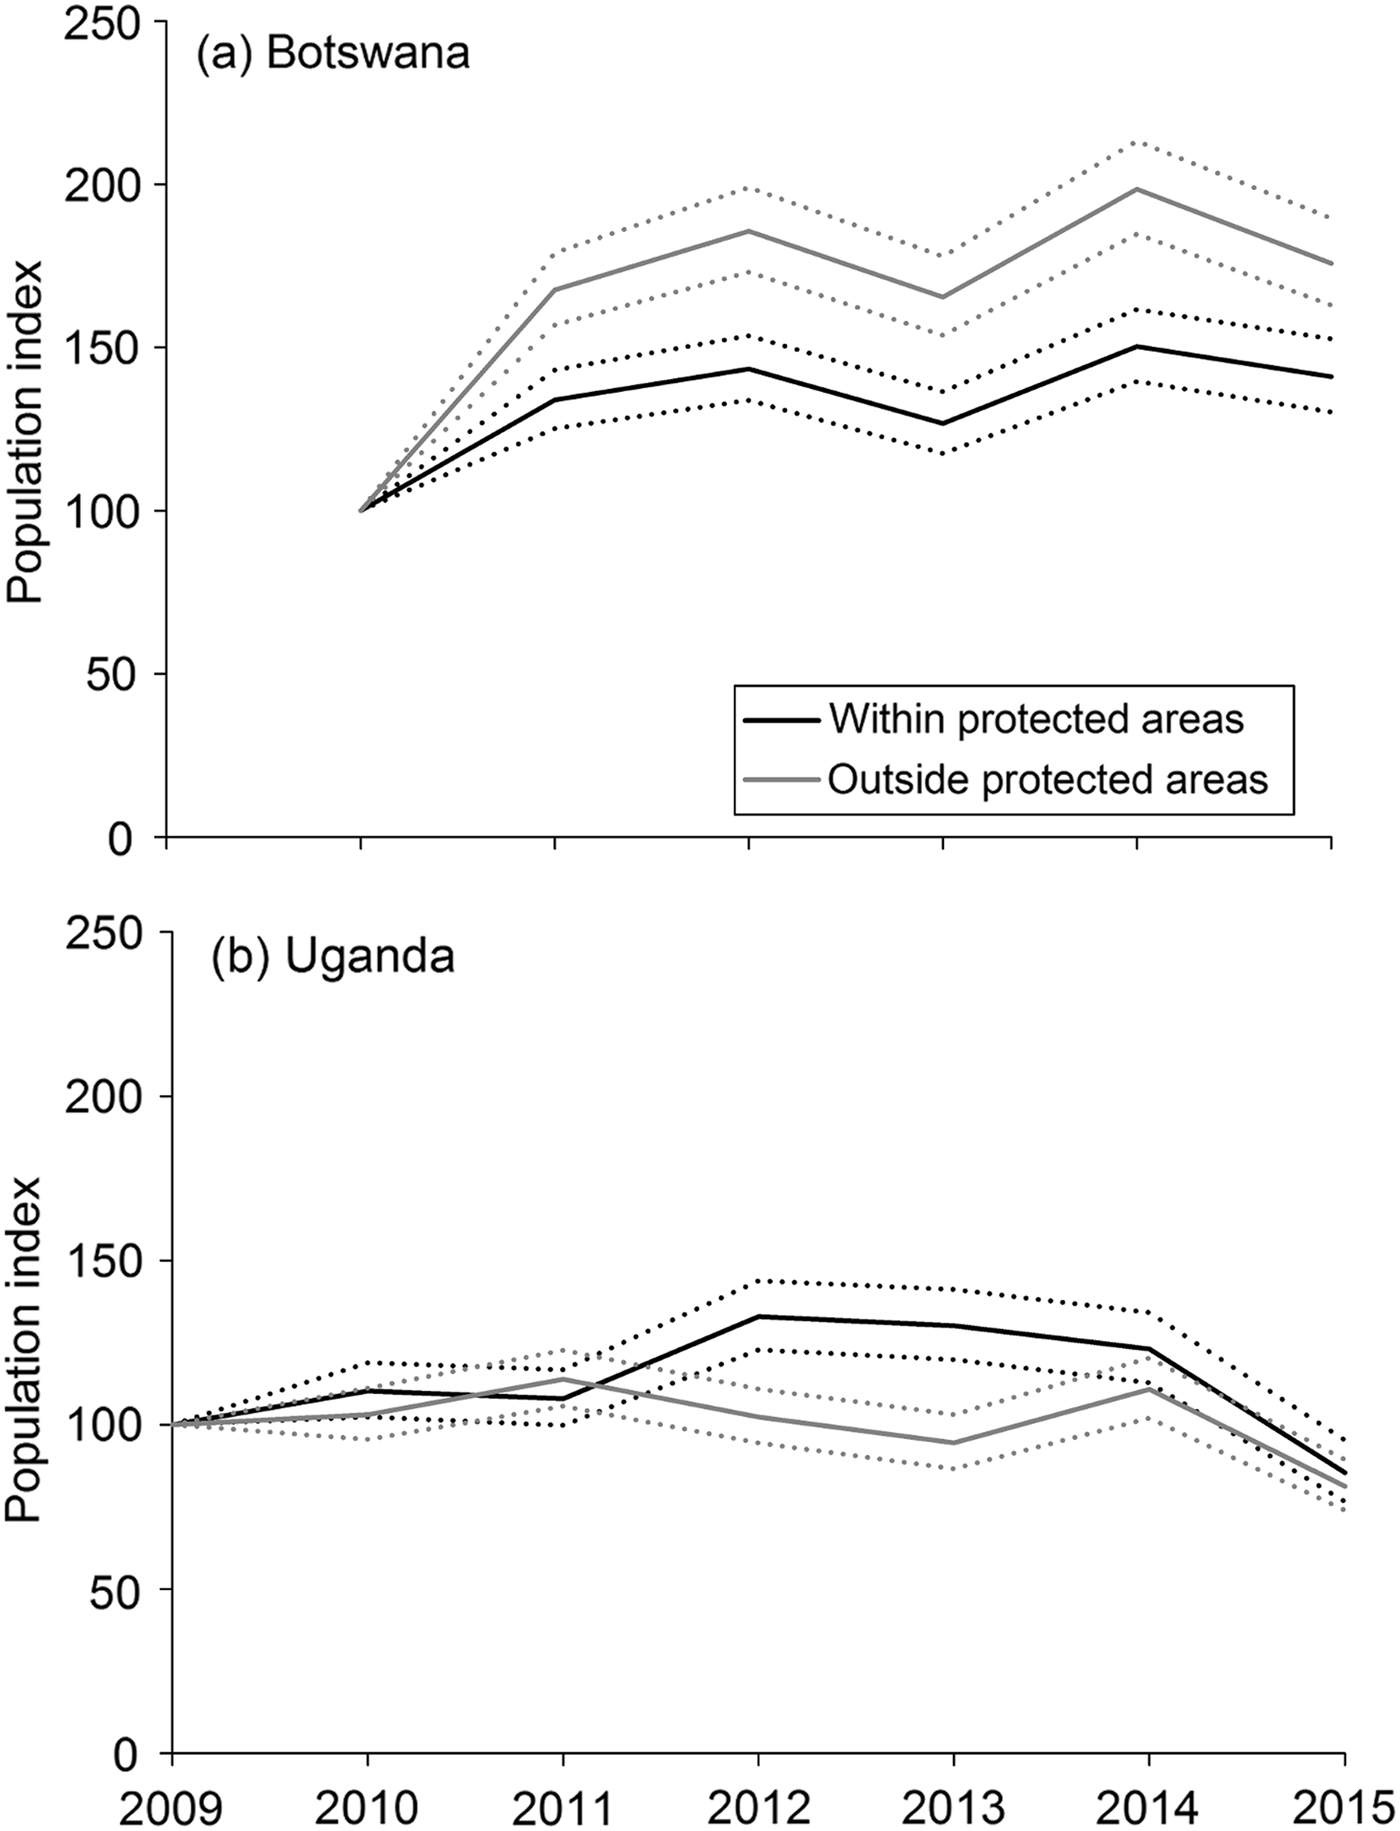
Fig. 10 Wild Bird Indices within and outside protected areas in (a) Botswana and (b) Uganda, with 95% confidence limits.
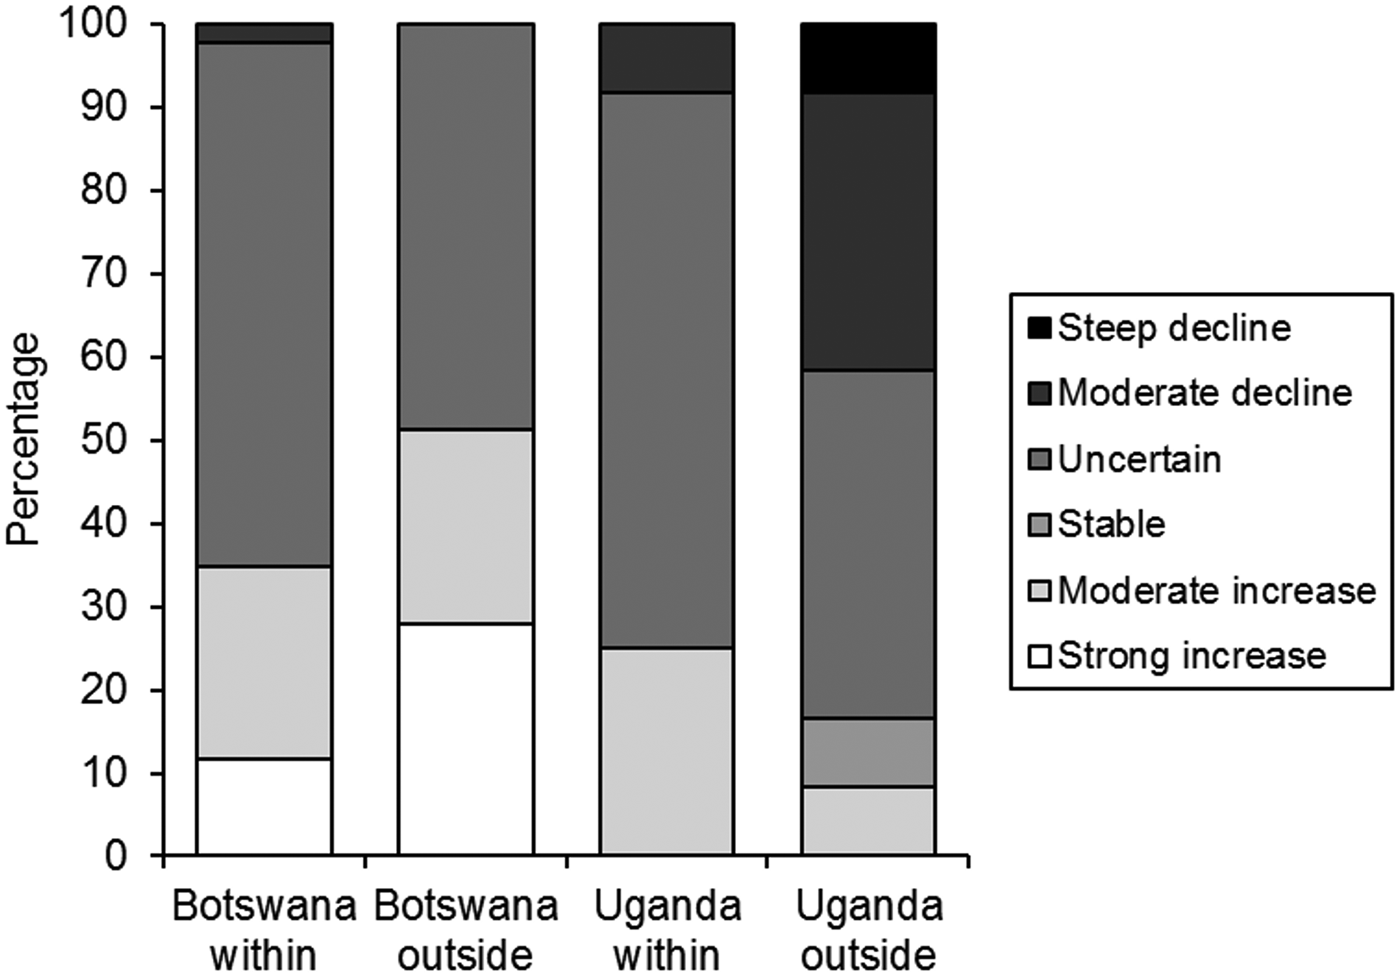
Fig. 11 The percentage of wild bird species within and outside protected areas in Botswana and Uganda within each TRIM significance classification.
Discussion
Robust environmental monitoring is essential for supporting global biodiversity reporting mechanisms (Butchart et al., Reference Butchart, Walpole, Collen, van Strien, Scharlemann and Almond2010; Secretariat of the Convention on Biological Diversity, 2014; Tittensor et al., Reference Tittensor, Walpole, Hill, Boyce, Britten and Burgess2014). It is encouraging that Botswana, Uganda and Kenya now have structured bird monitoring programmes in place to help inform their National Biodiversity Strategies and Action Plans under the Convention on Biological Diversity, and report against the Aichi Targets and Sustainable Development Goals. We hope that this will encourage other countries to invest in well-designed, citizen science-based biodiversity monitoring for land birds and other taxa, as highlighted by Schmeller et al. (Reference Schmeller, Böhm, Arvanitidis, Barber-Meyer, Brummitt and Chandler2017), complementing other biodiversity monitoring schemes that have been established in Africa in recent years, such as the BIOTA project (Jürgens et al., Reference Jürgens, Schmiedel, Haarmeyer, Dengler, Finckh and Goetze2012) and the Southern African Birds Atlas Project (SABAP, 2016). The value of the information collected can only increase as more countries share common standards and knowledge, and share their data outputs, as has occurred in Europe and North America, where cooperation has formed the basis for important research (Pe'er et al., Reference Pe'er, Dicks, Visconti, Arlettaz, Báldi and Benton2014; Inger et al., Reference Inger, Gregory, Duffy, Stott, Voříšek and Gaston2015; Jørgensen et al., Reference Jørgensen, Böhning-Gaese, Thorup, Tøttrup, Chylarecki and Jiguet2016; Stephens et al., Reference Stephens, Mason, Green, Gregory, Sauer and Alison2016; Gamero et al., Reference Gamero, Brotons, Brunner, Foppen, Fornasari and Gregory2017). We echo Stephenson et al. (Reference Stephenson, Bowles-Newark, Regan, Stanwell-Smith, Diagana and Höft2016) in calling on African government departments to work collaboratively to enhance resources for monitoring and develop partnerships with donors; build capacity for data collection; improve coordination and collaboration for biodiversity data management; and produce and use more data-derived products that encourage data use, especially assessments that demonstrate the importance of biodiversity to economies and well-being.
We have shown how it is possible to establish bird monitoring schemes in Africa and we present the first provisional policy-relevant Wild Bird Indices for Botswana and Uganda. We anticipate the same will be feasible for Kenya soon. Although the schemes are too recently implemented to assess changes over the long term, the results suggest some emerging patterns that will require careful scrutiny, and also raise methodological issues for the schemes. They also point to some common challenges that biodiversity monitoring programmes face, and to some important considerations in terms of good practice. Like many long-term monitoring programmes, the schemes described here would be impossible to maintain without a citizen science approach, which is increasingly prevalent in global research (e.g. Cooper et al., Reference Cooper, Shirk and Zuckerberg2014). Although the use of volunteer scientists is not without problems (e.g. Conrad & Hilchey, Reference Conrad and Hilchey2011; Crall et al., Reference Crall, Newman, Stohlgren, Holfelder, Graham and Waller2011), and must be accompanied by adequate scientific oversight (e.g. training, supervision and data verification; Buesching et al., Reference Buesching, Newman and MacDonald2014), we believe that our work shows that this approach could be applied usefully elsewhere.
Developing the monitoring schemes
Developing motivated and skilled citizen scientists is key to the success of volunteer-based schemes. One challenge in Africa is the lack of a tradition and culture of bird watching and systematic recording.
In Botswana and Uganda transects are generally closer to urban areas, given the semi-random selection of sites (Figs 1 & 3), and extensive areas, particularly in Uganda, are still without transects. Yet the stratified nature of transect selection has ensured that broad habitats have been represented and there has been a reasonable division of transects between protected areas and the wider landscape (Supplementary Table S2). A future goal should be to achieve wider geographical coverage, and understand the degree to which the current sampling selection is representative of the land cover in each country, to inform targeted sampling and the development of stratified analysis to reduce bias.
A key issue is how each scheme can be funded over the longer term. It is crucial for each partner to secure a reliable source of in-country funding for the long-term operation and success of the programmes. This remains a challenge. We show that with technical support and a modest investment (c. USD 30,000 (range 20,000–40,000) per year), meaningful biodiversity indicators can be produced to fulfil national, regional and international reporting obligations. Basic resources are needed to cover the full-time post of a national scheme organizer, printing and distribution of survey forms, data and office costs, training workshops, the costs of promotional and training materials, and newsletters to communicate results to surveyors and other stakeholders.
Species trends and indicators
Although the African schemes have been operational for only 6–7 years, the results highlight a number of species with significant trends, both increasing and declining (Table 2). Our trend analysis is reasonably robust and is well established. However, the degree to which we may be able to generalize these findings is dependent on the sampling strategy, and the data are, for a number of practical reasons, spatially biased. We plan to investigate this in more detail and modify sampling and analysis accordingly.
Our analyses indicate differences in trends in land bird populations between Botswana and Uganda, which merits further investigation (Fig. 4). We found relatively little difference in species trends by major habitat, although the decline of forest specialist birds in Uganda is noteworthy (Fig. 5b). There were also differences in species trends in the protected areas of each country (Fig. 10). In Botswana the indicators suggested that common bird populations were faring better outside protected areas (Table 2). In Uganda, the opposite was true (Fig. 10), as might be expected in protected areas. In time, these indices will be useful in assessing the performance of protected areas in each country, at least in relation to common bird populations and as part of a wider assessment. A study of the impact of the protected area network in Europe concluded that protected areas supported higher abundances of many common bird species (especially habitat specialists) but that the network was established too recently to assess its influence on population trends (Pellissier et al., Reference Pellissier, Touroult, Julliard, Siblet and Jiguet2013).
Use of indicators in policy
Bird monitoring data from Botswana, Kenya and Uganda will contribute to wider biodiversity monitoring and reporting, and the State of Uganda's Birds 2014 report is a good example of how this can be achieved (Nature Uganda, 2015).
Data from the schemes have been made available to, and are already being used by, government departments and agencies in each of the countries. In Botswana, data have been used to assist the Ministry of Agriculture in assessing the distribution and abundance of the red-billed quelea; an agricultural pest for which preventative measures are employed by governments to counter crop loss (Elliott, Reference Elliott1990). In Kenya, house crow Corvus splendens abundance and distribution data are being used by BirdLife Kenya to advocate the control of this invasive species to the Kenya Pharmacy and Poisons Board. In Uganda, data from the National Biodiversity Data Bank, including the monitoring scheme data, are being used in Environmental and Social Impact Assessments for the oil industry. With longer-term datasets it will be possible to examine bird populations in relation to other environmental factors, including land-use pressures, climate change and protected area management regimes. The indicators will also be useful for reporting against Aichi Targets 5 (by 2020, the rate of loss of all natural habitats, including forests, is at least halved and where feasible brought close to zero, and degradation and fragmentation is significantly reduced), 7 (by 2020 areas under agriculture, aquaculture and forestry are managed sustainably, ensuring conservation of biodiversity), and 12 (by 2020 the extinction of known threatened species has been prevented and their conservation status, particularly of those most in decline, has been improved and sustained), and Sustainable Development Goal 15 (sustainably manage forests, combat desertification, halt and reverse land degradation, halt biodiversity loss). Hence they are relevant to the Global Biodiversity Outlook of the Convention on Biological Diversity, the United Nations Environment Programme's Global Environment Outlook, and the Intergovernmental Science–Policy Platform on Biodiversity and Ecosystem Services regional assessment for Africa.
Species trends of Afro-Palearctic migrants
Although sample sizes are small, the combined indices for Afro-Palearctic migrants are increasing, reflecting positive trends for most species. This result is perhaps surprising, given the well-established long-term and ongoing declines in their breeding population, at least across western Europe (EBCC, 2016b), and may point to the difficulty in monitoring mobile and variable non-breeding populations and interpreting their trends, given incomplete knowledge of migratory connectivity and non-breeding ranges (Vickery et al., Reference Vickery, Ewing, Smith, Pain, Bairlein, Škorpilová and Gregory2014). Only with more complete monitoring across African countries would we be able to capture and understand trends in migrant birds, both Afro-Palearctic and intra-African migrant species.
Developing a Global Wild Bird Index
The Wild Bird Index project aims to encourage the development of land bird surveys in countries and regions for which data are lacking, and seeks to synthesize relevant information on bird trends globally. As described above, bird monitoring programmes are being developed in a number of countries, raising the prospect of being able to chart the population trajectories of more species, and create more representative species trends over a wider area. If this were possible, such indicators would complement existing global biodiversity indices, such as the Living Planet Index (Loh et al., Reference Loh, Green, Ricketts, Lamoreux, Jenkins, Kapos and Randers2005; Collen et al., Reference Collen, Loh, Whitmee, McRae, Amin and Baillie2009; WWF, 2016) and the Red List Index (Butchart et al., Reference Butchart, Stattersfield, Bennun, Shutes, Akçakaya and Baillie2004, Reference Butchart, Akçakaya, Chanson, Baillie, Collen and Quader2007), which are widely used in biodiversity assessments (e.g. Butchart et al., Reference Butchart, Walpole, Collen, van Strien, Scharlemann and Almond2010; Tittensor et al., Reference Tittensor, Walpole, Hill, Boyce, Britten and Burgess2014). The Wild Bird Index and the Living Planet Index share similar methods but differ in that the underlying trend data for the former come solely from systematically designed bird surveys, whereas for the latter they come from a wide range of sources reporting vertebrate trends. Bird trends from the Wild Bird Index are routinely incorporated into the Living Planet Index (WWF, 2016). The Red List Index describes changes in species’ risk of extinction, derived from repeat assessments, but the trend data produced by count schemes provide one of the key pieces of information required to assess the extinction risk and hence the Red List category of each species, and thereby help to underpin the production of Red List Indices at a variety of scales. In this way, Wild Bird Indices complement and extend the current set of biodiversity indices, and we hope that their geographical coverage can be expanded.
Acknowledgements
We thank the many volunteer surveyors who contributed to data collection. We thank Achilles Byaruhanga, Paul Matiku and Ian Fisher for assistance, and Leo Soldaat for advice on trend analyses. Core funding for this work was provided by the Royal Society for the Protection of Birds. We also thank the European Commission for support through the EUROGEOSS project, Grant Agreement No. 226487, and the Biodiversity Indicator Partnership. In Botswana, additional co-funding came from the Global Environment Facility/Small Grants Programme (BOT/SGP/OP4/CORE/09/12), the Global Environment Facility/United Nations Development Programme (project PIMS no. 5359), Debswana (Contract no. 395-ORA-C005587), the Department of Wildlife and National Parks, and the Department of Environmental Affairs provided significant support.
Author contributions
SRW collated and analysed the data and drafted the article. MAE, IJB, SHMB and RDG provided input to the analysis and the writing. DS, PKN, DP and KJS provided input to the writing. FBM organized the collection of data in Kenya and contributed to the writing. KM organized the collection of data in Botswana and contributed to the writing. DNW organized the collection of data in Uganda and contributed to the writing.
Biographical sketches
SRW oversees the current monitoring schemes as part of the Global Wild Bird Index project, in which MAE, IJB, PKN and RDG are also involved. FBM coordinates the monitoring scheme in Kenya, KM coordinates the monitoring scheme in Botswana and DNW coordinated the monitoring scheme in Uganda until 2016. DS led the design, establishment and development of the monitoring schemes from 2008, along with MAE., RDG, SMHB, KJS and DP. MAE, RDG and SMHB established the overall Global Wild Bird Index programme.


