INTRODUCTION
Measles is a highly contagious disease and still an important health concern [Reference Muscat1]. Numerous efforts such as routine childhood vaccination programmes or the WHO measles elimination plan have significantly reduced the incidence of measles in Europe. The epidemic pattern has changed from a roughly biennial cycle to an irregular sequence of outbreaks [Reference Wallinga, Heijne and Kretzschmar2]. However, disease has not been eradicated. The incidence of measles varies widely, with large outbreaks in Romania, Germany, UK, Switzerland and Italy in 2006 and 2007, whereas in other countries such as Finland, Slovakia and Hungary almost no cases were reported [Reference Muscat1]. Since most measles cases were unvaccinated or incompletely vaccinated, the differences in incidence are likely to be due to differences in the success of national vaccination programmes [Reference Muscat1, Reference Wallinga, Heijne and Kretzschmar2]. For instance, there have been several outbreaks in some of the 16 federal states of Germany in recent years [Reference Siedler3–Reference Wichmann6]. Detailed investigations of selected outbreaks showed that most cases occurred in unvaccinated individuals [Reference Wichmann4].
National surveillance systems such as that at the Robert Koch Institute (RKI), Germany, typically provide weekly time-series of counts stratified by for example, region, age or sex. Accordingly, statistical methods for the analysis of multivariate time-series of counts are needed. It is of public health interest to investigate empirically the relationship between vaccination coverage and the occurrence and size of measles epidemics using such data.
Cummings et al. [Reference Cummings7] used a linear model to analyse the sum of measles cases over 5 years in several provinces of Cameroon, including vaccination coverage among other covariates. However, the time-series aspect was not considered. Multivariate time-series methods for counts of infectious diseases have only recently been developed and applied to epidemiological data. However, these models are not able to cope with occasional large outbreaks. For instance, Frank et al. [Reference Frank8] investigated the association between human infection with Shiga toxin-producing Escherichia coli (STEC) and cattle density based on German notification data. A Bayesian Poisson regression model was used to analyse the weekly number of cases in each age group and district of Germany. The model accounted for temporal and seasonal trends, spatial variation and cattle density as explanatory factors. No large STEC gastroenteritis outbreaks occurred in the time period considered. Hens et al. [Reference Hens9] modelled the yearly, age-stratified incidence of hepatitis B in Bulgaria using a log-additive Poisson model, where age and time were modelled as non-parametric functions. The impact of vaccination was taken into account by including indicators for various immunization programmes as covariates. The log-additive Poisson model chosen was justified since the data contained no outbreaks.
If there are outbreaks in the data, a more realistic formulation for (multivariate) time-series of infectious disease counts has been suggested by Held et al. [Reference Held, Höhle and Hofmann10]. The model decomposes the disease incidence into two additive components. One component represents an autoregression on past counts which allows for temporal dependence beyond regular patterns, i.e. epidemic behaviour. The other component accounts for regular, endemic behaviour. However, this method did not consider the inclusion of covariates.
The aim of this paper is to investigate the association between vaccination coverage and the size and occurrence of measles epidemics. We first describe the data about measles incidence [11] and vaccination coverage [12] in Germany obtained from the RKI. The approach of Held et al. [Reference Held, Höhle and Hofmann10] is extended to allow for the inclusion of covariates and applied to the measles data using vaccination coverage as an explanatory variable. Different formulations of the proposed model are compared based on Akaike's Information Criterion (AIC [Reference Lindsey and Jones13]). A simulation study is performed in order to further investigate the ability of AIC to identify the underlying true model.
DATA
Measles incidence
In Germany, introduction of the measles vaccine had reduced the incidence of measles to a historical low of 0·2 cases/100 000 inhabitants in 2004 [Reference Siedler3], before the disease re-emerged due to outbreaks in a few regions. We used measles surveillance data from Germany for the years 2005–2007, which contain weekly counts of cases for all ages in all 16 federal states reported to the RKI [11]. Figure 1 shows the notified measles cases in the years 2005–2007 for six selected federal states to illustrate the different incidence patterns. Large outbreaks occurred in Hesse and Bavaria in 2005 [Reference Siedler3], in North Rhine-Westphalia in 2006 [Reference Wichmann4] and in North Rhine-Westphalia and Bavaria in 2007 [Reference Bernard5]. The majority of cases (~80%) occurred in children and adolescents. About 12% occurred in infants aged <2 years. This pattern was very similar in all three years considered. A brief summary of the number of reported cases in each state is shown in Table 1 together with population numbers at 31 December 2006 obtained from the Federal Statistical Office of Germany [14].
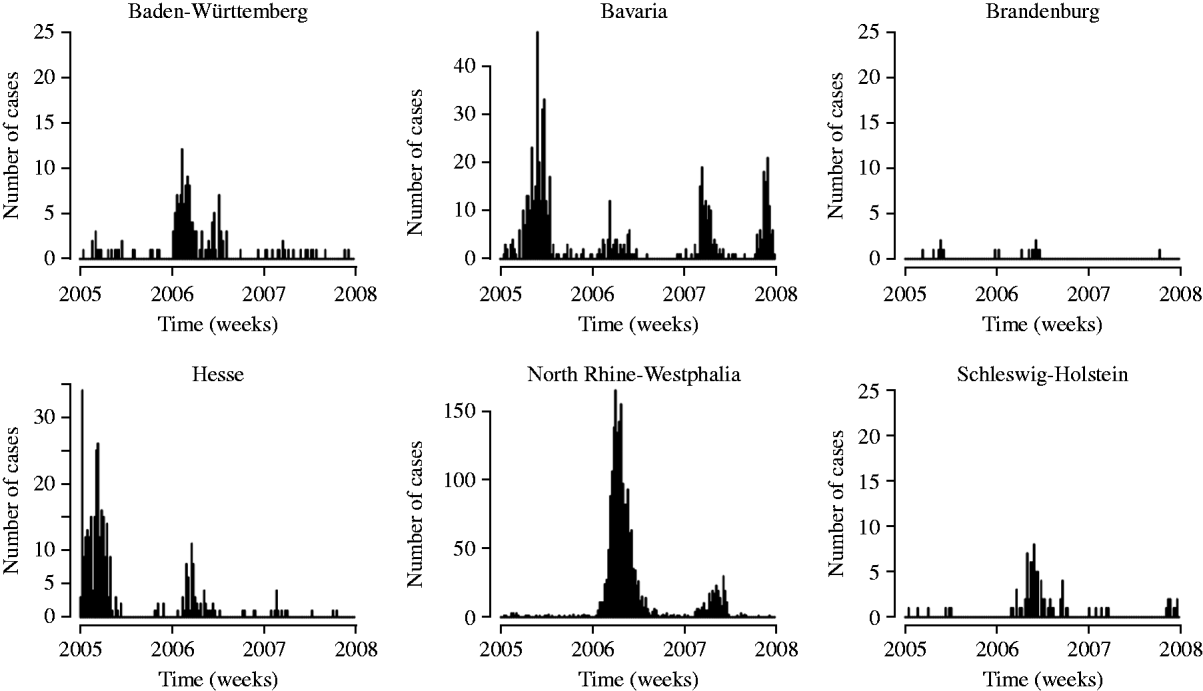
Fig. 1. Number of weekly measles cases in selected German federal states for the years 2005–2007. Note that the y-axis is not the same for all states.
Table 1. Measles cases and estimated vaccination coverage in the 16 federal states of Germany
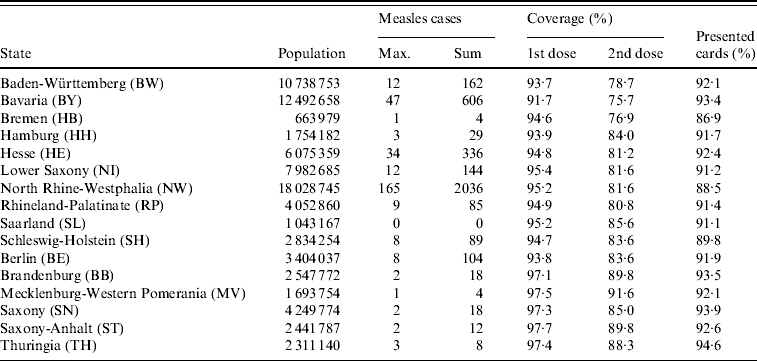
Population estimated at 31 December 2006; maximum and total number of weekly measles cases from week 1, 2005 to week 52, 2007; coverage at school entry for the first and second dose of MMR vaccine in 2006 estimated from children presenting vaccination cards at school entry examinations; percentage of children with a vaccination card.
Measles-mumps-rubella (MMR) vaccination
Coverage levels of the combined MMR vaccine were derived from vaccination cards presented at medical examinations, which are conducted by local health authorities at school entry [12]. Records include information about receipt of the first and second doses of MMR, but no information about dates or age of the child at vaccination. Age at school entry ranges between states from 4 to 7 years [Reference Kalies15], therefore the information collected typically refers to vaccinations received 3–5 years previously [Reference Reiter and Poethko-Müller16].
The estimated coverage data do not include any information from children who did not present a vaccination card on the day of the medical examination (5–13% of children attending the school entry examination in different states). This is likely to overestimate true coverage, because the vaccination status of children with vaccination cards is generally more complete than in those without a card [Reference Wichmann4, Reference Poethko-Müller17]. However, there are no national data about the degree of overestimation. We made an assumption, which was used in a previous German study [Reference Tischer, Siedler and Rasch18], that for each dose, the percentage of children without a vaccination card, ‘non-card holders’ was half that of ‘card holders’. We applied this adjustment to all analyses and conducted a sensitivity analysis to examine the robustness of the assumption.
Coverage levels for both the first and the second dose were higher in the new, re-established states in East Germany (Brandenburg, Mecklenburg-Western Pomerania, Saxony, Saxony-Anhalt, Thuringia) than in West Germany (Table 1). This might reflect continuing adherence to different childhood vaccination policies before re-unification [Reference Kalies15, Reference Hellenbrand19]. Immunization is voluntary in Germany now, but it was mandatory in the former German Democratic Republic.
METHODS
To investigate a possible association between the occurrence of measles epidemics and MMR vaccination coverage, we first examined the correlation between the number of observed cases in a region and region-specific vaccination coverage. One possibility is to apply the variance-stabilizing transformation for Poisson counts [Reference Palmgren, Armitage and Colton20], i.e. taking the square root of cases, before estimating the empirical correlation coefficient which might improve the goodness of the corresponding confidence intervals. An alternative approach, based on a Poisson regression model [Reference Kirkwood and Sterne21, Reference Kuhn, Davidson and Durkin22], assumes that the sum of cases in region i, aggregated over all three years, has mean
where x i denotes the coverage in state i. For example, to adjust for regionally varying population numbers, the right hand side of equation (1) can be multiplied by an offset n i. Conclusions about the effect β of the covariate x i in equation (1) remain the same when considering the weekly number of cases instead of the sum of cases, assuming that the weekly counts are independent. However, a multivariate time-series analysis of counts is able to incorporate autocorrelation and provides many more possibilities compared to the analysis of temporally aggregated data.
In the following, y i,t denotes the number of cases of a specific disease in a defined geographical region i=1, …, I at time t=1, …, T. A fundamental assumption of a Poisson regression model is that the response variables y i,t are independent given the covariates. Thus the above model is not suited for the analysis of the measles data as the weekly counts are clearly dependent. Regular temporal dependence can easily be accounted for by including covariates for long-term or seasonal trends in the model. For instance, seasonal variation can be modelled parametrically using a superposition of harmonic waves [Reference Held, Höhle and Hofmann10, Reference Paul, Held and Toschke23] or non-parametrically [Reference Hens9, Reference Knorr-Held and Richardson24]. However, such a model may still not adequately capture occasional outbreaks typical for infectious diseases.
A natural way to incorporate temporal dependence beyond seasonal variation is to consider the number of past cases as additional explanatory variables in the model. Held et al. [Reference Held, Höhle and Hofmann10] suggest a Poisson regression model with an identity link, where the (conditional) mean μi,t of y i,t is additively decomposed into two parts
The first part with conditional rate λy i,t−1 is called the ‘epidemic’ component and the second part with rate νi,t the ‘endemic’ component. The former component captures occasional (epidemic) outbreaks whereas the latter describes regular (endemic) patterns.
To include region-specific covariate information, we allow the autoregressive parameter λ in equation (2) to vary across regions, i.e. we switch notation from λ to λi and model λi as a function of these covariates. Furthermore, covariates can also be considered in the other component νi,t. Note that the conditional mean μi,t needs to be non-negative. This can be ensured by modelling both λi and νi,t on a log-scale.
Our first model (type A) assumes that the coverage levels in all states, x i, enter into the epidemic component and the model is given by
where β0 is an intercept and β1 quantifies the influence of vaccination coverage. The parameter α0 denotes the intercept of the endemic component and the offset log(n i) represents population fractions, computed from Table 1. The terms in curly brackets in equation (4) are used to model seasonal variation. The number of data points per season is denoted by f. For instance, for a season of 1 year and weekly data f=52. For ease of interpretation, the seasonal terms can be written equivalently as a sine wave with amplitude A describing the magnitude, and phase difference ϕ describing the onset of the seasonal pattern [Reference Paul, Held and Toschke23]. In the second model, the term β1x i is omitted in equation (3) and the coverage levels x i are included instead in the endemic component with coefficient α1. Altogether, the model (type B) is given by
To investigate the impact of the explanatory variable, we also consider a model of type C, given by equations (4) and (5), where no covariate is included. Additionally, a standard log-linear Poisson regression model without the autoregressive component is fitted (model D).
For the model of type A we use the log proportion of unvaccinated school starters as explanatory variable x i in equation (3) in accordance with the mass action principle [Reference Anderson and May25]. This principle assumes that the rate of disease spread is proportional to the product of the density of susceptibles (unvaccinated school starters) multiplied by the density of infected individuals (reported cases). Taking the logarithm of the proportion of unvaccinated school starters produces the multiplicative relation (model A0). Similarly, the log proportion of all school starters who received at most one dose of MMR vaccine is used as an explanatory variable. We used the same covariates in the model of type B.
Maximum likelihood (ML) estimates of parameters and standard errors (s.e.) are obtained by numerically maximizing the respective Poisson log-likelihood. Standard software for linear Poisson regression cannot be used because of the nonlinearity of the parameters. Therefore, the quasi-Newton BFGS method implemented in the R [26] function optim is used for optimization. The fitting procedure and the measles data are integrated in the R package surveillance ([Reference Höhle27]; http://surveillance.r-forge.r-project.org). Note that models involving more than one covariate, time-varying covariates or additional seasonal terms at higher frequencies [Reference Diggle28] can also be fitted with this function in surveillance.
The models investigated in the Results section are compared based on the model choice AIC criterion. We were particularly interested in the ability of AIC to distinguish between the model types A and B. In order to investigate this we conducted a simulation study (see Appendix).
RESULTS
The sum of cases over the years 2005–2007 in each state is negatively correlated with coverage for both the first and second dose of MMR vaccine (Table 2). Absolute correlation increases slightly when taking the square root of cases. However, the statistical evidence for correlation is weak, since the upper 95% confidence limits are always positive.
Table 2. Estimated Pearson's correlation coefficient, r, with 95% confidence intervals

We describe here an analysis of the multivariate time-series of counts to further investigate the measles incidence patterns. The generation time [Reference Anderson and May25] for measles, i.e. the average time between the onset of symptoms in one case and the onset of symptoms in a second case directly infected by the first, is about 10 days [Reference Anderson and May25, Reference Fine and Clarkson29]. We therefore aggregate measles cases in successive bi-weekly periods to better reflect this characteristic time-scale [Reference Cliff and Haggett30, Reference Finkenstädt and Grenfell31]. AIC is used as a model choice criterion. The simulation study, discussed in detail in the Appendix, showed that this criterion is suitable for the comparison of the different model formulations.
The results of the analysis of the bi-weekly aggregated measles data are summarized in Table 3. All considered models contain an overall intercept α0, a seasonal term and population fractions n i as offset. The last two models in the table contain no covariates. When including only an intercept in the epidemic component (model C), the fit improves substantially compared to a model without autoregression (model D). The ML estimate of λ=exp(β0) is quite high, ![]() =0·85 (s.e.=0·02), which indicates a strong dependence on the number of counts at the previous time point after adjustment for seasonal effects. Consequently, the use of a Poisson regression model (without autoregression) seems inappropriate for these data. Indeed, the series of deviance residuals obtained from model D showed considerable autocorrelation compared with model C, which showed almost no autocorrelation.
=0·85 (s.e.=0·02), which indicates a strong dependence on the number of counts at the previous time point after adjustment for seasonal effects. Consequently, the use of a Poisson regression model (without autoregression) seems inappropriate for these data. Indeed, the series of deviance residuals obtained from model D showed considerable autocorrelation compared with model C, which showed almost no autocorrelation.
Table 3. Analysis of bi-weekly aggregated measles data

The log-likelihood is denoted by log(L); p is the number of parameters and Akaike's Information Criterion (AIC)=−2log(L)+2p; lower AIC values indicate better fit. The parameters β0 and α0 denote intercepts; β1 and α1 denote the effect of the covariate; A and ϕ denote the amplitude and onset of the seasonal pattern. The standard error is denoted by s.e.
In the next step, we investigated the impact of the inclusion of vaccination coverage in either the epidemic or endemic component compared to model C. Inclusion of the log proportion of unvaccinated school starters in the epidemic component (model A0) leads to a considerably better fit.
The effect of the covariate β1 in model A0 is clearly significant (P<0·0001). Note that the estimated coefficients in the endemic component remain similar as in model C while the autoregressive parameter now varies across states. Inclusion of the covariate into the endemic component (model B0) also improves the fit compared to model C but is worse compared to model A0 according to AIC.
The above conclusions also hold when including the log proportion of school starters with at most one dose of MMR vaccine (models A1, B1). However, the model fit is considerably worse in terms of AIC. All results in Table 3 are based on the assumption that the coverage levels of the non-card holders are half those of card holders (adjustment factor 0·5). We tried several adjustment factors to investigate the robustness of our results. The ranking of the models according to AIC does not change for an adjustment factor <0·6. With regard to AIC an adjustment factor of 0·2 yields the best fit.
Figure 2 shows the estimated parameters λi and corresponding 95% confidence intervals for models A0 and A1 for each state. There is considerable heterogeneity across states. The ML estimates for the five states in East Germany are markedly lower than estimates for the remaining states. Vaccination coverage is considerably higher in these states. Note that model A0 which includes the log proportion of unvaccinated school starters in the epidemic component performs better in terms of AIC than a model with the original (untransformed) proportion.
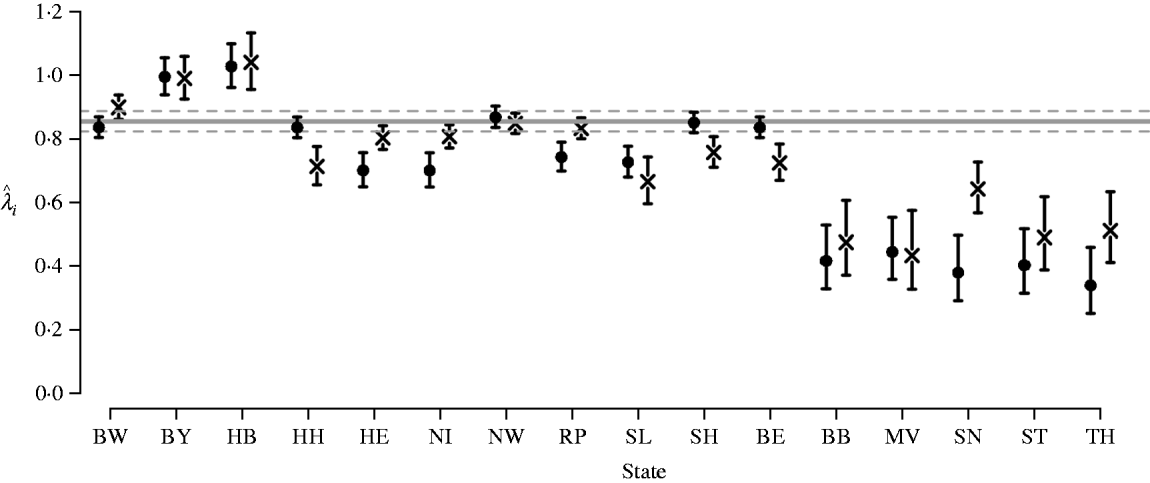
Fig. 2. Estimated autoregressive parameters ![]() and corresponding 95% confidence intervals for models A0 (•) and A1 (×). For comparison, the horizontal line denotes the estimated parameter
and corresponding 95% confidence intervals for models A0 (•) and A1 (×). For comparison, the horizontal line denotes the estimated parameter ![]() for model C without covariates with the dashed lines representing the corresponding 95% confidence intervals. For definition of state abbreviations see Table 1.
for model C without covariates with the dashed lines representing the corresponding 95% confidence intervals. For definition of state abbreviations see Table 1.
The analysis of the multivariate time-series of measles surveillance counts showed that there is an association between vaccination coverage and the occurrence and size of measles epidemics within states, with model A0 fitting best. Figure 3 shows the fitted number of cases, decomposed into endemic and epidemic components, for this model in three of the states shown in Figure 1 for illustrative purposes. The estimated mean is clearly dominated by the epidemic component.
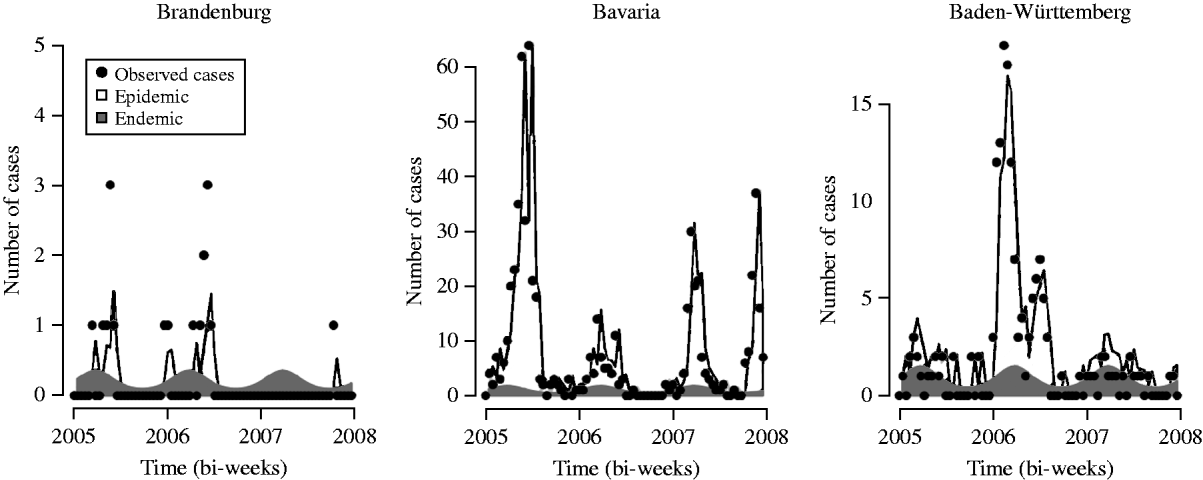
Fig. 3. Fitted mean for model A0, which includes the log proportion of unvaccinated school starters as covariate in the epidemic component, in selected states.
DISCUSSION
We observed a significant association between estimated vaccination coverage at school entry and the overall incidence of measles in the federal states of Germany (Table 3). The inclusion of the log proportion of unvaccinated school starters in the epidemic component of the model is the most suitable formulation to describe the occurrence and size of measles epidemics. This is plausible since the proportion of unvaccinated school starters acts as a proxy for the population of susceptibles, and the number of cases at a future time point depends on the number of infectious cases in the present as well as on the number of individuals susceptible to infection.
A strength of the proposed model is the decomposition of the disease incidence into an endemic and an epidemic component. Compared to a standard log-linear Poisson regression model our formulation is able to account for occasional outbreaks by including an autoregressive component. This is particularly important for the analysis of highly infectious diseases such as measles. In addition, information about vaccination coverage was included to cope with regional heterogeneity.
There are some limitations to this study. The RKI also provides estimates of vaccination coverage at school entry for children aged 4–7 for the years 2005 and 2007. However, the measles data comprise cases of all ages. Thus, changes in age-specific vaccination coverage may lead to shifts in the age distribution of the number of cases, but it will be impossible to discern such shifts from age-aggregated surveillance data. In addition, there is uncertainty about the true vaccination status, when obtained from school entry examinations. Hence small changes in coverage levels in successive years are not expected to be particularly meaningful. Therefore, we used only data for 2006 as an approximate measure of the overall immunization status in each state in all age groups.
We were aware that vaccination coverage was probably overestimated because vaccination uptake in school starters who presented vaccination cards is assumed to be higher [12]. Roughly 10% of school starters did not present vaccination cards and coverage for them is unknown. To assess the sensitivity of the assumed coverage for those without cards (0·5 times that of card holders) we considered values ranging from the same coverage as children who presented cards (corresponding to 1) to all children who did not present cards being unvaccinated (corresponding to 0). In terms of AIC, model B where the covariate is included in the endemic component is not very sensitive with regard to the assumed coverage. In contrast, the AIC for model A where the covariate is included in the epidemic component changes considerably. When coverage for non-card holders is >0·6 times that of card holders, model B is preferred.
Wichmann et al. [Reference Wichmann4] investigated a local outbreak in a school in Duisburg (North Rhine-Westphalia) in 2006. They estimated that receipt of one dose of MMR in the 22% without cards was 75% (significantly lower than the coverage of 95% in students with vaccination cards). This corresponds to a coverage level for non-card holders around 0·8 times that of card holders. However, this investigation involved only one school and no information about uncertainty around the estimated 75% coverage was given. The results are probably not generalizable to data at state level in this study. According to AIC, the measles data in our study are best described assuming coverage in non-card holders of 0·2 times that of card holders and using a model in which the proportion of unvaccinated school starters is incorporated in the epidemic component of the model.
To investigate the ability of AIC to identify the correct type of the model, we conducted a simulation study (Appendix). We used a simple model, comparable to the model of type A, where vaccination coverage influences the epidemic component. The simulation study showed that AIC identifies the true underlying model as long as the influence of vaccination coverage is strong or non-existent.
The proposed model approach allows us to consider infectious disease counts with several time-varying covariates. If quarterly, age-specific vaccination coverage was available, it could also be investigated whether vaccination-related trends in age-specific incidence [Reference Fine and Clarkson32] are observable using such notification data. Another interesting aspect would be to investigate the behaviour of the model where vaccination coverage is simultaneously included as an explanatory variable in both components. In this case, attention should be paid to potential issues related to multicollinearity or identifiability of parameter estimates.
In order to apply the proposed model to data at a finer spatial resolution we would need more detailed information about vaccination coverage because there are great regional and local differences leading to immunization gaps [Reference Wichmann6, Reference Kalies15]. For example, coverage levels for one dose of MMR vaccine ranged from 77·5% to 98% in the 77 health districts of Bavaria at school entry examinations 2005/2006 [33]. At a finer spatial resolution, it might also be necessary to account for spatio-temporal dependence, e.g. due to commuting. This could be done by including the previous number of cases in adjacent regions in the epidemic component [Reference Held, Höhle and Hofmann10, Reference Paul, Held and Toschke23].
Although the data on measles incidence and vaccination coverage have some limitations, clear associations were observed. The pattern observed in the reported measles cases for all ages is best described by including the log proportion of unvaccinated school starters as an explanatory variable in the autoregressive (epidemic) component of the model.
APPENDIX: Simulation study
We investigated whether AIC identifies the correct structure of the model with a simulation study. Multivariate time-series of length T=156 (3 years of weekly data) were simulated based on a model where the number of cases y i,t in region i at time t is influenced by vaccination coverage as a covariate. Each simulated dataset is analysed with different models and AIC is calculated.
We assumed that vaccination coverage influences the epidemic component, which also contains an intercept. The endemic component contains no seasonal terms, an overall intercept α0 and population fractions n i as offset. Four randomly selected regions are used where the population sizes N i are selected from population data of Germany in 2006 and artificial vaccination coverage levels x i are attached (see Table 4). The coverage levels x i differ between the regions and have been transformed with log(1 – x i) as in the measles analysis. The simulation model corresponds to model A in Table 5 and is similar to model A0 for the measles data (Table 3).
Table 4. Population sizes (Ni) and corresponding vaccination coverage levels (xi) used in the simulation study

The states used in the simulation study were selected at random. The population fraction is denoted by n i.
Table 5. Models for the simulation analysis

We chose different values for the yearly incidence c (10−4, 10−5) and the basic level of the epidemic component not influenced by covariates, ![]() (0·5, 0·8). Furthermore, we assumed that vaccination coverage has either no (β1=0), a small (β1=0·1), or a strong (β1=0·5) influence. All combinations of these values give 12 different simulation scenarios. For each of these scenarios, 1000 datasets have been simulated. The incidence c and the population size N i are used to calculate the mean number of cases for the first week μi,1 for each region with μi,1=cN i /52. The parameter
(0·5, 0·8). Furthermore, we assumed that vaccination coverage has either no (β1=0), a small (β1=0·1), or a strong (β1=0·5) influence. All combinations of these values give 12 different simulation scenarios. For each of these scenarios, 1000 datasets have been simulated. The incidence c and the population size N i are used to calculate the mean number of cases for the first week μi,1 for each region with μi,1=cN i /52. The parameter ![]() is used to calculate the intercept β0 as a basic level
is used to calculate the intercept β0 as a basic level
Next, the epidemic component λi is calculated as in model A (Table 5) and used for the simulation. The endemic component ν is calculated with the stationary mean equation [Reference Held, Höhle and Hofmann10]

and is the same for all regions. The cases y i,t are simulated for each region i and point in time t as follows:

For the analysis of each simulated dataset three different models, listed in Table 5, have been considered. The models differ with regard to the influence of vaccination coverage: in the epidemic component, in the endemic component, or none. Note that the values of the covariates used in the analysis are the same as in the simulation.
The results of the analysis are shown in Table 6. In all simulations where there was no influence of vaccination coverage the true underlying model C resulted most frequently in the lowest AIC value (i.e. highest AIC %). When there was a small influence of vaccination coverage in the epidemic component, AIC in general preferred model C with no influence, followed by model A with influence in the epidemic component. When there was a strong influence, model A is clearly preferred. In summary, AIC identifies the true underlying model as long as the influence of vaccination coverage is strong or non-existent.
Table 6. Results for the simulation study
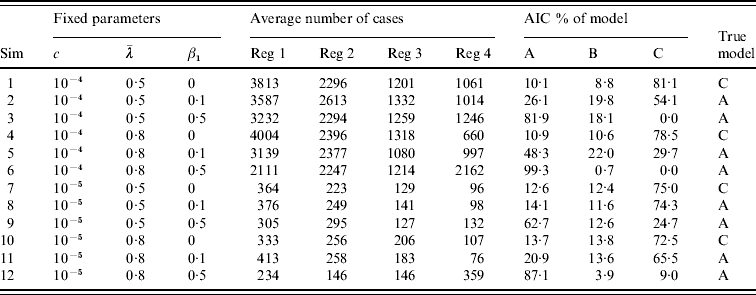
AIC, Akaike's Information Criterion.
Parameter values are shown for the simulations (Sim), the mean number of cases for each region (Reg), and how often each model has the lowest AIC value (AIC % of model).
ACKNOWLEDGEMENTS
We thank J. C. M. Heijne and N. Low for valuable comments and suggestions. Financial support by the Swiss National Science Foundation is gratefully acknowledged.
DECLARATION OF INTEREST
None.


