Anaemia is one of the most common conditions globally, and the highest prevalences are in South-East Asia, the Eastern Mediterranean, and Africa. In 2011, the worldwide prevalence of anaemia was 43 % (273 million) in children, 29 % (496 million) in non-pregnant women, 38 % (32 million) in pregnant women, and 29 % (529 million) in reproductive-age women. The most clinically significant effects of anaemia are adverse outcomes of pregnancy, physical and cognitive impairment, increased risk of disease in children, and reduced productivity in adults. Anaemia is responsible for about 20 % of all deaths in pregnant women( 1 ).
About 42 % of anaemia in children and 50 % of anaemia in women are due to iron deficiency (ID)( 1 ), and ID is the most common cause of anaemia worldwide( 2 ). In 2015, anaemia was an important condition affecting people worldwide( 3 ). The Global Burden of Diseases, Injuries, and Risk Factors Study 2016 (GBD 2016) showed that iron deficiency anaemia (IDA) was a major cause of years lived with disabilities (YLDs), contributing 34·7 million cases (95 % uncertainty interval (UI) 23·0 – 49·6 million) of total YLDs( 4 ).
In 2012, the WHO identified six global nutrition targets to be achieved by 2025, one of which is a 50 % reduction in the prevalence of anaemia for women of reproductive age( 5 ). This corresponds to a reduction of about 6 % per year for this population. The strategies proposed to achieve this goal include increasing dietary diversity, distributing iron supplements, controlling infectious diseases and malaria, and fortifying foods with iron, folic acid, and other micronutrients. Food fortification can be implemented on a large-scale (mass fortification). For example, iron can be added to staple foods consumed by the general population (e.g. wheat flour, maize flour, corn meals, rice, and condiments) or to foods consumed by people with the greatest risk of anaemia, such as biscuits for students and women( 6 ). Bread consumption is high in Eastern Mediterranean countries; therefore, iron-fortified flour may effectively reduce the prevalence of iron deficiency anaemia in this region( 7 ).
Researchers must evaluate programmes that provide iron fortification of staple foods, such as flour, to confirm the effect of these interventions( Reference Yip and Ramakrishnan 8 ). The results of recent systematic reviews were equivocal regarding the effect of iron-fortified flour on iron status, especially in regard to the prevalence of IDA. Therefore, policymakers need more definitive evaluations of the effectiveness of iron-fortified flour.
The present meta-analysis evaluated the effectiveness of iron-fortified flour on the levels of haemoglobin and ferritin, and on the risks of anaemia, ID, and IDA with stratification by study design. All types of flour and all ages and gender groups were included in the analysis.
Methods
Search strategy
Database searches were performed during February and March of 2019 for literature published up to December 2018 in the English and Persian languages. Some authors were also contacted to identify additional studies. The reference lists of all identified articles were also screened. Electronic databases, including Cochrane Central Register of Controlled Trials (CENTRAL), Database of Abstracts of Reviews of Effects (DARE), International Clinical Trials Registry Platform (ICTRP), PubMed, Clinicaltrials.gov, World Health Organization Library Information System (WHOLIS), and Scientific Information Database (SID) were searched using the following keywords and queries: (fortif*[Title]) AND iron [Title], (fortif*[Title]) AND hemoglobin/haemoglobin [Title], (fortif*[Title]) AND ferritin [Title], (fortif*[Title]) AND anemia/anaemia [Title], (fortif*[Title]) AND iron deficiency [Title], (fortif*[Title]) AND iron deficiency anemia/anaemia [Title], (iron [Title]) AND flour [Title], (fortif*[Title]) AND flour [Title], and (enrich*[Title]) AND flour [Title]. No review protocol was registered.
Inclusion criteria
Published controlled trials and before–after studies of males or females of all ages were eligible. Controlled trials with the following designs were eligible: clinical trials, double-blind randomized trials, double-blind controlled trials, double-blind randomized placebo-controlled trials, double-blind cluster randomized controlled trials, randomized controlled trials, randomized double-blind trials, randomized double-blind controlled trials, randomized placebo-controlled studies, and randomized double-blind placebo-controlled trials. Before–after studies with the following designs were eligible: comparisons of two surveys, longitudinal studies, pre-and-post intervention studies, prospective non-experimental studies, and prospective non-experimental cross-sectional studies. The intervention of each included study was dietary fortification of flour (e.g. wheat, maize, or rice), either in a raw form or in a cooking process, with iron or with iron and other micronutrients. Studies that used iron as a separate additive (e.g. micronutrient powders) were excluded. The outcome measures were haemoglobin level (g/l), serum ferritin level (µg/l), anaemia, iron deficiency (ID), and iron deficiency anaemia (IDA). These outcomes were adjusted for confounding variables in some of the publications (such as serum ferritin level for inflammation).
Data extraction and data collection
Data were extracted from the different studies and entered into a data worksheet. The data included: first author, year of publication, country, target group (children, infants/toddlers, women, all groups), study design (controlled trials, before-after studies), duration of intervention, fortification vehicle (type of flour used for fortification), intervention type (use of iron alone or iron with other micronutrients), type of iron compound(s), and outcomes.
Publications with multiple intervention arms (e.g. use of different iron compounds, enrolment of individuals from different geographic or demographic groups) were converted to multiple trials, so that each intervention arm was considered a trial. Only the relevant intervention arms (those using iron-fortified flour) were eligible for inclusion. If a publication had multiple intervention arms and a single control group, each intervention arm with that control group was considered to be a trail with a controlled trial design; if a publication did not have a control group, each intervention arm was considered to be a study with a before–after design. In addition, each intervention arm in all controlled trials was also included in the meta-analysis of other studies that had before–after designs. Thus, the meta-analysis of before–after studies also included all intervention arms of the controlled trials.
For trials with before–after design, the change of each outcome variable from before to after the intervention (mean difference and risk difference) was recorded. For controlled trials, the differences between the intervention and control groups in ‘change of each outcome variable from before to after the intervention’ were recorded. The standard error of each cluster trial was adjusted for cluster assignment. For publications that reported median haemoglobin and ferritin levels, these values were converted to means before analysis. Publications that reported the geometric mean haemoglobin and ferritin levels were analysed separately because these values could not be converted into arithmetic means( Reference Fu, Vandermeer and Shamliyan 9 ).
Assessment of quality and risk of bias
The criteria for evaluating the quality of publications were from the Cochrane Effective Practice and Organization of Care (EPOC) statement( 10 ). In particular, the quality of each publication was classified as having low risk (LR) of bias, high risk (HR) of bias, or unclear risk (?) of bias( 11 ). The risk of bias in each study was determined by its use of the following procedures: random sequence generation, allocation concealment, blinding, similar baseline outcome measurements, similar baseline characteristics, incomplete outcome reported, study protected against contamination, selective reporting, and other risks of bias. To determine the overall quality of each article, we examined the degrees of bias for the various sources of bias listed above and estimated their impact on the accuracy of the results of the study( Reference Higgins, Altman and Gøtzsche 12 ).
Statistical analysis
Meta-analysis was performed using Comprehensive Meta-Analysis (CMA) version-2 software. The results are presented as forest plots and effect sizes. Effect size, due to the high heterogeneity among trials, was determined using random effects models( Reference Rothman, Greenland and Lash 13 ) and a P-value less than 0·05 was considered statistically significant. The heterogeneity of trials was assessed using the Q-value and I 2 value. I 2 indicates the amount of variation (0 to 100 %) among trials that is attributable to study heterogeneity rather than chance. Analysis was also performed for the following subgroups: quality of trial (high risk or low risk of bias); target group (children, infants/toddlers, women, or all groups); intervention type (fortified with iron alone or iron with other micronutrients); and type of iron compound(s). Begg and Mazumdar’s rank correlation test and Egger’s linear regression were used to determine publication bias, and a P-value below 0·05 was considered significant evidence of the presence of publication bias.
Results
Study selection and study characteristics
We selected articles based on the Preferred Reporting Items for Systematic Reviews and Meta-Analyses (PRISMA) guidelines (Fig. 1). We initially identified 2641 articles, and identified 1235 after removal of duplicates. An additional 929 articles were deemed irrelevant after screening of the titles. We then screened 306 abstracts, and excluded an additional 219 articles. The remaining eighty-seven articles were eligible for full-text screening, thirty-one of which were excluded for various reasons (e.g. iron was not added to flour, study method was not relevant, complete data were not present). A total of fifty-six articles were included in the systematic review, and these were converted to 101 trials or intervention arms. The characteristics of the included trials in the systematic review are presented in Table 1. Seven trials were excluded either because it was impossible to convert some of the statistics to the required form or because they contained insufficient data for the meta-analysis. We ultimately included ninety-four trials (fifty-two articles) in the meta-analysis.
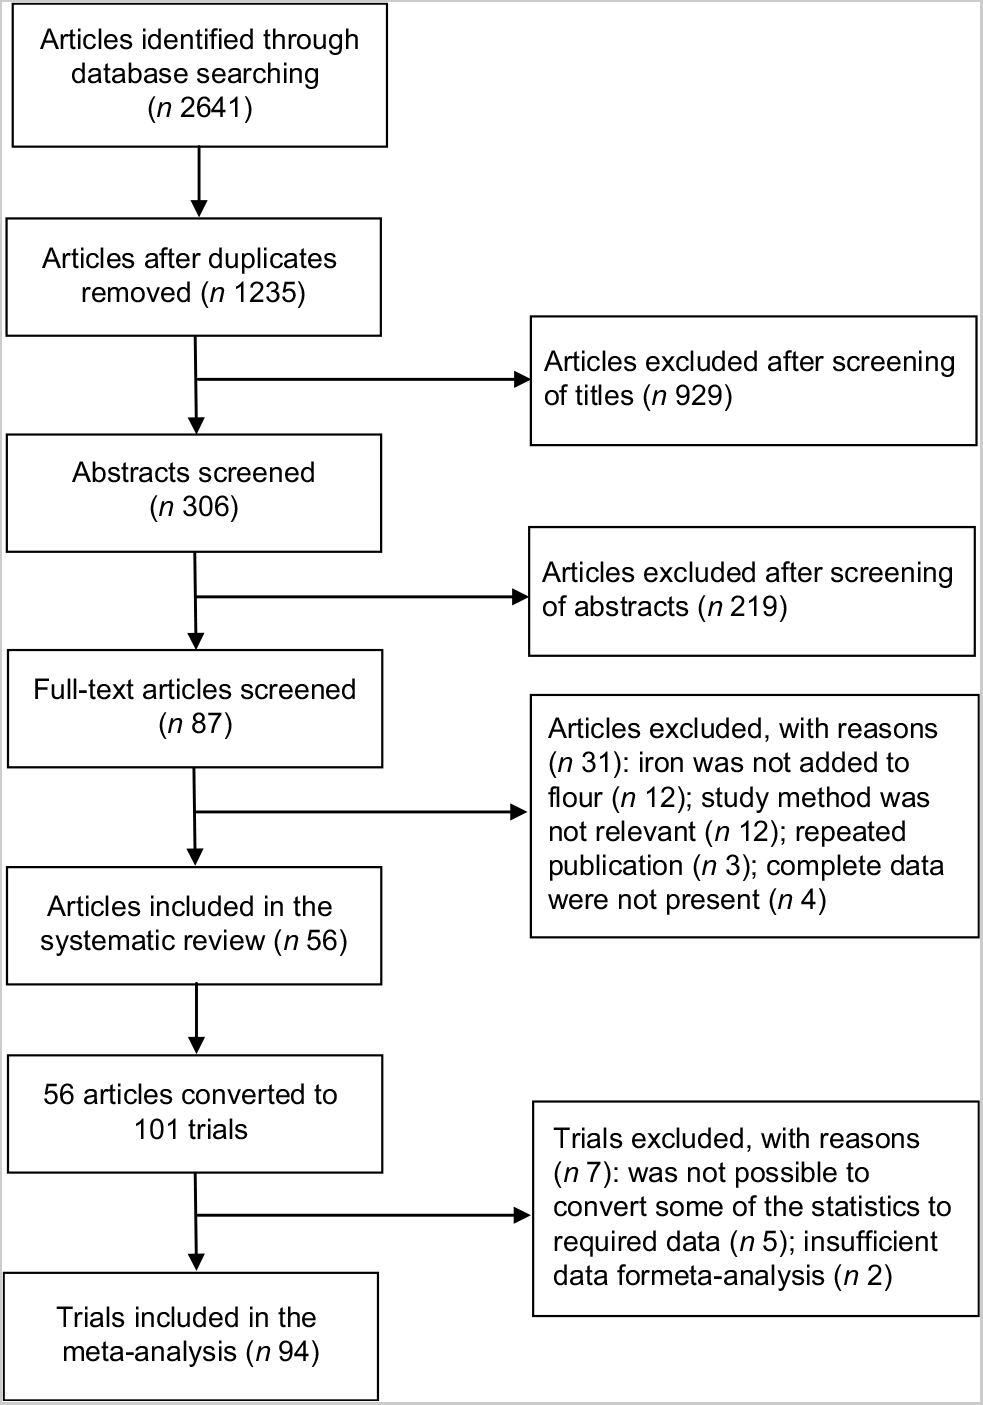
Fig. 1 Flow diagram of article selection process
Table 1 Characteristics of the trials included in the systematic review and meta-analysis
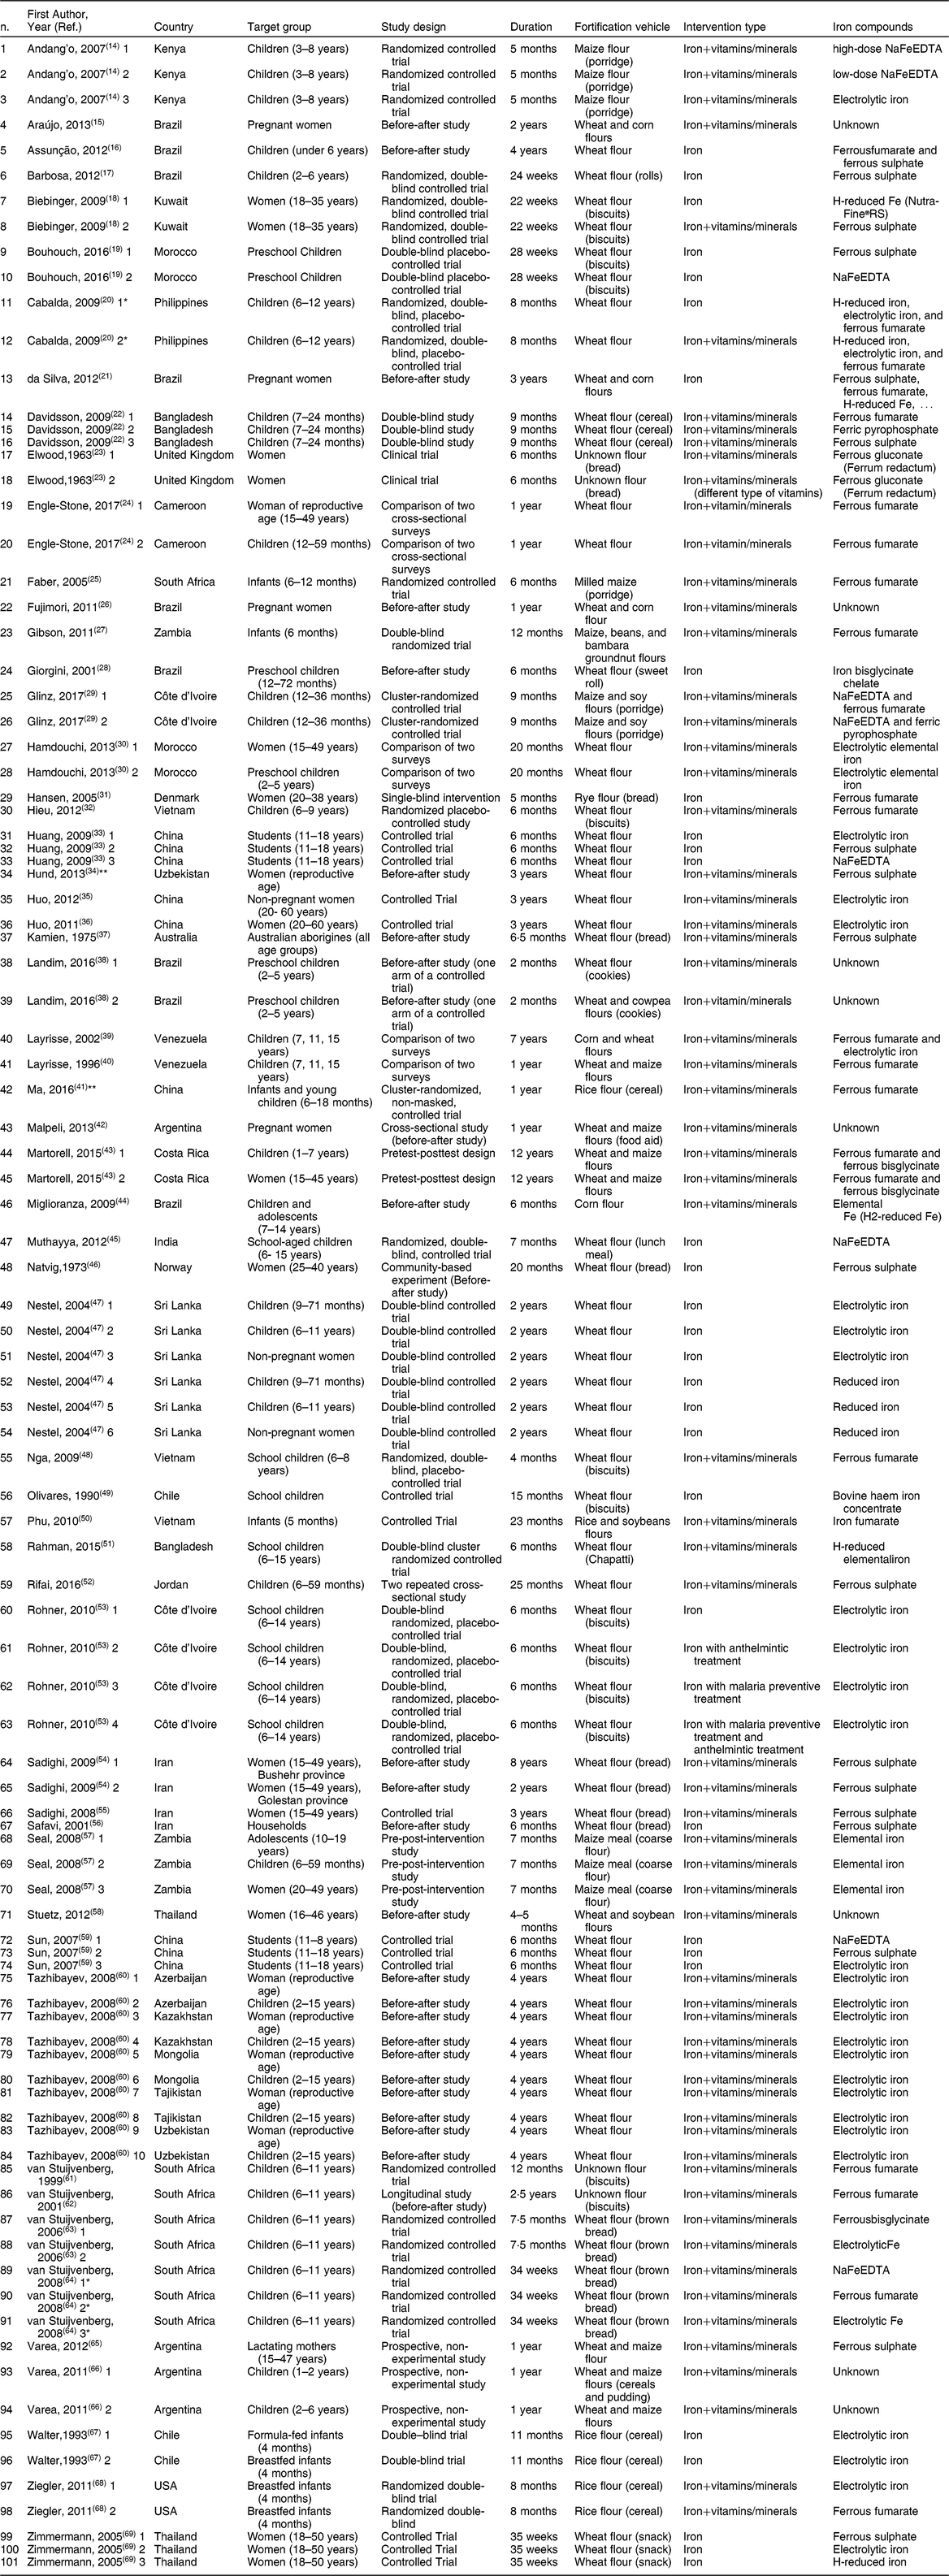
* This trial was excluded because some of the statistics could not be converted to appropriate values.
** This trial was excluded due to a lack of pre-intervention data.
The included studies were conducted in Argentina, Australia, Azerbaijan, Bangladesh, Brazil, Cameroon, Chile, China, Costa Rica, Côte d’Ivoire, Denmark, India, Iran, Jordan, Kazakhstan, Kenya, Kuwait, Mongolia, Morocco, Norway, South Africa, Sri Lanka, Tajikistan, Thailand, UK, USA, Uzbekistan, Venezuela, Vietnam, and Zambia. The study design was a controlled trial in forty-nine trials (52·1 %) and a before–after design in forty-five trials (47·9 %). There were nineteen trials (20·2 %) of infants/toddlers, forty-two (44·7 %) of children, thirty-one (33 %) of women, and two (2·1 %) of people of all ages. The mean duration of intervention was 20·6 months (sd: 25·5, range: 2–144). Fortification vehicles were wheat flour in sixty-one trials (64·8 %), maize flour in seven trials (7·4 %), wheat and maize flours in seven trials (7·4 %), rice flour in four trials (4·3 %), wheat and corn flours in four trials (4·3 %), maize and soy flours in two trials (2·1 %), corn flour in one trial (1·.1 %), maize, beans, bambara nuts, and groundnuts flours in one trial (1·1 %), rice and soybeans flours in one trial (1·1 %), rye flour in one trial (1·1 %), wheat and soybean flours in one trial (1·1 %), and unknown flour in four trials (4·3 %). Iron alone was added to flour in thirty-one trials (33 %) and iron with other micronutrients was added in sixty-three trials (67 %). In regard to the quality criteria, sixty-four trials (68 %) had an overall low risk of bias, and thirty trials (32 %) had an overall high risk of bias.
Assessment of quality and risk of bias
Table 2 shows the different possible sources of bias in which each criterion is rated as LR, HR, or unclear risk (?).
Table 2 Risk of bias and quality assessment for articles included in the meta-analysis
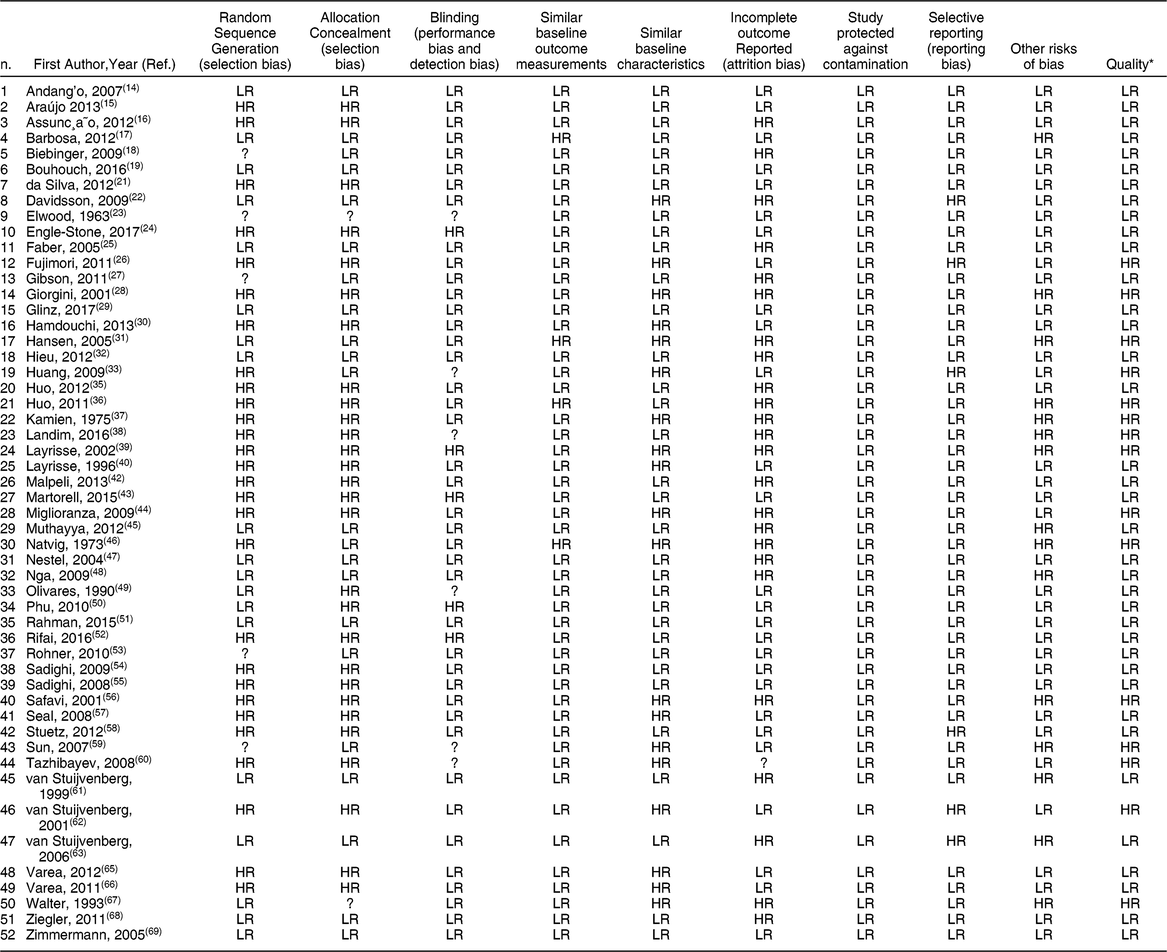
* Each article was classified as having low risk (LR) of bias, high risk (HR) of bias, or unclear risk (?) of bias.
Meta-analysis
1. Effect of iron-fortified flour on mean haemoglobin level: before–after studies
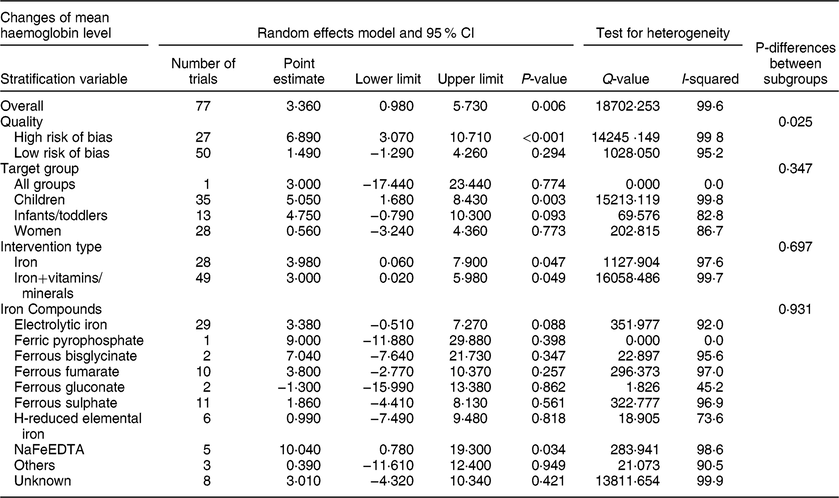
Seventy-seven trials with before–after design reported mean haemoglobin levels. These trials had 19 083 subjects after the interventions (although sample size was not reported in two trials). Begg’s funnel plot was asymmetrical, suggesting publication bias (P < 0·001), consistent with the results of Egger’s linear regression test (P = 0·001). There was also significant heterogeneity among these trials (I 2 = 99·9 %, P < 0·001). The results of the random-effects model show that flour fortification significantly increased mean haemoglobin level. The overall effect size was 3·360 g/l (95 % CI: 0·980, 5·730; P = 0·006) (Table 3, Figure S1). Subgroup analysis indicated there was a significant difference in the results of trials with high and low risk of bias (P = 0·025), in that fortification significantly increased the mean haemoglobin in high-risk trials. The target group (P = 0·347), intervention type (P = 0·697), and type of iron compounds (P = 0·931) had no effects on the results (Table 3).
Table 3 Meta-analysis of the effect of iron-fortified flour on the mean haemoglobin (g/l) in before-after studies
2. Effect of iron-fortified flour on geometric mean haemoglobin level: before–after studies (data not shown)
Seven trials with before–after design reported geometric mean haemoglobin levels and there were 1840 subjects after the interventions. Begg’s funnel plot was symmetrical, suggesting no evidence of publication bias (P = 0·293), consistent with the results of Egger’s linear regression test (P = 0·140). The results of the random effects model showed that flour fortification significantly increased the geometric mean haemoglobin level. The overall effect size was 3·700 g/l (95 % CI: 1·430, 5·890; P = 0·001). There was significant heterogeneity among the trials (I 2 = 89·1 %, P < 0·001). Subgroup analysis showed that trial quality (P = 1·0), target group (P = 0·122), intervention type (P = 0·708), and type of iron compounds (P = 0·794) had no effects on the results.
3. Effect of iron-fortified flour on mean ferritin level: before-after studies
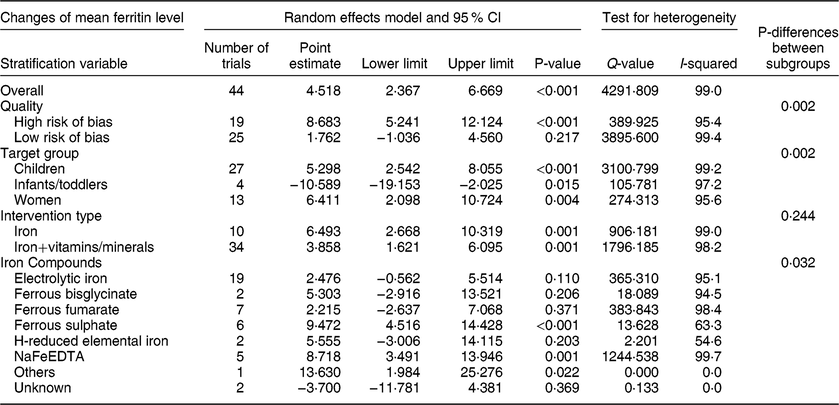
Forty-four trials with before–after design reported mean serum ferritin level and there were 6790 subjects after interventions. Begg’s funnel plot was symmetrical, suggesting no publication bias (P = 0·124), consistent with the results of Egger’s linear regression test (P = 0·452). There was significant heterogeneity among the trials (I 2 = 99 %, P < 0·001). The results of the random effects model showed that flour fortification significantly increased serum ferritin level. The overall effect size was 4·518 µg/l (95 % CI: 2·367, 6·669; P < 0·001) (Table 4, Figure S2). Subgroup analysis indicated there were no differences between types of interventions (P = 0·244). However, there were significant differences in the results of studies with high risk and low risk of bias (P = 0·002), for different target groups (P = 0·002), and for different types of iron compounds (P = 0·032). In particular, fortification significantly increased the mean ferritin level in trials with high risk of bias, in all target groups, and in trials that used ferrous sulphate or NaFeEDTA (Table 4).
Table 4 Meta-analysis of the effect of iron-fortified flour on the mean serum ferritin (µg/l) in before-after studies
4. Effect of iron-fortified flour on geometric mean ferritin level: before–after studies (data not shown)
Eighteen trials with before–after design reported geometric mean serum ferritin levels and there were 2142 subjects after interventions. Begg’s funnel plot was symmetrical, suggesting no publication bias (P = 0·129), in agreement with Egger’s linear regression test (P = 0·906). The results of the random effects model showed that flour fortification significantly increased the geometric mean serum ferritin level. The overall effect size was 5·148 µg/l (95 % CI: 0·555, 9·740; P = 0·028). There was significant heterogeneity among the trials (I 2 = 93·2 %, P < 0·001). Subgroup analysis showed that trial quality (P = 0·134), intervention type (P = 0·363), and type of iron compounds (P = 0·761) had no effect on the results. However, there was a significant difference between target groups (P = 0·037), in that flour fortification with iron significantly increased the geometric mean ferritin level in children.
5. Effect of iron-fortified flour on the prevalence of anaemia: before–after studies
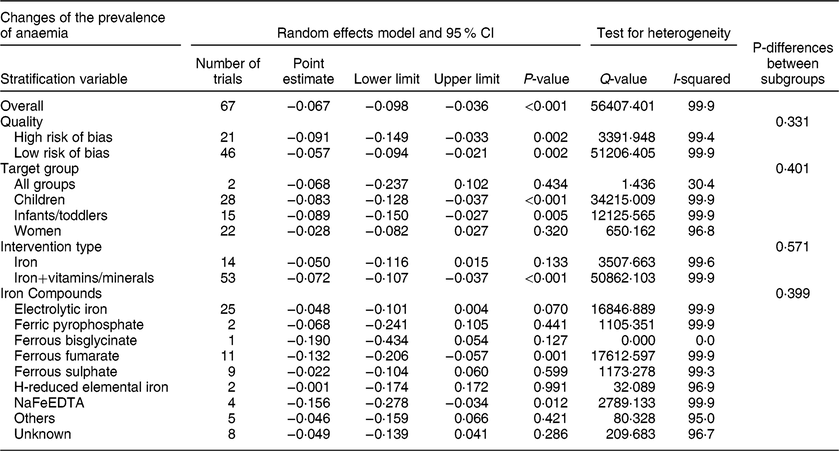
Sixty-seven trials with before–after design reported data on anaemia and there were 23 267 subjects after interventions. Begg’s funnel plot was asymmetrical, suggesting the presence of publication bias (P = 0·014), but this result was not confirmed by Egger’s linear regression test (P = 0·079). There was significant heterogeneity among the trials (I 2 = 99·9 %, P < 0·001). The results of the random effects model showed that flour fortification significantly reduced the prevalence of anaemia. The overall effect size was −0·067 (−6·7 %) (95 % CI: −0·098, −0·036; P < 0·001) (Table 5, Figure S3). Subgroup analysis showed that trial quality (P = 0·331), target group (P = 0·401), intervention type (P = 0·571), and type of iron compounds (P = 0·399) had no significant effects on the results (Table 5).
Table 5 Meta-analysis of the effect of iron-fortified flour on the prevalence of anaemia in before-after studies
6. Effect of iron-fortified flour on the prevalence of ID: before–after studies
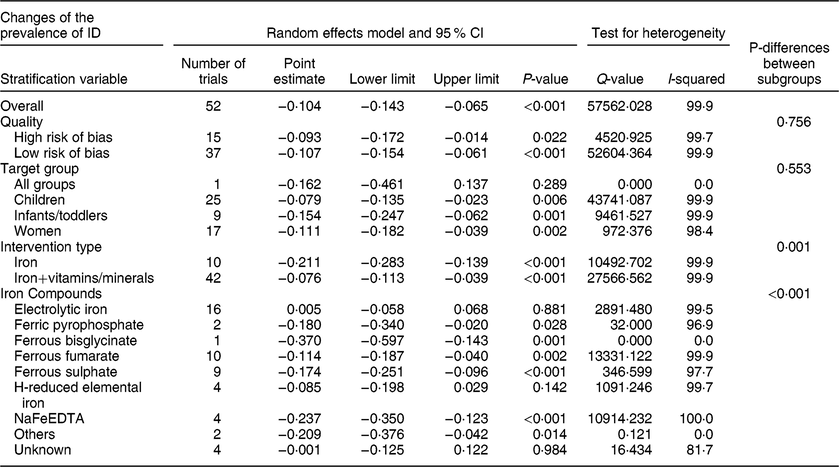
Fifty-two trials with before–after design reported data on ID and there were 7683 subjects after interventions. Begg’s funnel plot was symmetrical, suggesting no publication bias (P = 0·180), and this was confirmed by Egger’s linear regression test (P = 0·211). There was significant heterogeneity among the trials (I 2 = 99·9 %, P < 0·001). The results of the random effects model showed that flour fortification significantly reduced the prevalence of ID. The overall effect size was −0·104 (−10·4 %) (95 % CI: −0·143, −0·065; P < 0·001) (Table 6, Figure S4). Subgroup analysis indicated that trial quality (P = 0·756) and target group (P = 0·553) had no significant effects on the results. However, there was a significant difference between intervention types (P = 0·001), in that flour fortification in trials that added iron to flour, as well as in trials that used iron in combination with other micronutrients, significantly reduced ID prevalence. There was also a significant difference between types of iron compounds (P < 0·001), in that all types of iron compounds except electrolytic iron or H-reduced elemental iron led to significantly reduced prevalence of ID (Table 6).
Table 6 Meta-analysis of the effect of iron-fortified flour on the prevalence of ID in before-after studies
7. Effect of iron-fortified flour on the prevalence of IDA: before–after studies
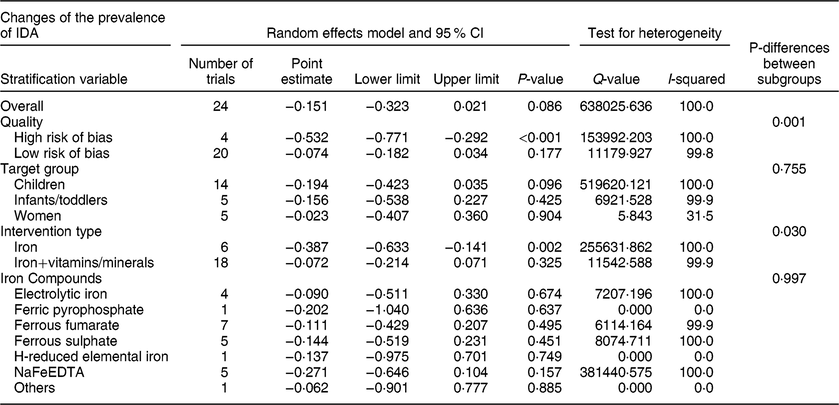
Twenty-four trials with before–after design reported data on IDA and there were 4909 subjects after interventions. Begg’s funnel plot was asymmetrical, indicating publication bias (P < 0·001), but Egger’s linear regression test (P = 0·317) did not confirm this result. There was significant heterogeneity among the trials (I 2 = 100 %, P < 0·001). The results of the random effects model showed that flour fortification had no effect on the prevalence of IDA. The overall effect size was −0·151 (−15·1 %) (95 % CI: −0·323, 0·021; P = 0·086) (Table 7, Figure S5). Subgroup analysis indicated that target group (P = 0·755) and type of iron compounds (P = 0·997) had no significant effect on the results. However, there were significant differences between quality of trials (P = 0·001) and between intervention types (P = 0·03); in particular, flour fortification significantly reduced the prevalence of IDA in high-risk trials and in trials that only added iron to flour (Table 7).
Table 7 Meta-analysis of the effect of iron-fortified flour on the prevalence of IDA in before-after studies
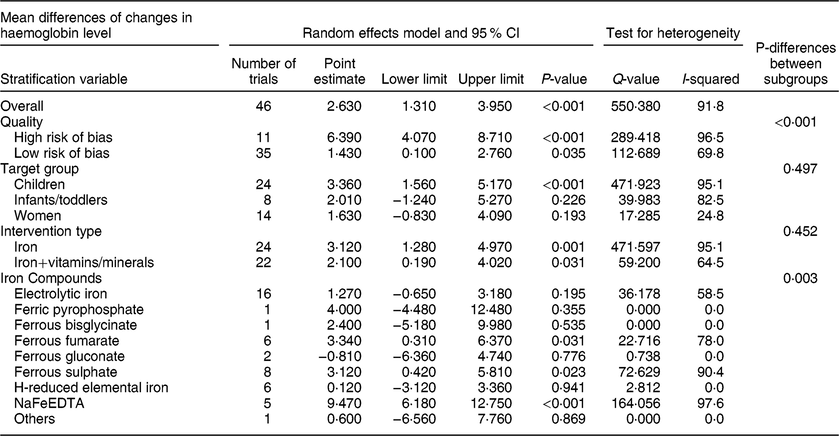
8. Effect of iron-fortified flour on mean haemoglobin level: controlled trials
Forty-six controlled trials reported haemoglobin levels. After interventions, there were 5290 subjects in the intervention groups and 5063 in the control groups. Sample size was not reported in two trials. Begg’s funnel plot was symmetrical, indicating no publication bias (P = 0·272), and Egger’s linear regression test (P = 0·336) confirmed this result. There was significant heterogeneity among the trials (I 2 = 91·8 %, P < 0·001). The results of the random effects model showed that fortification significantly increased haemoglobin level. The overall effect size was 2·630 g/l (95 % CI: 1·310, 3·950; P < 0·001) (Table 8, Figure S6). Subgroup analysis indicated that target group (P = 0·497) and type of intervention (P = 0·452) had no significant effect on the results. However, there were significant differences between quality of trials (P < 0·001) and between types of iron compounds (P = 0·003). In particular, flour fortification significantly increased mean haemoglobin level in trials that had high risk of bias, and in trials that used ferrous fumarate or ferrous sulphate, or NaFeEDTA (Table 8).
Table 8 Meta-analysis of the effect of iron-fortified flour on the mean haemoglobin (g/l) in controlled trials
9. Effect of iron-fortified flour on geometric mean haemoglobin level: controlled trials (data not shown)
Two controlled trials reported data on geometric mean haemoglobin levels. There were 204 subjects in the intervention and control groups after interventions. We could not estimate publication bias because this calculation requires at least three trials. There was no significant heterogeneity among the trials (I 2 = 0 %, P = 0·365). The results of the random effects model showed that fortification significantly increased the geometric mean haemoglobin level. The overall effect size was 5·000 g/l (95 % CI: 2·840, 7·160; P < 0·001). Subgroup analysis showed that trial quality (P = 1·0), target group (P = 1·0), intervention type (P = 1·0), and type of iron compounds (P = 0·985) had no effects on the results.
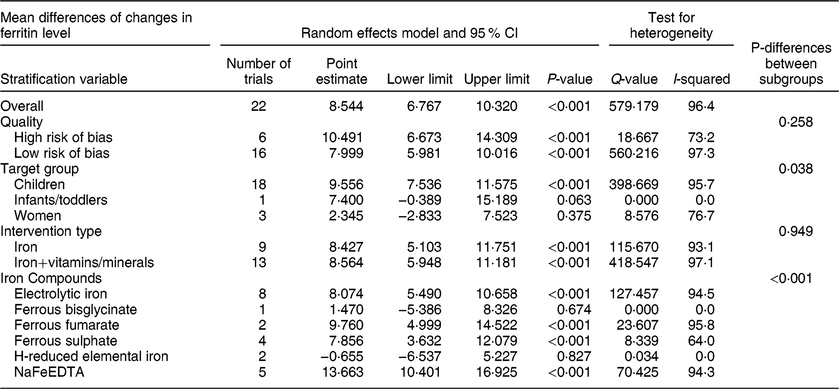
10. Effect of iron-fortified flour on mean ferritin level: controlled trials
Twenty-two controlled trials reported serum ferritin levels. After interventions, there were 2688 subjects in the intervention groups and 2423 in the control groups. Begg’s funnel plot was symmetrical, suggesting no publication bias (P = 0·553) and the results of Egger’s linear regression test (P = 0·419) was confirmatory. There was significant heterogeneity among the trials (I 2 = 96·4 %, P < 0·001). The results of the random effects model showed that flour fortification significantly increased serum ferritin level. The overall effect size was 8·544 µg/l (95 % CI: 6·767, 10·320; P < 0·001) (Table 9, Figure S7). Subgroup analysis indicated that trial quality (P = 0·258) and type of intervention (P = 0·949) had no significant effects on the results. However, there were significant differences between target groups (P = 0·038) and between the type of iron compounds (P < 0·001). In particular, flour fortification significantly increased the mean ferritin level in children, and in trials which used the electrolytic iron or ferrous fumarate or ferrous sulphate, or NaFeEDTA (Table 9).
Table 9 Meta-analysis of the effect of iron-fortified flour on the mean serum ferritin (µg/l) in controlled trials
11. Effect of iron-fortified flour on geometric mean ferritin level: controlled trials (data not shown)
Fourteen controlled trials reported geometric means of serum ferritin level. After the interventions, there were 1147 subjects in the intervention groups and 1115 in the control groups. Begg’s funnel plot was symmetrical, suggesting no publication bias (P = 0·443) and Egger’s linear regression test (P = 0·199) confirmed this result. There was significant heterogeneity among the trials (I 2 = 54·7 %, P = 0·007). The results of the random effects model showed that fortification significantly increased the geometric mean serum ferritin level. The overall effect size was 9·091 µg/l (95 % CI: 5·291, 12·891; P < 0·001). Subgroup analysis showed that intervention type (P = 0·884) and type of iron compounds (P = 0·837) had no effects on the results, but there were significant differences between the quality of trials (P < 0·001) and between the target groups (P < 0·001). Flour fortification significantly increased the geometric mean ferritin level in trials with low risk of bias, and in children and infants/toddlers.
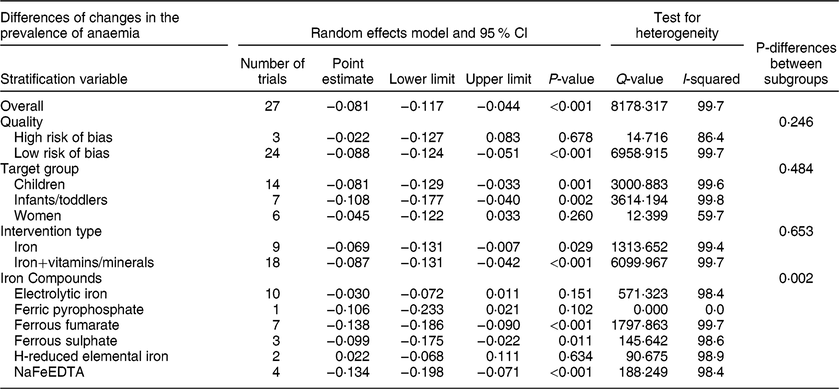
12. Effect of iron-fortified flour on the prevalence of anaemia: controlled trials
Twenty-seven controlled trials reported data on the prevalence of anaemia. After interventions, there were 3636 subjects in the intervention groups and 3314 in the control groups. Begg’s funnel plot was symmetrical, suggesting no publication bias (P = 0·416), but Egger’s linear regression test indicated there was publication bias (P = 0·010). There was significant heterogeneity among the trials (I 2 = 99·7 %, P < 0·001). The results of the random effects model showed that flour fortification significantly reduced the prevalence of anaemia. The overall effect size was −0·081 (−8·1 %) (95 % CI: −0·117, −0·044; P < 0·001) (Table 10, Figure S8). Subgroup analysis indicated that trial quality (P = 0·246), target group (P = 0·484), and type of intervention (P = 0·653) had no significant effects on the results. There was significant differences between the type of iron compounds (P = 0·002), and flour fortification significantly reduced the prevalence of anaemia in trials that used ferrous fumarate or ferrous sulphate, or NaFeEDTA (Table 10).
Table 10 Meta-analysis of the effect of iron-fortified flour on the prevalence of anaemia in controlled trials
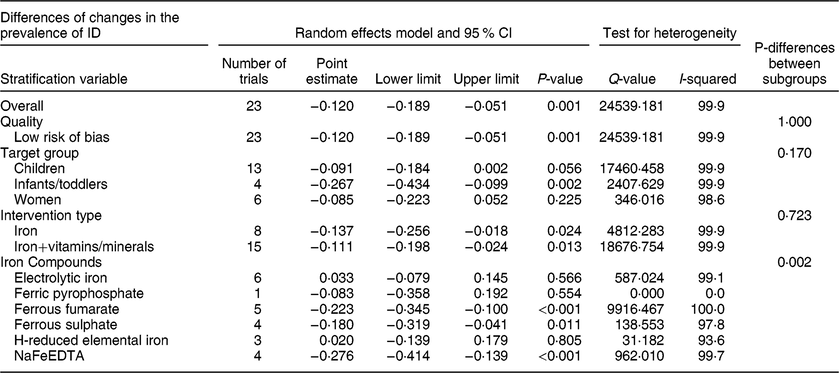
13. Effect of iron-fortified flour on the prevalence of ID: controlled trials
Twenty-three controlled trials reported data on the prevalence of ID. After interventions, there were 2838 subjects in the intervention groups and 2533 in the control groups. Begg’s funnel plot was symmetrical, suggesting no publication bias (P = 0·526), in agreement with the results of Egger’s linear regression test (P = 0·219). There was significant heterogeneity among the trials (I 2 = 99·9 %, P < 0·001). The results of the random effects model showed that fortification significantly reduced the prevalence of ID. The overall effect size was −0·120 (−12 %) (95 % CI: −0·189, −0·051; P = 0·001) (Table 11, Figure S9). Subgroup analysis indicated that trial quality (P = 1·0), target group (P = 0·170), and type of intervention (P = 0·723) had no significant effects on the results. There was a significant difference between types of iron compounds (P = 0·002), and flour fortification significantly reduced the prevalence of ID when ferrous fumarate or ferrous sulphate, or NaFeEDTA was used (Table 11).
Table 11 Meta-analysis of the effect of iron-fortified flour on the prevalence of ID in controlled trials
14. Effect of iron-fortified flour on the prevalence of IDA: controlled trials
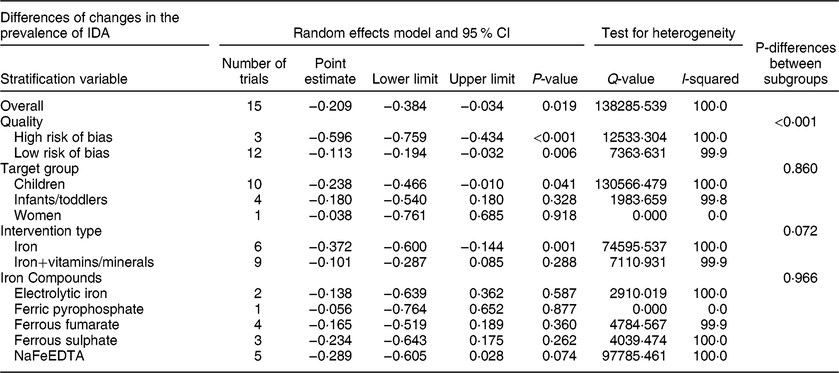
Fifteen controlled trials reported data on the prevalence of IDA. After interventions, there were 2242 subjects in the intervention groups and 2018 in the control groups. Begg’s funnel plot was symmetrical, suggesting no publication bias (P = 0·138), in agreement with the results of Egger’s linear regression test (P = 0·290). There was significant heterogeneity among the trials (I 2 = 100 %, P < 0·001). The results of the random effects model showed that fortification significantly reduced the prevalence of IDA. The overall effect size was −0·209 (−20·9 %) (95 % CI: −0·384, −0·034, P = 0·019) (Table 12, Figure S10). Subgroup analysis indicated that target group (P = 0·860), type of intervention (P = 0·072), and type of iron compounds (P = 0·966) had no significant effect on the results. However, flour fortification significantly reduced the prevalence of IDA in both low-risk and high-risk trials (P < 0·001) (Table 12).
Table 12 Meta-analysis of the effect of iron-fortified flour on the prevalence of IDA in controlled trials
Discussion
Food fortification is a common public health strategy used to reduce iron deficiency. As of 2013, food fortification was mandatory in 133 countries, and the five most commonly fortified foods were salt (43·8 %), wheat flour (32·3 %), cooking oil (14·6 %), maize flour (6·3 %), and rice (3·1 %)( 70 ). As of 2018, eight-six countries had legislation that mandated cereal grain fortification; sixty-six countries fortify wheat flour alone, fourteen countries fortify wheat flour and maize flour, three countries fortify wheat flour and rice, one country fortifies rice alone, and two countries fortify wheat flour, maize flour, and rice( 71 ). The success of the food fortification programmes depends on the presence of appropriate legislation and regulations, adequate intake of fortified foods, bioavailability of micronutrients, and programme monitoring and evaluation.
The present meta-analysis evaluated the effectiveness of iron-fortified flour on iron status, with stratification by study design (controlled trials and before-after studies). The results suggest that publications with a controlled trial design had higher quality (lower risk of bias) than the before–after studies. The results also showed that iron-fortified flour increased the haemoglobin levels and serum ferritin levels, and reduced the risk of anaemia, ID, and IDA (IDA only in controlled trials). These findings seem to be consistent with other studies which found that food fortification improved iron status. For example, a review reported that fortified foods had positive effects on haemoglobin and serum ferritin levels, and reduced the risk of anaemia and ID( Reference Gera, Sachdev and Boy 72 ). Another study in 2015 showed that a wheat flour fortification programme was successful in improving iron status and reducing anaemia( Reference Martorell, Ascencio and Tacsan 43 ). Food fortification with several micronutrients, including vitamin A, iron, and other micronutrients, improved the haemoglobin levels of children and improved the ferritin and haemoglobin levels of reproductive-age women and pregnant women( Reference Das, Salam and Kumar 73 ). Consumption of fortified foods also improved the haemoglobin levels of children younger than two years-old( Reference Athe, Rao and Nair 74 ). Another study showed that each year of consuming iron fortified foods was associated with a 2·4 % reduction in the odds of anaemia prevalence( Reference Barkley, Wheeler and Pachón 75 ). However, a systematic review concluded there was limited evidence for the effectiveness of flour fortification programmes in reducing the prevalence of anaemia, although these programmes are more effective in reducing the prevalence of ID( Reference Pachón, Spohrer and Mei 76 ).
The results of our subgroup analysis indicated that high-risk trials in before–after studies and low-risk trials in controlled trials, and trials that used NaFeEDTA resulted in greater responses. However, use of iron with other micronutrients rather than iron alone had no impact on the results.
Fortification programmes that use iron compounds with low bioavailability or only small amounts of iron are often ineffective( 77 ). Our results indicated that use of NaFeEDTA (which has high bioavailability) was the most important factor assuring effective iron fortification. Thus, we suggest that future food fortification programmes should focus on using bioavailable forms of iron compounds, such as NaFeEDTA. Although NaFeEDTA is more expensive than other forms of iron, its addition to foods enhances the absorption of other iron fortifying compounds, such as sulphate or fumarate( Reference Hurrell 78 ).
Our study found that iron-fortified flour reduced the prevalence of IDA, but this finding should be interpreted with caution because it was highly dependent on study design. In particular, iron-fortified flour only reduced the prevalence of IDA in controlled trials, not in before-after studies. The global prevalence of anaemia has decreased from 40·2 % in 1990 to 32·9 % in 2010, and IDA is one of the major causes of anaemia, in addition to hookworm, sickle cell disorder, thalassemia, schistosomiasis, and malaria( Reference Kassebaum, Jasrasaria and Naghavi 79 ). Thus, iron fortification of foods is only one of the public health strategies needed to control anaemia( 80 ).
The strengths of this meta-analysis are that we performed stratification by study design, we included trials that fortified all types of flours, examined all age groups, and examined both genders, and we examined large numbers of subjects. Our meta-analysis of before-after studies examined haemoglobin levels in 19 083 subjects, ferritin levels in 6790 subjects, anaemia in 23 267 subjects, ID in 7683 subjects, and IDA in 4909 subjects. There were fewer subjects in the controlled trials presumably because these studies are more labour-intensive. There were also several limitations of this meta-analysis. In particular, there was high heterogeneity among most studies, so the results of the random effects models should be interpreted with caution. We found evidence of publication bias among trials with before–after design that investigated the effect of flour fortification on haemoglobin level; however, this bias was unlikely to alter the magnitude of the effect because analysis of measurements of the mean differences in the change of haemoglobin levels indicated no evidence of publication bias. Some of our subgroup analyses only included a small number of trials, so these results should be interpreted with caution. We determined the quality of each trial based entirely on information presented in the published articles; some of these studies might have been rated as having lower bias if we received additional information from the authors. The effect of iron-fortified flour on the geometric mean haemoglobin levels and on the geometric mean serum ferritin levels should also be interpreted with caution because of the small sample sizes. Only a few of the trials that examined serum ferritin concentrations performed statistical adjustment for inflammation. Finally, we used definitions of anaemia, ID, and IDA provided in each publication, and these may have differed among studies.
In general, our findings support the view that iron-fortified flour effectively improves iron status. It should be noted, however, that the magnitudes of some of the differences that were statistically significant were quite small (e.g. significant increases of mean haemoglobin level: (3·360 g/l); hence, health policy-makers must consider whether the small magnitude of this effect is relevant to public health.
Conclusion
This meta-analysis provides evidence that iron-fortified flour increases levels of haemoglobin and ferritin, and reduces the prevalences of anaemia, ID, and IDA (IDA only in controlled trials). There were stronger effects in high-risk trials in the before–after studies, and stronger effects in low-risk trials in controlled trials. Thus, our analysis of controlled trials provided strong evidence supporting the effectiveness of iron-fortified flour. It should be noted that the type of iron compounds used for flour fortification had a strong impact on effectiveness, in that NaFeEDTA led to the greatest response. Thus, this meta-analysis found that flour fortification with iron is a useful public health strategy that can improve the iron status of populations. However, further studies are needed to examine the beneficial effect of iron-fortified flour on the prevalence of IDA.
Acknowledgements
Financial support: This research was supported by the Academic Center for Education, Culture and Research (ACECR). Conflict of interest: None. Authorship: J.S. developed the review idea, applied the search strategy, analysing the data and writing the paper; S.N. prepared the protocol, analysing the data and writing the paper; R.R. applied the search strategy and extracted data from the included studies. Ethics of human subject participation: Not applicable.
Supplementary material
To view supplementary material for this article, please visit https://doi.org/10.1017/S1368980019002179.


