Recent research in adolescents and young adults has indicated that subthreshold phenotypes consisting of (hypo)manic symptoms are a common phenomenon in the general population. Reference Tijssen, van Os, Wittchen, Lieb, Beesdo and Mengelers1 Although it has been established that these common developmental expressions of (hypo)manic symptoms are associated with an increased risk for adult-onset bipolar disorder, Reference Egeland, Hostetter, Pauls and Sussex2 much less is known about which characteristics determine the poor outcome of bipolar disorder in only a small minority Reference Lewinsohn, Klein and Seeley3 of all those with (hypo)manic symptoms. One of the missing pieces of information regarding the prediction–onset cycle in bipolar disorder is that because of the lack of prospective longitudinal data, little is known about the dynamics of the course of subthreshold phenotypes in relation to later onset of the disorder. In the current paper, the hypothesis was tested that differential course of (hypo)manic symptoms in adolescence would be associated with differential risk for transition to full-blown bipolar disorder, greater levels of persistence over time predicting greater likelihood of transition to a diagnosable disorder. Second, as bipolar disorder is often preceded by depressive symptoms, it was hypothesised that the course and level of persistence of depressive symptoms would be equally relevant in predicting transition. Reference Angst, Sellaro, Stassen and Gamma4 Both hypotheses were tested in a large representative cohort of adolescents followed over a period of up to 10 years. Given previous evidence of the effect of number of symptoms (symptom loading) on risk of transition, Reference Regeer, Krabbendam, De Graaf, Ten Have, Nolen and van Os5 the effect of persistence of (hypo)manic and depressive symptoms was analysed in relation to symptom loading as well.
Method
Sample
This study is part of the Early Developmental Stages of Psychopathology (EDSP) study, a prospective longitudinal cohort community study. Detailed information about the design, sample, instruments, procedures and statistical methods of the EDSP is presented elsewhere. Reference Lieb, Isensee, von Sydow and Wittchen6,Reference Wittchen, Perkonigg, Lachner and Nelson7 Data were collected in a random representative population sample of adolescents and young adults living in the Munich area (Germany), aged 14–24 years at baseline. The study sample was randomly drawn from the 1994 government population registers and comprised residents in Munich and its surrounding area.
Study design
The study consists of a baseline survey (T 0, n = 3021) and three follow-up investigations (T 1, T 2, T 3), covering a time period of approximately 1.6 years (T 0–T 1, s.d. = 0.2), 3.4 years (T 0–T 2, s.d. = 0.3) and 8.3 years (T 0–T 3, range 7.4–10.6 years, s.d. = 0.7) respectively. Since the older cohort of adolescents, aged 18–24 years at baseline, was not interviewed at T 1, the current results are based on the time periods T 0–T 2 and T 2–T 3. Response rates were 84% at T 2 (n = 2548) and 73% at T 3 (n = 2210). For the younger cohort (n = 1228), the time periods T 0–T 1 and T 1–T 2 were aggregated to represent the interval T 0–T 2. For the current report, the risk set was defined as the set of individuals at risk of developing, for the first time, the clinical outcome at T 3. The risk set consisted of all individuals who: had post-baseline DIA–X/M–CIDI Reference Wittchen and Pfister8 interviews with complete data at both T 2 and T 3 (n = 2029); and had never been diagnosed before T 3 with the clinical outcome as defined below (DSM (hypo)manic episodes and/or mental healthcare use respectively). Thus, for the analyses of transition to T 3 DSM (hypo)manic episodes, all participants with a (hypo)manic episode at T 0 and/or at T 2 were excluded (n = 127), yielding a risk set of 1902 (i.e. 2029–127); for the analyses pertaining to the T 3 outcome of mental healthcare use, all participants with mental healthcare use at T 0 and/or T 2 were excluded (n = 381), yielding a risk set of 1648 (i.e. 2029–381). After exclusion of both DSM (hypo)manic episodes prior to T 3 and mental healthcare use prior to T 3, a risk set of 1565 (i.e. 2029–464) participants remained.
Instruments
Interviews were conducted using the Computer-Assisted Personal Interview (CAPI) version of the Munich–Composite International Diagnostic Interview (DIA–X/M–CIDI), Reference Wittchen and Pfister8 an updated version of the World Health Organization's CIDI version 1.2. 9 Since the assessment of severe mental disorders with CIDI interviews by lay interviewers may not be entirely reliable, Reference Anthony, Folstein, Romanoski, Von Korff, Nestadt and Chahal10 fully trained and experienced psychologists who were allowed to probe with follow-up questions conducted the interviews. At baseline, the lifetime version of the DIA–X/M–CIDI was used; for the follow-up interviews, the DIA–X/M–CIDI interval version was used, covering the respective time periods between interviews.
Assessment of affective-symptom groups
Affective symptoms were assessed at T 0 and T 2 using the 28 symptom items (DSM–IV 11 and ICD–10) 12 of the DIA–X/M–CIDI depression and dysthymia section (items regarding feeling depressed, loss of interest, loss of energy, hopelessness, decreased concentration, loss of appetite, weight loss, sleep disturbances, feelings of worthlessness or guilt, decreased self-esteem and suicidal ideation) and the 11 symptom items of the DIA–X/M–CIDI mania section (items regarding increase in goal-directed activity, psychomotor agitation, spending sprees, sexual indiscretions, increased talkativeness, flight of ideas, increased self-esteem or grandiosity, decreased need for sleep and distractibility). Symptom items were rated either yes or no. Depressive symptoms were only rated if present for at least 2 weeks; (hypo)manic symptoms if present for at least 4 successive days. If the symptom was the direct result of alcohol or drug use or somatic conditions, the item was not counted towards the diagnosis of a primary mood disorder. Furthermore, symptoms were only assessed and rated if at least one of the DIA–X/M–CIDI core depressive or core (hypo)manic symptoms was present. Only participants having core (hypo)manic symptoms that were either noticed by others or because of which participants experienced problems were included.
Two sum scores of symptom ratings were formed: a sum score of depressive symptoms with a minimum of 0 and a maximum score of 28 endorsements; and a sum score of (hypo)manic symptoms with a minimum of 0 and a maximum score of 11 endorsements. Subsequently, in both symptom groups, progressively stricter and overlapping subcategories of these sum scores, indicating the degree of symptom loading, were created Reference Regeer, Krabbendam, De Graaf, Ten Have, Nolen and van Os5,Reference Krabbendam, Myin-Germeys, de Graaf, Vollebergh, Nolen and Iedema13 (0: no symptoms; 1: at least two symptoms; 2: at least four symptoms; 3: at least six symptoms).
Because of the known co-occurrence of (hypo)manic symptoms and depressive symptoms in bipolar disorder, Reference Regeer, Krabbendam, De Graaf, Ten Have, Nolen and van Os14 a third symptom group of ‘bipolar symptom sum score’ with corresponding subcategories of symptom loading was formed. In this group, both the depressive symptom sum score as well as the (hypo)manic symptom sum score were taken into account by adding both scores together, but only if the participant suffered from at least one (hypo)manic symptom at any time point. Thus, a minimum of 0 and a maximum of 39 (i.e. 28 + 11) endorsements was theoretically possible. Subcategories of symptom loading of the bipolar symptom sum score were similar to the (hypo)manic and depressive symptom sum score.
Assessment of persistence
For each of the symptom groups, a persistence variable was created. ‘Persistence’ was defined as the number of times at the T 0 and T 2 interviews that participants scored positive on having depressive and/or manic symptoms, irrespective of which particular depressive and/or manic symptoms were present. The persistence variable thus had three levels: level 0, no symptoms at T 0 and T 2; level 1, occurrence of symptoms only once at T 0 or T 2; and level 2, occurrence of symptoms twice, both at T 0 and T 2.
Assessment of clinical outcome
In order to predict transition to clinical disorder, two clinical outcomes were used in the analyses. The first was defined as suffering from either a DSM–IV manic or a DSM–IV hypomanic episode (hereafter: DSM (hypo)manic episode) and the second as need for mental healthcare because of affective symptoms (mental healthcare use). Participants suffering from DSM (hypo)manic episodes were defined using the DIA–X/M–CIDI/DSM–IV diagnostic algorithm, Reference Pfister and Wittchen15 as follows: participants suffering from neither hypomanic nor manic episodes; or participants suffering from either hypomanic or manic episodes.
In order to assess need for mental healthcare use, data from two DIA–X/M–CIDI sections were used. First, participants were asked whether they were ever treated in a hospital or spoke to a professional because of (hypo)manic symptoms. Second, participants were shown a list of several types of out-patient, in-patient or day-patient institutions for mental health problems, ranging from a general practitioner or a school psychologist to psychiatric sheltered housing, after which they were asked if they had ever sought help at any of these institutions because of any mental health problems. All participants who responded positively to one or both of these questions were considered to have the mental healthcare use outcome.
Statistical analysis
The association (expressed as odds ratio) between persistence as the independent variable and clinical outcome (DSM (hypo)manic episodes and mental healthcare use) as the dependent variable was analysed for each symptom group ((hypo)manic, depressive and bipolar symptoms respectively) and each symptom loading (two, four and six symptoms respectively) using logistic regression in STATA, version 9.2 on Windows XP. First, in order to test for a monotonic trend in the association between level of persistence and transition to the clinical outcome, an ordinal variable was created that represented the level of persistence of each symptom group (values ranging from 0 to 2 for level 0, level 1 and level 2 of persistence respectively). Second, in order to test for a monotonic trend in the association between number of symptoms and transition to the clinical outcome, an ordinal variable was created that represented the number of symptoms present in each symptom group (values ranging from 0 to 3 for zero, two, four and six symptoms respectively). Odds ratios for all phenotypes were adjusted for age.
Results
Analyses regarding the development of DSM (hypo)manic episodes were conducted in a sample of 1902 adolescents. Gender distribution was approximately equal (52.3% males). Mean age at baseline was 18.3 years (s.d. = 3.3; range 14–24). In this risk set, 1.1% (n = 21) developed an incident DSM (hypo)manic episode at T 3.
Analyses regarding mental healthcare use were conducted in a sample of 1648 adolescents. Gender distribution was approximately equal (53.9% males). Mean age at baseline was 18.2 years (s.d. = 3.3; range 14–24). In this risk set, 10.4% (n = 172) had incident mental healthcare use at T 3.
Drop-out rates at T 3 (after excluding all participants without complete data at both T 2 and T 3, yielding a data-set of 2029 participants) were almost equal for the different levels of persistence for: (hypo)manic symptoms (18.8% persistence level 0 v. 21.1% level 1 v. 23.1% level 2); depressive symptoms (19.1% level 0 v. 19.2% level 1 v. 22.2% level 2); and bipolar symptoms (14.9% level 0 v. 22.6% level 1 v. 24.3% level 2).
Presence of (hypo)manic symptoms and transition to clinical outcome
More than a quarter (25.1%, n = 392) of 1565 participants displayed (hypo)manic symptoms once at T 0 or T 2, whereas 2.6% (n = 41) experienced symptoms twice (Table 1). The number of affected participants decreased with increasing level of symptom loading (Table 2).
Table 1 Odds ratios (ORs) monotonic trend for impairment associated with symptom loadinga by level of persistence and symptom group

| (Hypo)manic episodesd,e | Mental healthcare usef | ||||||||
|---|---|---|---|---|---|---|---|---|---|
| Persistence levelb | Total, % (n)c | % (n) | ORa | 95% CI | P | % (n) | ORa | 95% CI | P |
| (Hypo)manic | |||||||||
| 1 | 25.1 (392) | 2.0 (10) | 1.62 | 1.13-2.33 | 0.009 | 12.3 (56) | 1.06 | 0.91-1.25 | 0.448 |
| 2 | 2.6 (41) | 3.2 (2) | 2.37 | 1.11-5.05 | 0.026 | 14.1 (9) | 1.42 | 0.98-2.06 | 0.063 |
| Depressive | |||||||||
| 1 | 45.1 (706) | 0.9 (8) | 1.00 | 0.72-1.40 | 0.996 | 11.9 (89) | 1.20 | 1.06-1.35 | 0.003 |
| 2 | 14.5 (227) | 2.4 (8) | 1.58 | 1.12-2.24 | 0.010 | 20.2 (53) | 1.50 | 1.29-1.74 | <0.001 |
| Bipolar | |||||||||
| 1 | 39.7 (621) | 1.2 (9) | 1.13 | 0.81-1.57 | 0.460 | 11.4 (76) | 1.14 | 1.01-1.29 | 0.039 |
| 2 | 16.6 (259) | 2.4 (9) | 1.71 | 1.22-2.39 | 0.002 | 17.0 (52) | 1.42 | 1.22-1.64 | <0.001 |
Table 2 Odds ratios (ORs) monotonic trend for impairment associated with persistencea by symptom loading and symptom group

| (Hypo)manic episodesc,d | Mental healthcare usee | ||||||||
|---|---|---|---|---|---|---|---|---|---|
| Symptom loading | Total % (n)b | % (n) | ORa | 95% CI | P | % (n) | ORa | 95% CI | P |
| (Hypo)manic | |||||||||
| 2 | 25.8 (404) | 1.9 (10) | 2.10 | 1.10-4.01 | 0.024 | 12.8 (61) | 1.30 | 1.00-1.70 | 0.053 |
| 4 | 16.5 (258) | 2.3 (8) | 2.92 | 1.44-5.93 | 0.003 | 11.5 (38) | 1.22 | 0.88-1.69 | 0.224 |
| 6 | 5.2 (81) | 3.3 (4) | 3.13 | 1.12-8.76 | 0.030 | 11.9 (15) | 1.36 | 0.83-2.23 | 0.222 |
| Depressive | |||||||||
| 2 | 51.5 (806) | 1.2 (13) | 1.58 | 0.90-2.76 | 0.108 | 13.1 (114) | 1.77 | 1.44-2.18 | <0.001 |
| 4 | 40.3 (630) | 1.5 (13) | 1.77 | 1.02-3.08 | 0.041 | 14.6 (101) | 1.79 | 1.45-2.21 | <0.001 |
| 6 | 27.7 (434) | 1.9 (12) | 2.29 | 1.31-4.01 | 0.004 | 16.3 (78) | 1.90 | 1.51-2.39 | <0.001 |
| Bipolar | |||||||||
| 2 | 46.6 (729) | 1.6 (15) | 2.03 | 1.19-3.46 | 0.009 | 12.8 (103) | 1.59 | 1.30-1.93 | <0.001 |
| 4 | 38.4 (601) | 1.7 (14) | 2.24 | 1.31-3.81 | 0.003 | 13.9 (94) | 1.67 | 1.36-2.05 | <0.001 |
| 6 | 27.8 (435) | 2.3 (14) | 2.85 | 1.65-4.91 | <0.001 | 14.8 (74) | 1.76 | 1.40-2.22 | <0.001 |
Participants who never experienced two or more (hypo)manic symptoms (n = 1160) had an 0.7% risk of developing DSM (hypo)manic episodes and a 9.4% risk for mental healthcare use in the final follow-up. With greater levels of persistence, the risk of developing DSM (hypo)manic episodes increased from 0.7% to 2.0–3.2%, and the risk of mental healthcare use from 9.4% to 12.3–14.1% (Table 1). Similarly, with greater levels of symptom loading, the risk of developing DSM (hypo)manic episodes increased to 1.9–3.3% and the risk of mental healthcare use to 11.5–12.8% (Table 2).
Within the different categories of symptom loading (Table 2), an association was found with persistence level for both transition to DSM (hypo)manic episodes (summary increase in risk per unit increase in persistence level (hereafter: summary increase in risk) ranging from 2.10 to 3.13 depending on category of symptom loading) and transition to mental healthcare use (summary increase in risk ranging from 1.22 to 1.36), which was significant for all comparisons related to DSM (hypo)manic episodes (Table 2, columns 5 and 9). Likewise, within each level of persistence, a dose–response relationship was seen between the level of symptom loading and the risk of transition (Table 1).
Depicting level of persistence and level of symptom loading together revealed that level of persistence became increasingly relevant as the number of symptoms persisting increased (Figs 1 and 2).
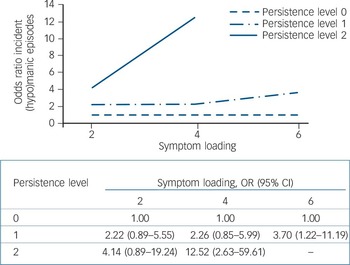
Fig. 1 Risk of incident (hypo)manic episodes following persistence of (hypo)manic symptoms (odds ratios in figure quantified in table below figure).
(Hypo)manic episodes refer to either hypomanic or manic episodes. Persistence: level 0, symptoms not present at T 0 or T 2; level 1, symptoms at one time (T 0 or T 2); level 2, symptoms twice (T 0 and T 2). Reference category: level of persistence 0. Results adjusted for age. Results not applicable if level of persistence 2 and number of (hypo)manic symptoms ≥6 as all participants already became impaired before T 3.
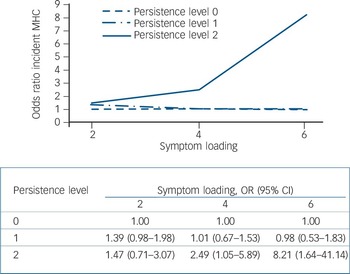
Fig. 2 Risk of incident mental healthcare (MHC) use following persistence of (hypo)manic symptoms (odds ratios in figure quantified in table below figure).
Persistence: level 0, symptoms not present at T 0 or T 2; level 1, symptoms at one time (T 0 or T 2); level 2, symptoms twice (T 0 and T 2). Reference category: level of persistence 0. Results adjusted for age.
Presence of depressive symptoms and transition to clinical outcome
Nearly half (45.1%, n = 706) of 1565 participants displayed depressive symptoms once at T 0 or T 2, whereas 14.5% (n = 227) experienced symptoms twice (Table 1). The number of affected participants decreased with increasing level of symptom loading (Table 2).
Participants who never experienced two or more depressive symptoms (n = 759) had an 0.9% risk of developing DSM (hypo)manic episodes and a 7.6% risk for mental healthcare use.
The risk of developing DSM (hypo)manic episodes was similar for persistence level 0 and 1 (0.9%), but increased to 2.4% for persistence level 2, whereas the risk of mental healthcare use increased with increasing persistence level from 7.6% to 11.9–20.2% (Table 1). Similarly, with increasing level of symptom loading, the risk of developing DSM (hypo)manic episodes increased to 1.2–1.9% and the risk of mental healthcare use to 13.1–16.3% (Table 2). Within the different categories of symptom loading (Table 2), an association was found with persistence level for both transition to DSM (hypo)manic episodes (summary increase in risk ranging from 1.58 to 2.29 depending on symptom category) and transition to mental healthcare use (summary increase in risk ranging from 1.77 to 1.90), which was significant for all but one comparison (Table 2). Similarly, within each level of persistence, a dose–response relationship was seen between the level of symptom loading and the risk of transition (Table 1).
Depicting level of persistence and level of symptom loading together revealed that level of persistence became increasingly relevant as the number of symptoms persisting increased, but only for the outcome of DSM (hypo)manic episodes (Fig. 3) and not for the mental healthcare use outcome (Fig. 4).
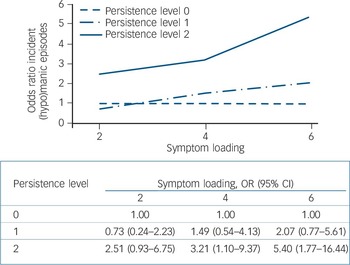
Fig. 3 Risk of incident (hypo)manic episodes following persistence of depressive symptoms (odds ratios in figure quantified in table below figure).
(Hypo)manic episodes refer to either hypomanic or manic episodes. Persistence: level 0, symptoms not present at T 0 or T 2; level 1, symptoms at one time (T 0 or T 2); level 2, symptoms twice (T 0 and T 2). Reference category: level of persistence 0. Results adjusted for age.
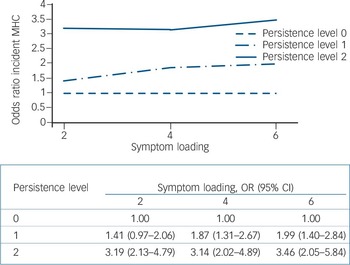
Fig. 4 Risk of incident mental health care (MHC) use following persistence of depressive symptoms (odds ratios in figure quantified in table below figure).
Persistence: level 0, symptoms not present at T 0 or T 2; level 1, symptoms at one time (T 0 or T 2); level 2, symptoms twice (T 0 and T 2). Reference category: level of persistence 0. Results adjusted for age.
Presence of bipolar symptoms and transition to clinical outcome
Almost 40% (39.7%, n = 621) of 1565 participants displayed bipolar symptoms once at T 0 or T 2, whereas 16.6% (n = 259) experienced symptoms twice (Table 1). The number of affected participants decreased with increasing level of symptom loading (Table 2).
Participants who never experienced two or more bipolar symptoms (n = 836) had an 0.6% risk of developing DSM (hypo)manic episodes and an 8.3% risk for mental healthcare use.
With increasing levels of persistence, the risk of developing DSM (hypo)manic episodes increased from 0.6 to 1.2–2.4%, and the risk of mental healthcare use increased from 8.3 to 11.4–17.0% (Table 1). Similarly, with increasing level of symptom loading, the risk of developing DSM (hypo)manic episodes increased to 1.6–2.3% and the risk of mental healthcare use to 12.8–14.8% (Table 2). Again, within the different categories of symptom loading, an association was found with persistence level for both transition to DSM (hypo)manic episodes (summary increase in risk ranging from 2.03 to 2.85 depending on symptom category) and transition to mental healthcare use (summary increase in risk ranging from 1.59 to 1.76), which was significant for all comparisons (Table 2). Likewise, within each level of persistence, a dose–response relationship was seen between the level of symptom loading and the risk of transition (Table 1).
Depicting level of persistence and symptom loading together revealed that level of persistence became increasingly relevant as the number of symptoms persisting increased (Figs 5 and 6).
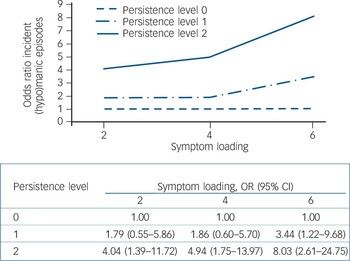
Fig. 5 Risk of incident (hypo)manic episodes following persistence of bipolar symptoms (odds ratios in figure quantified in table below figure).
(Hypo)manic episodes refer to either hypomanic or manic episodes. Persistence: level 0, symptoms not present at T 0 or T 2; level 1, symptoms at one time (T 0 or T 2); level 2, symptoms twice (T 0 and T 2). Reference category: level of persistence 0. Results adjusted for age and number of bipolar symptoms at T 3.
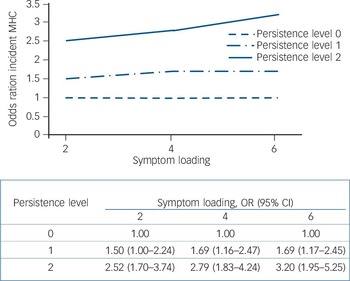
Fig. 6 Risk of incident mental healthcare (MHC) use following persistence of bipolar symptoms (odds ratios in figure quantified in table below figure).
Persistence: level 0, symptoms not present at T 0 or T 2; level 1, symptoms at one time (T 0 or T 2); level 2, symptoms twice (T 0 and T 2). Reference category: level of persistence 0. Results adjusted for age.
Proportion of clinical outcome with prior affective symptoms
Of the participants who developed DSM (hypo)manic episodes at T 3 (n = 21), 47.6% (n = 10) had experienced two or more (hypo)manic symptoms prior to T 2; of these 10, 2 (9.5% of total of 21) had experienced two or more (hypo)manic symptoms more than once. This compares to 61.9% (n = 13) and 38.1% (n = 8) of those who had experienced two or more depressive symptoms at least once or twice respectively, and 71.4% (n = 15) and 42.9% (n = 9) of those who had experienced two or more bipolar symptoms at least once or twice respectively.
Of the participants who developed a need for mental healthcare use (n = 172), 35.5% (n = 61) had experienced two or more (hypo)manic symptoms; of these 61, 9 (5.2% of total of 172) had experienced two or more (hypo)manic symptoms more than once. This compares to 66.3% (n = 114) and 30.8% (n = 53) of those who had experienced two or more depressive symptoms at least once or twice respectively, and 59.9% (n = 103) and 30.2% (n = 52) of those who had experienced two or more bipolar symptoms at least once or twice respectively.
Discussion
The results suggest persistence of symptoms, relative to having symptoms per se, is predictive for transition to clinically relevant outcomes. The dose–response association between persistence and clinical outcomes became stronger as the number of symptoms persisting increased. The current results confirm the hypothesis that (hypo)manic symptoms are frequent in adolescence, most disappearing over time. Reference Lewinsohn, Klein and Seeley3 However, the results also demonstrate that in some adolescents, (hypo)manic symptoms become persistent, representing a risk state that may progress to full-blown, clinically relevant bipolar disorder.
Explaining the role of persistence
The role of persistence of symptoms, in terms of clinical relevance, may be viewed in the light of the kindling-sensitisation model put forward by Post. Reference Post16 According to this model, neurotransmitter pathways are activated by events and produce not only intermediate short-term effects, but also a series of events (i.e. intracellular changes at the level of gene transcription) that have long-lasting consequences for the organism. It is postulated that the type, magnitude and frequency of repetition of the event may be critical to these long-term effects. Thus, every time a person experiences an affective episode, the associated neurotransmitter and peptide alterations may leave behind memory traces that predispose to further episodes, a process referred to as ‘sensitisation’. Reference Post16
An interactive developmental model
In the literature, several explanations are given as to why (hypo)manic symptoms might develop during adolescence, with a focus on neurodevelopmental and environmental changes interacting with genetic risk. Reference Leibenluft, Charney and Pine17–Reference Phillips and Vieta19 According to an interactive developmental model, the course of developmental subclinical expression of psychopathology is affected by interactions between the individual and the environment; exposure to additional environmental risk factors may thus explain why a minority of individuals deviate from a trajectory of good outcome of transient subclinical expressions to progression to the full-blown disorder. Reference Cougnard, Marcelis, Myin-Germeys, De Graaf, Vollebergh and Krabbendam20,Reference Dominguez, Wichers, Lieb, Wittchen and van Os21
Clinical implications
Given the fact that risk factors for bipolar disorder may act by causing persistence of symptoms and subsequent transition from subthreshold expression to a clinical disorder, a window for intervention may exist. Intervention early in life may be particularly relevant, as adolescence represents a period in which the most critical stages of educational, occupational and social development are completed, disruption of which by psychiatric illness may lead to lifelong disability. Reference Merikangas, Akiskal, Angst, Greenberg, Hirschfeld and Petukhova22
Implications for classification
The results should be viewed from a public health perspective of risk, associated with distributed psychometric subthreshold states in the general population, which is different from the need of making a categorical diagnosis of a rare disease in clinical practice. In order to bridge the apparent divide, it has been proposed that the next revisions of DSM and ICD be open to spectrum interpretations of bipolar disorders, and that the same nosological material may be interpreted dimensionally (risk) or categorically (treatment) depending on the purposes of one's interpretation. Reference Ghaemi, Bauer, Cassidy, Malhi, Mitchell and Phelps23 Indeed, some investigators have suggested broadening current diagnostic concepts to include subthreshold states. Thus, Angst and colleagues Reference Angst, Gamma, Benazzi, Ajdacic, Eich and Rossler24 suggest the inclusion of a broader concept of soft bipolarity, and Akiskal and colleagues Reference Akiskal, Akiskal, Lancrenon, Hantouche, Fraud and Gury25 reported empirical support for the inclusion of bipolar II 1/2 (cyclothymic temperament), bipolar III (antidepressant-induced hypomania) and bipolar IV (hyperthymic temperament) as distinct categories. Furthermore, several studies point to the existence of paediatric bipolar disorder, in which an early onset or a longer duration of symptoms predicts a worse outcome. Reference Birmaher and Axelson26
Limitations
Several limitations need to be considered when interpreting the results. First, although a prospective design was used, the study necessarily became partly retrospective by implementing questions regarding time intervals between waves. Therefore, the possibility of recall bias cannot be excluded although arguably this would likely contribute more to false negatives than to false positives as remote episodes of illness may often be forgotten, especially among individuals with milder or less recurrent illness or those who did not receive treatment. Reference Simon and VonKorff27 Second, although trained interviewers at the level of psychologist were used and care was taken to distinguish between (hypo)mania and feelings of euphoria, detecting (hypo)manic symptoms still remains difficult. False positives and false negatives are likely to have occurred, but given the design and interview procedures, their rate is also likely to be low. Third, the possibility exists that people that dropped out from follow-up had more psychopathology than the ones who remained for all longitudinal evaluations. However, this would probably not have influenced the results as drop-out rates were similar across the different levels of persistence. Furthermore, previous analyses showed that mood disorders were not affected by selective attrition (details available from the author on request). Fourth, exclusion of individuals with bipolar impairment at T 0 and T 2, necessary to ensure that associations between persistence and impairment were truly predictive, resulted in a small number of individuals with a T 3 clinical outcome and a decrease in statistical power. Therefore, it is possible that as a result of loss of power the statistical significance of some associations was affected. The fact that effect sizes, albeit some non-significant, are in the expected direction and show dose–response relationships as expected, supports the validity of the results.
Funding
This work is part of the Early Developmental Stages of Psychopathology (EDSP) Study. The EDSP-Study is funded by the German Federal Ministry of Education and Research (BMBF; project no. 01EB9405/6, 01EB 9901/6, EB01016200, 01EB0140, and 01EB0440). Part of the field work and analyses were also additionally supported by grants of the Deutsche Forschungsgemeinschaft (DFG; project no. LA1148/1-1, WI2246/1-1, WI 709/7-1, and WI 709/8-1). M.W. was supported by the Dutch Medical Council (VENI grant number 916.76.147).
Acknowledgements
Michael Höfler, PhD, and Nancy Low, PhD, have provided helpful comments and suggestions on earlier drafts of this article. Kirsten von Sydow, PhD, Gabriele Lachner, MD, Axel Perkonigg, PhD, Peter Schuster, PhD, Holger Sonntag, Dipl.-Psych., Tanja Brückl, PhD, Elzbieta Garczynski, Dipl.-Psych., Barbara Isensee, PhD, Agnes Nocon, Dipl.-Psych., Chris Nelson, PhD, Hildegard Pfister, Dipl.-Inf., Michael Höfler, PhD, Victoria Reed, PhD, Barbara Spiegel, Dipl.-Soz., Andrea Schreier, PhD, Ursula Wunderlich, PhD, Petra Zimmermann, PhD, Katja Beesdo, PhD, Michael Höfler, PhD, and Antje Bittner, PhD, are current or past core staff members of the EDSP group and managed field and data work. Jules Angst, MD (Zurich), Jürgen Margraf, PhD (Basel), Günther Esser, PhD (Potsdam), Kathleen Merikangas, PhD (NIMH, Bethesda), Ron Kessler, PhD (Harvard, Boston) and Jim van Os, PhD (Maastricht) provided scientific advice on the design of the EDSP Study. The EDSP project and its family genetic supplement has been approved by the Ethics Committee of the Faculty of the Technische Universität Dresden (No: EK-13811).


eLetters
No eLetters have been published for this article.