INTRODUCTION
Transmission among individuals of host species is a key process for infectious diseases, and the formulation of the force of infection (FOI) employed to model the transmission is vital for our understanding of disease spread and control [Reference Mollison1–Reference McCaullum, Barlow and Hone3]. Conventional wisdom assumes that the contact between individuals within a host population is through mixing, and each individual has identical susceptibility and infectiousness so that the FOI of the infectious agent follows the so-called mass-action law [Reference Anderson and May4]. The simple mathematical expression of the law is: the transmission rate is proportional to the product of the numbers (or densities) of infected and number of susceptible individuals. The mass-action law, which has been widely used in modelling infectious diseases, is chosen because of its mathematical tractability and convenience [Reference Anderson and May4, Reference Keeling and Rohani5], and also because of the scarcity of actual data for epidemics. However, there is increasingly accumulating evidence that transmission processes are much more complicated because of obviously complex contact patterns among individuals of host populations [Reference Ellner6–Reference Zhang13] and variation in susceptibility and infectiousness among individuals [Reference Matthews14, Reference Carrat15]. Contact patterns vary in accordance with age, sex, distances between localities and other personal/social/demographic characteristic [Reference Cauchemez16]. The complicated patterns involved could be due to the host becoming limited (i.e. saturation) or due to heterogeneities among the host populations. For example, superspreaders are more likely to transmit the disease than others due to their highly disproportionate contacts [Reference Galvani and May17, Reference Riley18]. This could also be due to: e.g. the different mixture of spatially local and global movement interactions, the dynamic response in behaviour to the disease as in the case of influenza [Reference Kao19], or to the aggregation of vectors for infectious diseases vectored by insects [Reference Zhang, Holt and Colvin8]. Susceptibility varies among individuals in respect of age, genotype, and other biological characters so that some individuals are more likely to be infected than others [Reference Fraser20]. The infectiousness of infected individuals depends on the duration of the infectious period and the load of viral shedding, e.g. the infected with high viral shedding have high infectiousness and spread infection much more than others [Reference Matthews14]. In order to understand and model the spread and control of infectious diseases, one challenge is how to choose a parsimonious model that can best take into account all these possible factors while at the same time being simple enough to be explored with analytical derivation and the current power of computation.
The purpose of infectious disease modelling lies in understanding the underlying transmission process and obtaining useful information for designing the optimal intervention strategies. Theoretical studies [Reference McCaullum, Barlow and Hone3, Reference Matthews14, Reference Liu, Hethcote and Levin21–Reference Lloyd-Smith23] suggest that the dynamic behaviours of infectious diseases are greatly affected by the formulation of FOI, implying that the effectiveness and efficiency of intervention programmes rely on the concrete form of transmission rate. This reveals the importance of obtaining the true mechanism of transmission and the factors that impact it from the actual data of epidemics. By integrating modern statistical inference and information theory [Reference Burnham and Anderson24], and experimental and survey data of epidemics, it is now feasible to select the most parsimonious form of FOI [Reference Ellner6, Reference Xia, Gog and Grenfell11–Reference Zhang13, Reference Cauchemez16, Reference Lloyd-Smith23].
In a previous study, we applied model selection to various choices for the FOI for Escherichia coli O157 on Scottish cattle farms, and found that the best transmission dynamics was a nonlinear FOI. It depends on the number of infected cattle farms with the power coefficient b significantly <1 [Reference Zhang13]. Further investigations showed that E. coli O157 infection on Scottish cattle farms cannot be eradicated unless 100% of the farms are under protection, although intervention can surely reduce the prevalence of infection [Reference Zhang and Woolhouse25]. However, according to classical epidemic theory [Reference Anderson and May4] there is herd immunity. That is, the infectious diseases with a mass-action transmission rate can be controlled if the >1–1/R 0 proportion of the host population is under protection. Here R 0 is the basic reproductive number defined as the mean number of infections caused by an infected individual in a susceptible population. This comparison indicates that the optimal intervention programmes based on mass-action law or any other non-data-driven models could be misleading.
In this follow-up study, we investigated how the effectiveness of intervention programme differs among different formulations of FOI based on the survey data of E. coli O157 infection on Scottish cattle farms. The forms of FOI that are usually used for modelling transmission dynamics are employed to fit to the survey data. With maximum-likelihood estimates (MLEs) of model parameters, the realization of an epidemic under different transmission dynamics is built-up through Monte-Carlo simulations and the intervention programmes is performed to investigate their effectiveness. Using the case of E. coli O157 infection on Scottish cattle farms, we attempt to show how the effectiveness of interventions is influenced by the formulation of transmission rate and to illustrate the necessity and importance of model selection that strives to search for the most parsimonious model of transmission dynamics in accordance with the actual data of an epidemic.
METHODS AND MODELS
The enterohaemorrhagic strain of the bacterium E. coli O157, which causes foodborne illness, emerged over two decades ago and is now widespread globally. In Scotland, about 200 cases of infection in humans are reported annually, which is the highest global annual incidence rate during the past 20 years [Reference Chase-Topping26]. Cattle are the main reservoir host for E. coli O157 [Reference Armstrong, Hollingsworth and Morris27] and play a significant role in the epidemiology of human infections [Reference Griffin and Tauxe28]. Thus, to control the infection in humans, it is crucial to understand how E. coli O157 is spread among cattle farms and how it persists in the cattle population. During the past decade, two large surveys were conducted to estimate the prevalence of E. coli O157 on Scottish cattle farms: one from 1998 to 2000 (SEERAD [Reference Gunn29]), the other during 2002–2004 (IPRAVE [Reference Chase-Topping30]). Both concluded that ~19% of Scottish cattle farms harbour E. coli O157 infection, indicating that the infection on Scottish cattle farms is likely to be at an approximate steady state [Reference Pearce31] following its first appearance in the 1980s.
Because the infection of cattle with E. coli O157 is usually harmless to cattle and infected cattle can become susceptible again, susceptible-infected-susceptible (SIS) compartmental models have been employed to study the transmission of E. coli O157 infection in cattle [Reference Turner32]. Individual farms are regarded as either susceptible (S) or infected (I) (i.e. E. coli O157 positive for at least one animal). We developed individual-based stochastic SIS meta-population models to investigate different forms of transmission rate for the spread of infection among cattle farms [Reference Zhang13]. Although we examined explicitly at the farm level, we also implicitly include the contribution of animals within farms by considering the farm size and the fraction of cattle infected on farms. We searched for the best transmission dynamics of E. coli O157 infection on Scottish cattle farms by performing model selection [Reference Burnham and Anderson24]. In the following sections, we introduce first the best model (i.e. the base model) and then the formulations of FOI that were commonly employed in infectious disease modelling.
Basic model
Transmission of E. coli O157 infection on Scottish cattle farms is assumed to occur through two routes: cattle movements among farms and other environmental sources including acquisition of infection from other host species and a contaminated environment [Reference Zhang13]. Based on Akaike's Information Criterion (AIC) [Reference Akaike, Petran and Csaki33], the most parsimonious transmission dynamics of E. coli O157 infection on Scottish cattle farms is given as: The overall probability at which farm i becomes infected on day t is given by:
and the probability that an infected farm recovers to become susceptible again each day is a constant:
Here N i is the number of cattle on farm i with the power coefficient a, I(t) is the number of infected farms at day t with the power coefficient b. M ij(t) is the number of cattle moved from farm j to farm i on day t. The quantities M ij(t) and N i were obtained from the Defra Cattle Tracing System (British Cattle Movement Service, 2005) and the June 2003 Agricultural census data of the Scottish Government (Defra, 2005), respectively. x j is the fraction of cattle infected on farm j which was sampled at each time-step from the on-farm prevalence distribution reported for the IPRAVE survey data [Reference Liu34]. After matching IPRAVE survey farms [Reference Chase-Topping30] with the 2003 census data and cattle tracing system data, our system comprised 13 704 cattle farms [Reference Zhang13].
The model requires four parameters to be estimated: the transmission coefficient β, the power coefficients a and b, and the recovery rate γ. The time-step used in all simulations is 1 day. The power coefficient a with respect to herd size measures the dependence of cattle farm susceptibility on the herd size. In the extreme situation of a=0, farm susceptibility is invariant among farms of different size. The contact between farms is in the sense of the transmission accomplished by the bacterium via routes other than cattle movement, such as vehicles and movement of other animals and birds. The power coefficient b with respect to the number of infected farms I reflects the patterns of mixing between individual farms: b>1 implies that, on average, each infected individual farm during the length of its infectious period contacts more susceptible individual farms than the mass-action assumption (i.e. the well-mixing pattern) while b<1 infected individual farms contact less than the mass-action assumption.
Model variants
Although the spread of E. coli O157 infection among Scottish cattle farms occurs via two routes, cattle movements only play a medium role in maintaining prevalence [Reference Zhang13, Reference Liu34]. To illustrate how different forms of transmission rate affect the effectiveness of intervention programmes, we focused on various choices of transmission rate due to sources other than cattle movements, in which the susceptibility of the cattle farm (i.e. N ia) and the recovery remain the same [i.e. equation (2)] as in the above basic model. The following variants of transmission dynamics are considered and compared with the basic model. Their corresponding deterministic versions are discussed in the Appendix.
(a) The density-dependent transmission rate
The ‘well-mixing’ is assumed among cattle farms which occurs via different means such vehicles, movement of other animals, and birds, so that the probability of infection is linearly proportional to the number of infected farms,
This is a special situation of the basic model with b=1 and is equivalent to the classical mass-action law.
(b) The density-independent transmission rate
The probability for a susceptible cattle farm to become infected due to sources other than cattle movements is independent of the number of infected farms in Scotland.
This is another extreme situation of the basic model with b=0. This variant can be understood as there is a constant source of infectious agent from the surrounding environment, which is independent of the number of infected farms in the Scottish cattle farm system.
(c) The mixture transmission rate
Combining both density-dependent and density-independent forms, the probability for farm i to become infected at day t is,
The source of infection arises both directly from infected cattle farms and indirectly from the surrounding environment.
(d) The Holling response transmission rate
The transmission rate takes Holling functional response so that it saturates into the density-independent transmission rate when the number of infected farms become much larger than the saturation parameter K, while it reduces to a density-dependent transmission rate if only a few farms are infected.
(e) The negative binomial form of transmission rate
The transmission rate considers the degree of ‘heterogeneity’ of infected farms and takes the following form,

Here κ is a parameter describing the heterogeneous infectiveness of infected cattle farms: the smaller κ the greater the degree of heterogeneity so that the infected are more likely to aggregate [Reference Briggs and Godfray35]. When κ>>1 (homogeneity, i.e. well mixing), it reduces to the density-dependent form (i.e. the mass-action law).
(f) The Reed–Frost formula of transmission rate [Reference Vynnycky and White36]
If the per capita transmission rate due to sources other than cattle movements is βN ia(t), the overall probability for farm i to become infected at day t is,
Model fitting
These model variants of transmission dynamics were fitted to IPRAVE survey data [Reference Chase-Topping30] to estimate the values of model parameters. Simulations of an epidemic were compared with IPRAVE data (as presence or absence of infection) for 461 IPRAVE farms by calculating the natural logarithm of the likelihood
where r i=1 if farm i is recorded as positive, r i=0 otherwise. ![]() is the predicted probability that farm i is infected on a particular day (for details see [Reference Zhang13]). Although there is large variation in the estimates of model parameters, the MLEs are in agreement with the modes of Markov chain Monte Carlo-generated distribution of model parameters, as shown for the transmission dynamics given by equations (1) and (2) [Reference Zhang and Woolhouse25]. Further, despite the considerable uncertainty in individual parameter estimates, there was much less uncertainty in the expected impacts of interventions [Reference Zhang and Woolhouse25]. As we were only interested in the impact of different forms of transmission rate on the effectiveness of intervention programmes, effort was only made to obtain the MLEs of model parameters for the above variants of transmission dynamics using the downhill simplex method.
is the predicted probability that farm i is infected on a particular day (for details see [Reference Zhang13]). Although there is large variation in the estimates of model parameters, the MLEs are in agreement with the modes of Markov chain Monte Carlo-generated distribution of model parameters, as shown for the transmission dynamics given by equations (1) and (2) [Reference Zhang and Woolhouse25]. Further, despite the considerable uncertainty in individual parameter estimates, there was much less uncertainty in the expected impacts of interventions [Reference Zhang and Woolhouse25]. As we were only interested in the impact of different forms of transmission rate on the effectiveness of intervention programmes, effort was only made to obtain the MLEs of model parameters for the above variants of transmission dynamics using the downhill simplex method.
Effectiveness of control programmes
Based on the MLEs of model parameters, the effectiveness and efficiency of different intervention programmes were investigated using Monte Carlo simulations. For each model variant of transmission, the simulation starts with five randomly chosen infected farms and reaches a steady state after a burn-in period of 9 years [Reference Zhang13, Reference Liu34]. Control programmes are introduced after the system has been at the steady state for 6 years, and the simulation is allowed to run a further 9 years to monitor the impact of interventions on the prevalence of infection. As cattle movements only have a modest impact on the steady-state prevalence of E. coli O157 [Reference Zhang and Woolhouse25], we merely considered intervention strategies that were involved with the second route of transmission and infectious period. The acquisition of infection from contaminated environment and other species (i.e. the second route of transmission) is characterized by the transmission coefficient β. Its value is simply determined by farm environmental conditions, including food, water and bedding, and other species [Reference Turner32]. Maintaining a high hygiene level of farm conditions and vaccination can reduce the value of β and therefore reduce the chance of becoming infected. Decreasing the duration of infectious period (i.e. 1/γ), such as by applying some treatments, e.g. vaccination and competitive exclusion [Reference Russell and Jarvis37], can also reduce the prevalence of infection.
We considered both population-wide and individual-specific control measures. For the population-wide control, the infectiousness (i.e. either the transmission coefficient or the duration of infectious period) of all cattle farms is reduced by a factor c. For individual-specific control (i.e. targeted intervention), a proportion c of farms were selected based on risk factors (e.g. herd size [Reference Zhang13]) and their infectiousness was reduced to zero. In contrast to pure theoretical investigations [Reference Liu, Hethcote and Levin21, Reference Hochberg22], in the current study we used stochastic models to investigate the consequence of different transmission dynamics and to illustrate the importance of procuring a correct transmission rate of infectious diseases (their simplified deterministic versions are given in the Appendix).
RESULTS
MLEs of model parameters
The results of model fitting are listed in Table 1. Among different model variants of transmission rate, the MLEs of β vary widely, while that of both recovery rate γ and power coefficient a locate at relatively small ranges: γ~0·023–0·056 per day and a~0·17–0·36. This reflects the fact that the role and meaning of β depend highly on the model structure, while that of γ and a remains the same among different variants of transmission dynamics. The density-independent model (i.e. b=0) is roughly indistinguishable from the basic model in view of the value of AIC [Reference Zhang13]. However, the density-dependent model (i.e. b=1) is significantly less favourable. The fitting of the mixture model [equation (5)] suggests that the transmission rate is dominated by the density-independent transmission. This can be seen from the following simple illustration. If about 19% of farms were infected, so I=13 704×19%≅2600, the density-dependent term in the FOI is βI≅5·2×10−4 which is less than the density-independent term Λ=2·5×10−3. These collectively imply a stronger impact of indirect source of contaminated surroundings than the direct source of infected farms.
Table 1. The maximum likelihood estimates of model parameters and model comparison

The model variants are listed in ascending order of values of Akaike's Information Criterion (AIC): AIC=−2l+2n where l is the natural log of likelihood calculated from equation (9) and n the number of model parameters. The most parsimonious model is the one with the lowest AIC value [Reference Burnham and Anderson24].
For the negative binomial model [equation (7)], the ‘degree of heterogeneity’ of cattle farms, indicated by κ=4·22, is not very large, suggesting some kind of heterogeneity in the farms' infectiousness. That is, the infected farms were aggregated rather than randomly distributed. For the Holling functional response model [equation (6)], the MLE of saturation parameter Κ is 3204, which is of the same order of the total number of infected farms (i.e. 13 704×19%≅2600). Therefore this model is quantitatively different from both the density-dependent model [equation (3)] and the density-independent model [equation (4)]. The Reed–Frost model [equation (8)] is similar to the density-dependent model [equation (3)], which reflects the fact that the per capita transmission rate βN a is very small, just about 4×10⁻⁶ even for farms of >600. However, in view of the value of AIC the model [equations (1) and (2)] is the most parsimonious model, as found in [Reference Zhang13].
Control measures and effectiveness
The fraction of infected farms under both population-wide and targeted interventions is shown in Figure 1. Comparatively, the population-wide intervention programme (Fig. 1 a) is less effective than the targeted intervention (Fig. 1 b), as shown in [Reference Zhang and Woolhouse25]. For any FOI model, the difference in their effectiveness among two intervention strategies is only quantitative in view of whether there is a threshold level for the control of infection. We only show the results of interventions based on the reduction of transmission coefficient. The results of interventions based on the reduction of infection period were similar and are therefore not shown here. With increasing control effort, the fraction of infected farms decreased, but the rates of the reduction differ greatly among model variants of FOI.
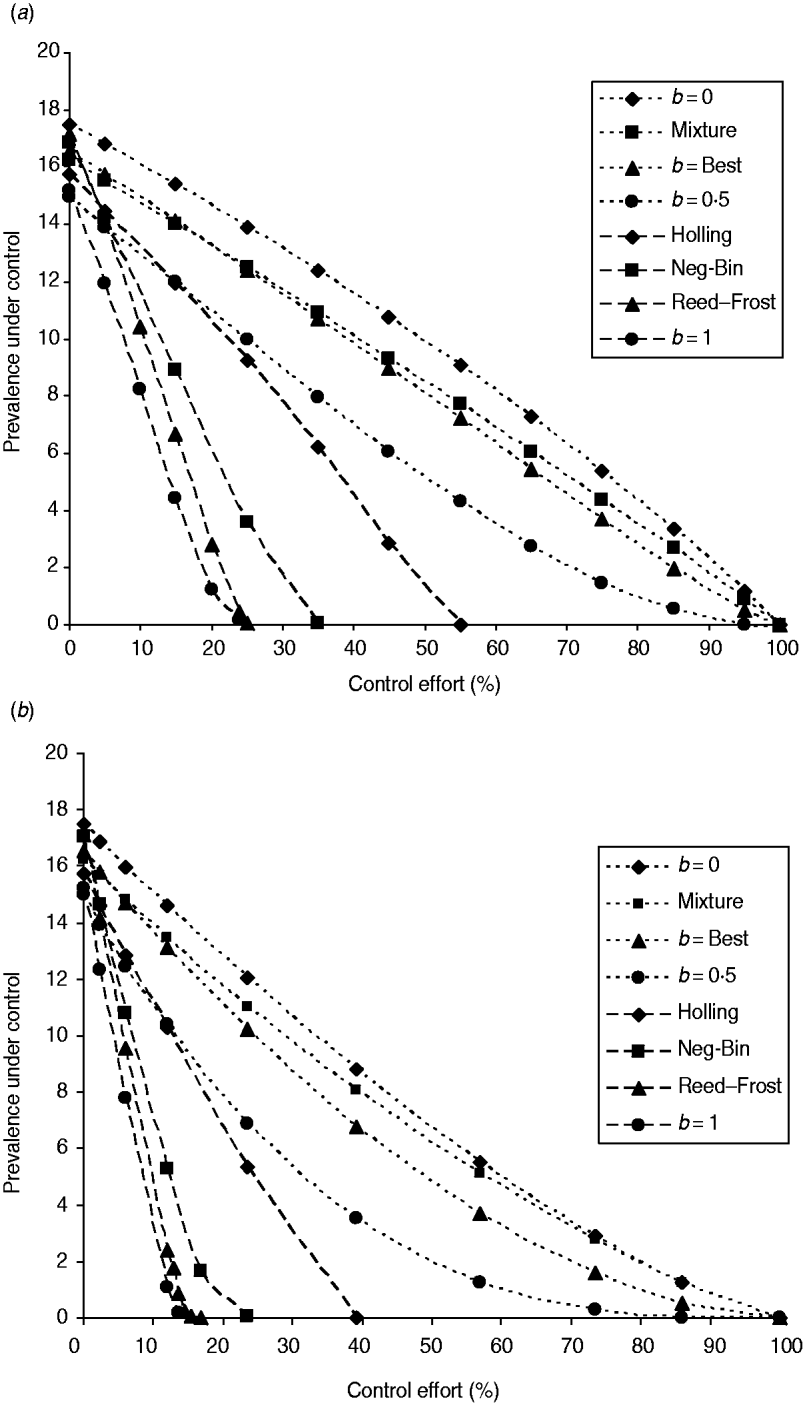
Fig. 1. Infectiveness of interventions under various FOIs. (a) The population-wide intervention: the programme is for reducing the transmission coefficient β to (1−c)β for all farms, where c is the control effort. (b) Individual-specific intervention: the programme is for reducing the transmission coefficient β to zero for farms of large size. The control effort is equal to the proportion of cattle farms that have been made completely immune to infection. The control efforts are 2·3%, 6%, 12%, 14·5%, 23·6%, 30·7%, 39·1%, 56·8%, 73·4%, 85·9%, and 100% if the farms selected have herd size ⩾550, 410, 310, 280, 210, 170, 130, 70, 30, 10, and 0, respectively. The simulations used to generate the effectiveness of the control programmes are based on the maximum likelihood estimate of model parameters listed in Table 1. Eight different model variants of FOI were compared: density-independent (b=0), mixture of density-independent and density-dependent (mixture), the basic model (best, b=0·23), nonlinear FOI with power coefficient b=0·5, Holling functional response (Holling), negative binomial (Neg-Bin), Reed–Frost and density-dependent (b=1). The points represent the averages among results from five independent runs over 9 years.
In the case of mass-action law (i.e. b=1), making higher-risk farms completely immune to infection (i.e. reducing the value of β to zero) (targeted control), or reducing the transmission coefficient over the whole farm system (population-wide control), is very effective for controlling and eliminating the infection (Fig. 1). From equation (3) in the absence of cattle movements, the FOI is approximated as ![]() for farm i. Taking the average cattle farm size
for farm i. Taking the average cattle farm size ![]() [Reference Zhang13], the basic reproductive number is approximated as
[Reference Zhang13], the basic reproductive number is approximated as ![]() , where M is the number of cattle farms (i.e. 13 704). Using the MLEs of model parameters listed in Table 1, the basic reproductive number is R 0 ~1·3. Without cattle movement between farms, it is thus expected, in accordance with traditional epidemiological theory [Reference Anderson and May4], that the infection will be eradicated if the transmission coefficient can be reduced more than (1–1/R 0)=23%. This is the so-called herd immunity [Reference Anderson and May4, Reference Keeling and Rohani5]. The simulation result shown in Figure 1 a is only slightly larger than this approximation, indicating the fact that cattle movements increase the reproductive number [Reference Zhang13].
, where M is the number of cattle farms (i.e. 13 704). Using the MLEs of model parameters listed in Table 1, the basic reproductive number is R 0 ~1·3. Without cattle movement between farms, it is thus expected, in accordance with traditional epidemiological theory [Reference Anderson and May4], that the infection will be eradicated if the transmission coefficient can be reduced more than (1–1/R 0)=23%. This is the so-called herd immunity [Reference Anderson and May4, Reference Keeling and Rohani5]. The simulation result shown in Figure 1 a is only slightly larger than this approximation, indicating the fact that cattle movements increase the reproductive number [Reference Zhang13].
However, when the power coefficient b is less than unity, the intervention programme becomes much less effective and infection would not be eradicated unless all farms are made immune to infection (see also Appendix). A similar thing happens to transmission dynamics of the FOI mixture model because even in such a mixture of FOI, the density-independent term dominates the FOI. In those two models, herd immunity disappears because infection can also be acquired from the contaminated environment, which is out of the control target.
Under three other model variants of FOI (Reed–Frost, negative binomial, Holling functional response), the infection can be eliminated with control effort much less than 100%. Under the Reed–Frost model of FOI, the E. coli O157 infection can be brought under control if effort is >25%, which is close to what was required for transmission dynamics of density-dependent FOI. While under negative binomial and Holling functional response FOI models, the threshold control level increases to 35% and 55%, respectively. Thus under these three model variants, herd immunity comes into effect.
DISCUSSION
Although the simple theory based on mass-action law suggests that infectious diseases can certainly be controlled and the only question is how much control effort should be used to achieve it, our investigations based on E. coli O157 infection on Scottish cattle farms indicate this might not always be the case. The spread and control of infectious diseases depend on the underlying transmission process. As far as mathematical modelling is concerned, the exact formulation of transmission rate is the centre of transmission dynamics. The genuine form of FOI can only be accessed and inferred through the survey data of an epidemic and it may display quite different epidemic processes from those derived from mass-action law. This thus highlights the risk in designing optimal intervention programmes from the conclusions of simple and intuitive models, and also demonstrates the crucial importance of model selection from data-driven models to infer the realistic formulation of FOI.
The underlying mechanism of transmission process affects the spread of infectious diseases and hence impacts the design of control strategies. The FOI consists of three components: susceptibility, infectiousness and the contact between individuals [Reference Diekmann and Heesterbeek2]. The sophisticated risk factors, such as heterogeneous population structure, complicated mixing pattern, variable susceptibility and infectiousness, specific manner of transmission for a particular infectious disease, and possible multiple sources of infection, influence how transmission rate changes with different types of interaction. This complexity suggests the vigilance required in constructing the form of FOI and thus the entire transmission dynamics [Reference Kao19]. The simple theory does supply us with some information about the spread of infection; however, its precise and full understanding requires and depends on the correct formulation of the FOI. For a particular infectious agent, its aetiology and the way it spreads in populations are specific. Although the qualitative and quantitative knowledge from other well-studied infectious agents through analogous comparison might provide us some temporary information, the pivotal and accurate information about the underlying mechanism of the transmission processes can only come from actual survey data and data-driven modelling. The importance of this procedure has been recognized, and many projects have been conducted for this (e.g. 2001 UK foot-and-mouth disease [Reference Keeling38, Reference Ferguson, Donnelly and Anderson39]; 2003 outbreaks of SAR in Hong Kong [Reference Riley18] and Singapore [Reference Lipsitch40]; 2009 pandemic influenza [Reference Cauchemez16, Reference Fraser20]). With high-speed computer and information-based statistical methods, it is possible and now becoming common to perform model selection to infer the most likely model from the survey data. The so-chosen model would provide reliable information for designing the optimal programme of infection control.
Because of scarcity of appropriate epidemiological data and huge uncertainties in risk factors on transmission, one basic issue in applying model selection to distinguish different dynamic processes is: what kind data and how many are sufficient? In principle, more quality data is better. In practice, this kind of high-quality data may be difficult (if possible) and very expensive to obtain, and data that we can obtain, albeit not perfect, might be good enough for us to extract useful information about the underlying dynamic process. In our studies [Reference Zhang13, Reference Zhang and Woolhouse25] we used prevalence data of 461 IPRAVE farms, which are quasi-longitudinal. It is the variation in data vs. time (see figure 2 in [Reference Zhang13]) that allows the dynamic process to be identified. To test whether the IPRAVE prevalence data are sufficient for us to distinguish different models, we analysed risk factors for the presence of E. coli O157 on a farm by both empirical Generalized Linear Mixed Models and the fitting of dynamic models [Reference Zhang13]. After selection from different model variants, both methods concluded that farm size and recent cattle movement are the most important risk factors. The agreement between the two methods provides support that the IPRAVE prevalence data are sufficient to distinguish different dynamic processes. Therefore, it is generally possible to construct a model from obtainable but limited survey data that would describe more accurately the infectious disease dynamics than one using mass-action law.
In our study of E. coli O157 infection on Scottish cattle farms, the epidemic could be eradicated with a control effort level less than 100% if it was caused by one of the following FOIs: density-dependent, Holling functional response, negative binomial, or Reed–Frost form. This indicates that herd immunity exists against the infection although the actual level of herd immunity differs among these model variants. These conclusions are in agreement with the traditional theory [Reference Anderson and May4]. However, those model variants of FOI were rejected in accordance with the AIC values (Table 1). The model supported by the survey data of E. coli O157 infection on Scottish cattle farms [Reference Chase-Topping30] was the basic model of FOI, approximately βI bN a with the power coefficient b=0·23 <1. The epidemic caused by it cannot be brought under control unless 100% control effort is performed. In general, the controllability of an infectious disease depends critically on the value of power coefficient b (see Appendix). For transmission dynamics of FOI βI bN a with b⩾1, infection can be eliminated by a control effort less than 100% (i.e. herd immunity holds); however, for transmission dynamics of FOI βI bN a with b<1, infection would not be eradicated unless an intervention programme of 100% effort is performed (Fig. 1). This kind of transmission dynamics suggests a weak direct dependency of transmission on the number of infected farms as well as the possibility of other indirect sources of infection. Therefore the vanishing of threshold under this situation might come as a consequence of heterogeneity in the mixing patterns [Reference Liu, Hethcote and Levin21, Reference Hochberg22, Reference May and Lloyd41] and multiple sources of infection.
Although our study was based on E. coli O157 infection on Scottish cattle farms, the insight derived from it should be of general value to other infections as far as the relationship between control effectiveness and the form of FOI is concerned. Despite desperate efforts made to eradicate as many fatal infectious diseases as possible, only two infectious diseases have been successfully eradicated so far: one specifically affecting humans (smallpox) [42] and one affecting a wide range of ruminants (rinderpest) [43]. This fact indicates the complexity of transmission dynamics of infectious diseases as well as the limitation of simplified models of transmission dynamics. Nevertheless, this encourages and necessitates the need to perform model selection by taking the advantage of statistical inference methods and actual data of epidemics. Only through painstaking effort can the genuine form of FOI and reliable and accurate information for design of optimal intervention be obtained.
ACKNOWLEDGEMENTS
I am grateful to Mark Woolhouse for his encouragement and helpful discussions and to two anonymous reviewers for their comments. This work was supported by the Wellcome Trust and the Defra/SFC VTRI programme.
DECLARATION OF INTEREST
None.
APPENDIX. SIS deterministic models with different forms of FOI
In the case of constant susceptibility for each farm, the stochastic model considered in this paper is equivalent to the following deterministic SIS epidemic model with the FOI f(S, I):
with a constant total population size M=S+I. There are two equilibria: one is disease-free (I*=0, S*=M) and the other is endemic (I*>0, S*=M−I*), which is determined by the equation:
The stability of equilibria can be investigated by examining the eigenvalues of the Jacobian matrix. For the dynamic system [equations (A1)−(A2)], it is
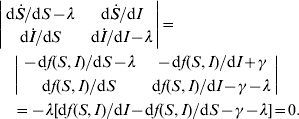
For the equilibrium (S*, I*), its stability condition is determined by the following inequality
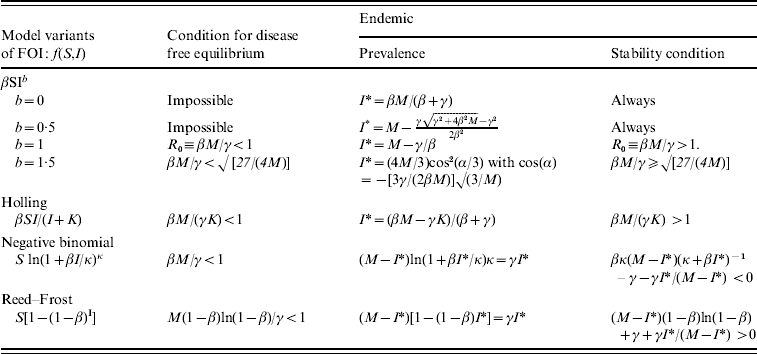
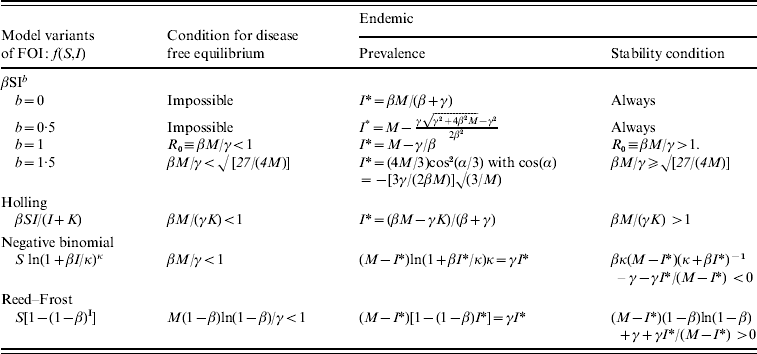
The stability conditions and the prevalence of endemic are given in Table A1 for the seven different model variants of FOI. The dependence of prevalence of epidemic on the relevant parameters are illustrated in Figure A1 , indicating the possibility of whether the epidemic can be controlled or not. Figure A2 shows the results of the corresponding deterministic version of the SIS models; most are similar to that of stochastic models except for the negative binomial model. Ignoring variation in transmissibility makes the behaviour of the negative binomial model close to that of the density-dependent model.
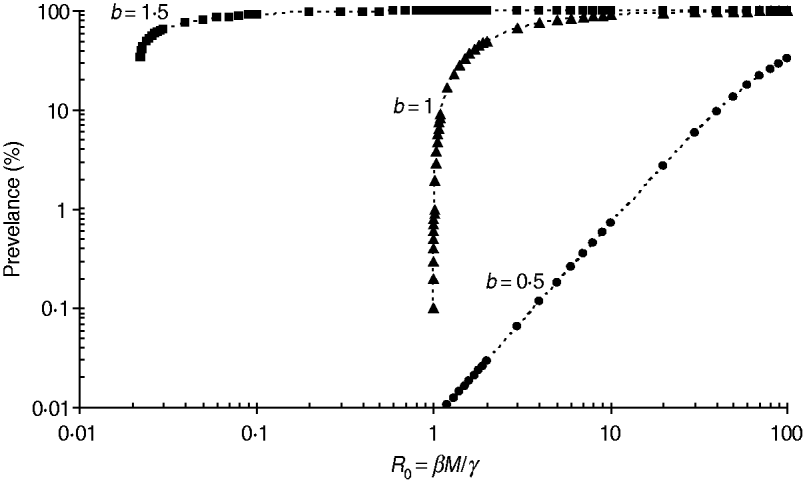
Fig. A1. Impact of the power coefficient b on the transmission dynamics of FOI f(S,I)=βSI b. The example shown is for a population of size M=13 704. The threshold value of βM/γ is √(27/(4M))≅0·02 and 1·0 for b=1·5 and 1·0, respectively, while there is no threshold for b=0·5.
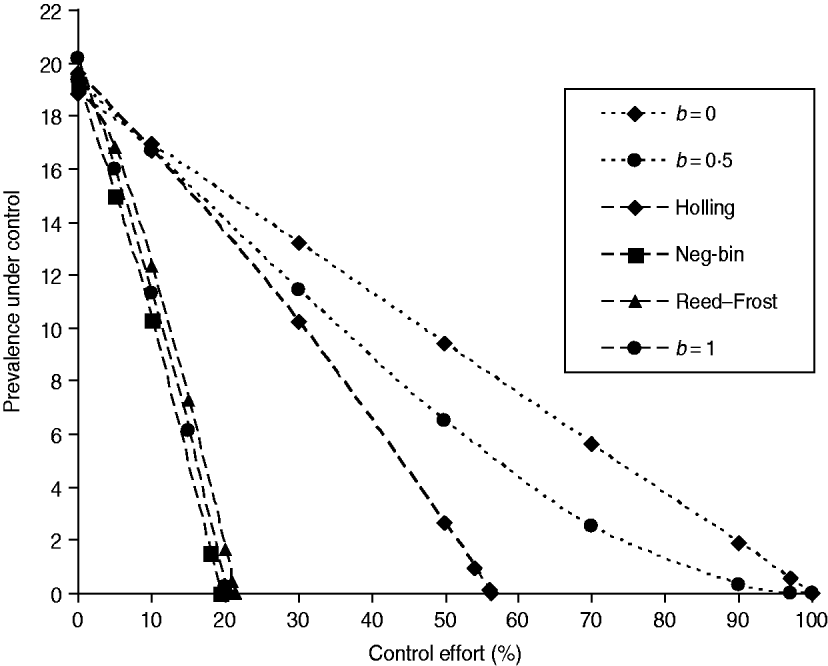
Fig. A2. The infectiveness of intervention under various formulations of FOI. The model parameters were taken from Table 1, and the new transmission coefficient is recalculated as βN b where the herd size takes the average value of N=140 [Reference Zhang13]. The intervention is the population-wide reduction in the transmission coefficient as in Figure 1 a.


