


Introduction
The mountain cryosphere provides critical services including water storage, climate regulation and habitat for cold-adapted species (Huggel and others, Reference Huggel, Carey, Clague and Kaab2015). Rock glaciers are one component of the mountain cryosphere that is particularly important in semi-arid montane portions of the world. In the contiguous western USA, the total water equivalent of rock glaciers is estimated to be one-quarter of that of glaciers (Fountain and others, Reference Fountain, Glenn and Basagic2017; Jones and others, Reference Jones, Harrison, Anderson and Betts2018; Trcka, Reference Trcka2020). While climate change is reducing snowpack and glacier mass balance (Moore and others, Reference Moore2009; Huss and others, Reference Huss2017; Mote and others, Reference Mote, Li, Lettenmaier, Xiao and Engel2018), rock glaciers are hypothesized to be more resilient to warming due to their insulating debris mantle (Anderson and others, Reference Anderson, Anderson, Armstrong, Rossi and Crump2018); the response time of rock glaciers to warming is hundreds of years (Müller and others, Reference Müller, Vieli and Gärtner-Roer2016), much longer than the decadal response time of mid-latitude glaciers (Cuffey and Paterson, Reference Cuffey and Paterson2010) and the almost immediate response time of snow. This suggests that rock glaciers may become an increasingly important source of summer water supply and refugium for cold-adapted species (Millar and others, Reference Millar2015; Harrington and others, Reference Harrington, Hayashi and Kurylyk2017, Reference Harrington, Mozil, Hayashi and Bentley2018; Jones and others, Reference Jones, Harrison, Anderson and Betts2018).
Rock glaciers depend on a balance of ice and debris fluxes which are controlled by climate, topography and lithology (Morris, Reference Morris1981; Chueca, Reference Chueca1992; Brenning and Trombotto, Reference Brenning and Trombotto2006; Johnson and others, Reference Johnson, Thackray and Van Kirk2007; Millar and Westfall, Reference Millar and Westfall2008; Brenning and Azócar, Reference Brenning and Azócar2010; Bolch and Gorbunov, Reference Bolch and Gorbunov2014). Most previous studies on these combined factors, herein referred to as rock glacier habitat, have been largely descriptive, conducted at the scale of mountain ranges or small regions (<300 000 km2), and/or have considered limited hydroclimatic information despite the dependence of rock glaciers on the accumulation and ablation of snow and ice. Notable exceptions include Johnson and others (Reference Johnson, Chang and Fountain2021) and Millar and Westfall (Reference Millar and Westfall2019). Larger scale assessments of the influence of a more targeted, process-oriented set of predictors may better identify the fundamental environmental niche of rock glaciers and test qualitative and conceptual hypotheses of rock glacier habitat.
Case studies and numerical modeling approaches for individual or small groups of rock glaciers found that rock glaciers in warmer locations will deteriorate with continued warming while some conventional glaciers may transition to rock glaciers (Kääb and others, Reference Kääb, Chiarle, Raup and Schneider2007; Delaloye and others, Reference Delaloye, Lambiel and Gärtner-Roer2010; Anderson and others, Reference Anderson, Anderson, Armstrong, Rossi and Crump2018; Jones and others, Reference Jones, Harrison and Anderson2019; Marcer and others, Reference Marcer2021). Glaciers that become rock glaciers are likely to persist on the landscape longer and continue to provide important services such as cool summer water supply. These past analyses have provided valuable insights into rock glacier rheology, response times and climate sensitivity, but fall short of providing a more generalizable understanding of how rock glaciers occupy landscapes across broader scales or how they may respond to climate change. It remains unclear under what geologic, topographic and hydroclimatic conditions rock glaciers are likely to persist, disappear or develop from glaciers.
Here we employ a machine learning approach (the maximum entropy method (Maxent); Phillips and others, Reference Phillips, Anderson and Schapire2006; Phillips and Dudík, Reference Phillips and Dudík2008) to address three primary questions: (1) What hydroclimatic, geologic and topographic constraints describe the environmental niche of rock glaciers?; (2) How will the spatial distribution of rock glaciers change with projected climate change? and (3) What is the potential for glacier to rock glacier transformation in the western USA? We address these questions by constructing a Maxent model of rock glacier distributions using datasets of known rock glacier locations and high-resolution pre-industrial hydroclimatic, geologic and topographic predictors across the contiguous western USA. We use this model and data reflecting present and projected late 21st-century hydroclimatic conditions under a high-warming scenario to predict where rock glaciers are likely to disappear, persist or develop from glaciers in the future, noting that the actual process of equilibration to these scenarios will take hundreds of years. This approach elucidates generalizable controls on rock glacier spatial distributions and their hydroclimatic sensitivity and allows us to provide the first estimates of future rock glacier distributions across the contiguous western USA.
Data and methods
Data
To answer our three research questions, we compiled a set of environmental predictors that capture the hydroclimatic, topographic and geologic controls on rock glaciers (Table S1). Predictors cover the contiguous western USA at a common 210 m spatial resolution, similar to the scale of the rock glaciers themselves (Johnson and others, Reference Johnson, Chang and Fountain2021). We limit the western US modeling domain to potential rock glacier habitat using lower montane and higher elevation classes from the mountain classification scheme of Körner and others (Reference Körner, Paulsen and Spehn2011) and a mean annual pre-industrial temperature threshold <8°C (data described below; Fig. 1). This domain contains all active rock glacier features from the inventory of Trcka (Reference Trcka2020; n = 1486), in which active rock glaciers are defined as those that contain ice and that move, regardless of origin (glacial or periglacial), as indicated by (1) terminus slopes that are steeper than the angle of repose and exhibit lighter-colored, less weathered debris, (2) a swollen as opposed to deflated appearance and (3) significant extension of the feature into the valley (Barsch, Reference Barsch1996; Jones and others, Reference Jones, Harrison and Anderson2019). In contrast, inactive rock glaciers (not considered in the present study) are those that contain ice but no longer move and are characterized by a more gently sloping terminus of weathered rock, a deflated appearance, possible vegetation cover and extension of the feature into the valley suggesting past movement and internal ice but no present movement and little internal ice (Barsch, Reference Barsch1996; Johnson and others, Reference Johnson, Thackray and Van Kirk2007). Non-rock glacier periglacial features were excluded from the inventory. The Trcka (Reference Trcka2020) inventory is an update of the Johnson (Reference Johnson2020) inventory and can be considered the rock glacier counterpart to the more recent glacier and perennial snowfield inventory of Fountain and others (Reference Fountain, Glenn and Mcneil2023). A further description of the Trcka inventory is provided in the Supporting information. The centroids of the active rock glaciers were used as presence locations in the Maxent models. Glacier outlines from the Global Land Ice Measurements from Space dataset (GLIMS; Fountain, Reference Fountain2006; Hoffman and Fountain, Reference Hoffman and Fountain2016) and modeled permafrost probability data (Obu and others, Reference Obu2019) were also used for comparison with rock glaciers.

Figure 1. (a) Modeling domain. Elevation of terrain is indicated by the color bar. Black points denote known rock glacier locations. In bivariate density plots of (b) mean annual temperature and annual precipitation and (c) aspect and slope, salmon color indicates the distribution of rock glacier locations while gray-blue indicates the distribution of background domain locations in 2-D pre-industrial covariate space.
Given the rapid recent global warming and the roughly several hundred years response time of rock glaciers to warming (Müller and others, Reference Müller, Vieli and Gärtner-Roer2016), it is unlikely that rock glaciers are in equilibrium with the present hydroclimate (Anderson and others, Reference Anderson, Anderson, Armstrong, Rossi and Crump2018). We assumed that current rock glaciers are a result of pre-industrial hydroclimate (1850–79) and developed models of the present distribution of rock glaciers using pre-industrial hydroclimate forcing. We then predicted rock glacier distributions under present hydroclimate conditions (2000–13) and future conditions under a high-warming scenario (2071–2100); data sources are described below. Since the models are calibrated on pre-industrial conditions and current rock glacier locations, predicted rock glacier distributions for the different time periods reflect the distribution that would result once rock glaciers equilibrate to the given hydroclimatic conditions. For the present period, climatological measures of mean, minimum and maximum annual temperatures (tmean, tmin, tmax), annual number of temperature oscillations ~0°C (freeze–thaw; based on 4 hourly data), annual precipitation (precip), annual rainfall (rain) and annual downward solar radiation (solar) were calculated from output from the Weather Research and Forecasting model (WRF; Liu and others, Reference Liu2017) for 2000–13 statistically downscaled to ~210 m horizontal resolution using local lapse rates, precipitation bias correction and solar terrain correction (Lute and others, Reference Lute, Abatzoglou and Link2022). Pre-industrial climate covariates were created by perturbing the present period to reflect pre-industrial conditions (1850–79) using monthly climatological differences in climate between the pre-industrial and present periods from the Fifth Coupled Model Intercomparison Project (CMIP5; Taylor and others, Reference Taylor, Stouffer and Meehl2012; Lute and others, Reference Lute, Abatzoglou and Link2022). Future climate covariates were created using pseudo-global warming runs from the WRF, reflecting 2071–2100 conditions under RCP8.5 derived from 19 climate models participating in CMIP5 (more details are available in Liu and others, Reference Liu2017). Both pre-industrial and future covariates were downscaled using the same methods as the present period (Lute and others, Reference Lute, Abatzoglou and Link2022). Further discussion of the predictor variables is available in the Supporting information.
We also considered snow metrics calculated from an energy-balance snow model (Lute and others, Reference Lute, Abatzoglou and Link2022) forced with the previously described climate datasets. These metrics include annual snowfall water equivalent (sfe), snow duration (duration), annual maximum snow water equivalent (maxswe) and the number of snow-free days between the snow on and snow off dates (nosnowdays). The use of snow data enhances the physical relevance of the predictor variables relative to using variables derived from temperature and precipitation alone as is often done in environmental niche modeling, and may enhance model transferability in space and time (Austin, Reference Austin2002).
Topographic factors are widely known to influence rock glaciers as they affect both debris and ice supply as well as the energy budget (Frauenfelder and others, Reference Frauenfelder, Haeberli and Hoelzle2003). Here ice supply is considered to come from snow accumulation as well as freezing water within the ice-debris matrix. To capture these topographic effects, terrain aspect, terrain slope and a headwall area metric were derived from the 1 arcsec National Elevation Dataset (Gesch and others, Reference Gesch, Evans, Oimoen and Arundel2018), aggregated to 210 m resolution. The headwall area metric was calculated as the fraction of pixels within a given radius of the target pixel that are higher elevation than the target pixel and exceed a slope threshold (e.g. Bolch and Gorbunov, Reference Bolch and Gorbunov2014; Kenner and Magnusson, Reference Kenner and Magnusson2017). We employed two radii (three and five pixels; 630 and 1050 m) to create headwall metrics at different scales (headwall3 and headwall5, respectively).
Geologic factors influence the debris available for rock glaciers, thereby exerting a first order control on rock glacier distributions (Haeberli and others, Reference Haeberli2006; Johnson and others, Reference Johnson, Thackray and Van Kirk2007). We used a rasterized version of a generalized lithology classification consisting of 12 rock types (Anning and Ator, Reference Anning and Ator2017) to represent these effects. Rock type descriptions are provided in Table S2.
Methods
To address our fundamental question of the hydroclimatic, geologic and topographic constraints that shape the environmental niche of rock glaciers we employ Maxent modeling. Maxent modeling (Phillips and others, Reference Phillips, Anderson and Schapire2006; Phillips and Dudík, Reference Phillips and Dudík2008) is a commonly used machine learning approach for environmental niche modeling that is data-driven and well-suited to large datasets. Maxent models use known species presence locations and spatial fields of predictors (i.e. background data) to construct features from the predictor data which are combined to allow modeling of complex, non-linear relationships. Maxent's logistic output provides continuous values between zero and one which can be interpreted as a measure of habitat suitability. Maxent has provided excellent performance in predicting species distributions, including under new conditions in space and time (Elith and others, Reference Elith2006; Duque-Lazo and others, Reference Duque-Lazo, van Gils, Groen and Navarro-Cerrillo2016). There has been a recent uptick in the application of Maxent in the physical sciences and glaciology in particular where it has generated new insights into surging glaciers and glacier responses to climate change (Sevestre and Benn, Reference Sevestre and Benn2015; Comino and others, Reference Comino, Fiorucci, Rosso, Terenziani and Treves2021; Manquehual-Cheuque and Somos-Valenzuela, Reference Manquehual-Cheuque and Somos-Valenzuela2021; Wang and others, Reference Wang2021). Maxent is well suited to address the questions we pose here because it (1) uses presence only data such as the rock glacier inventory, (2) can handle large datasets of environmental covariates enabling high-resolution, large-extent modeling and (3) is designed to address questions about changing distributions and habitat suitability. We implemented Maxent using the dismo (Hijmans and others, Reference Hijmans, Phillips, Leathwick and Elith2020) and ENMeval (Kass and others, Reference Kass2021) packages in R (R Core Team, 2020). For modeling efficiency, 10 000 background points were randomly selected for model calibration, in addition to the 1486 known rock glacier locations.
Prior to running Maxent, we removed strongly collinear variables (see Supporting information, Fig. S1 for details), leaving nine covariates. Next, to determine optimal model complexity and avoid overfitting, we built a suite of models using various levels of model complexity (as determined by the beta parameter and feature classes) and evaluated model performance using the corrected Akaike information criterion statistic (Akaike, Reference Akaike1974; Fig. S2; see Supporting information for details). The selected model was used to map rock glacier habitat suitability across the domain based on Maxent's logistic output.
We performed several cross validations of the model to assess model transferability geographically and to new climates. First, we split the data into 400 km × 400 km blocks using the blockCV R package (Valavi and others, Reference Valavi, Elith, Lahoz-Monfort and Guillera-Arroita2019) with a block size approximately ten times larger than the median effective range of spatial autocorrelation of the predictor variables (Fig. S3). Second, we split the data into cold and warm groups to evaluate potential model transferability to a warmer climate. Specifically, we developed a model using data with pre-industrial tmean below the median value for rock glacier locations (~−2.8°C) and evaluated this model on the warmer half of rock glacier presence locations. The area under the receiver operating characteristic curve statistic (AUC) was used to assess model performance.
To assess our first research question, predictor variable importance was assessed using the model jackknife approach available in Maxent. The approach calculates the loss in regularized training gain when each variable is left out of a model as well as the regularized training gain of a model built on that variable alone. We present a normalized version of the regularized training gain for ease of interpretation. The relationship of each covariate to the model predictions of presence was further evaluated by inspecting the response curves that characterize the relationship between covariate values and predicted suitability of rock glacier habitat from models based on each variable in isolation. Additional marginal response curves that characterize the relationship between covariate values and predicted suitability when all other variables are held constant at their average value are provided in Figure S4.
To address our second research question, the optimal model calibrated on the pre-industrial covariates and current active rock glacier locations was used to predict rock glacier habitat suitability over time by applying it to the pre-industrial, present and future predictors. Throughout, references to results for a particular time period should be interpreted as results assuming active rock glacier equilibration to hydroclimatic conditions in that time period, not to realized changes by that time period. For example, predictions of rock glacier suitability under future hydroclimate represent the potential distribution of active rock glaciers that would result once rock glaciers reached equilibrium with the future climate, which in reality may be hundreds of years later due to the slow response of rock glaciers to warming (Müller and others, Reference Müller, Vieli and Gärtner-Roer2016).
To control predictions outside of the range of the calibration data, we used clamping, which keeps the response curve probabilities constant outside the range of calibration conditions. To define a binary presence/absence threshold from the continuous model predictions, we used the pre-industrial suitability threshold that omitted 10% of known rock glaciers. This threshold was chosen to balance the competing objectives of minimizing over prediction of rock glacier suitable area and minimizing categorization of known rock glacier sites as unsuitable. For both the pre-industrial to present transition and the present to future transition, locations were classified into four groups depending on the change in their predicted suitability. Locations that did not exceed the threshold in either the earlier or later period were classified as ‘never suitable’. Locations that exceeded the threshold in both periods were labeled ‘persist’. Locations which were suitable in the earlier period but not in the later period were labeled ‘disappear’, and locations which were not suitable in the earlier period but were suitable in the later period were labeled ‘enhance’. Suitable and unsuitable classifications were also used to aggregate suitability predictions by ecoregion (US Environmental Protection Agency, 2013; Table S3).
To address the third research question, we extracted the rock glacier suitability for each time period at locations currently occupied by conventional (i.e. ice) glaciers. We assessed spatial patterns of suitability and average rock glacier suitability across these locations. Locations of potential glacier to rock glacier transformation were defined as presently glacierized areas which the model indicated were suitable for rock glaciers. To better understand differences between glacier and rock glacier habitat, we compared the topographic, geologic and hydroclimatic characteristics of glacier and rock glacier locations, as well as the characteristics of suitable and unsuitable rock glacier habitat in glacierized locations.
Results
Environmental niche model of rock glaciers
The Maxent model identified several intuitive hydroclimatic, geologic and topographic constraints in the environmental niche of rock glaciers (Fig. 2). The optimal Maxent model based on the balance of performance and parsimony had a beta parameter of nine and linear, quadratic, threshold and hinge feature classes and an AUC of 0.97 (Fig. S2). The model jackknife approach highlighted annual mean temperature (tmean) as the most important variable in the rock glacier suitability model (Fig. 2a), with headwall (headwall5), slope and snowfall water equivalent (sfe) as the next most important. The relationships between each variable and predicted rock glacier suitability largely matched expectations based on the literature (Fig. 2b; Fig. S4 shows marginal response curves). Hydroclimatically, the model found that rock glaciers were most likely in areas with tmean within a few degrees of −5°C, <500 mm rainfall, <200 W m−2 solar radiation, ~500–2000 mm of sfe and continuous snowpacks. Rock glaciers were more likely to be found on northern aspects, on 10–40° slopes, and in locations with non-zero headwall areas. The model showed a slight preference for metamorphic and igneous rock types and indicated sedimentary rock types were less likely to host rock glaciers.
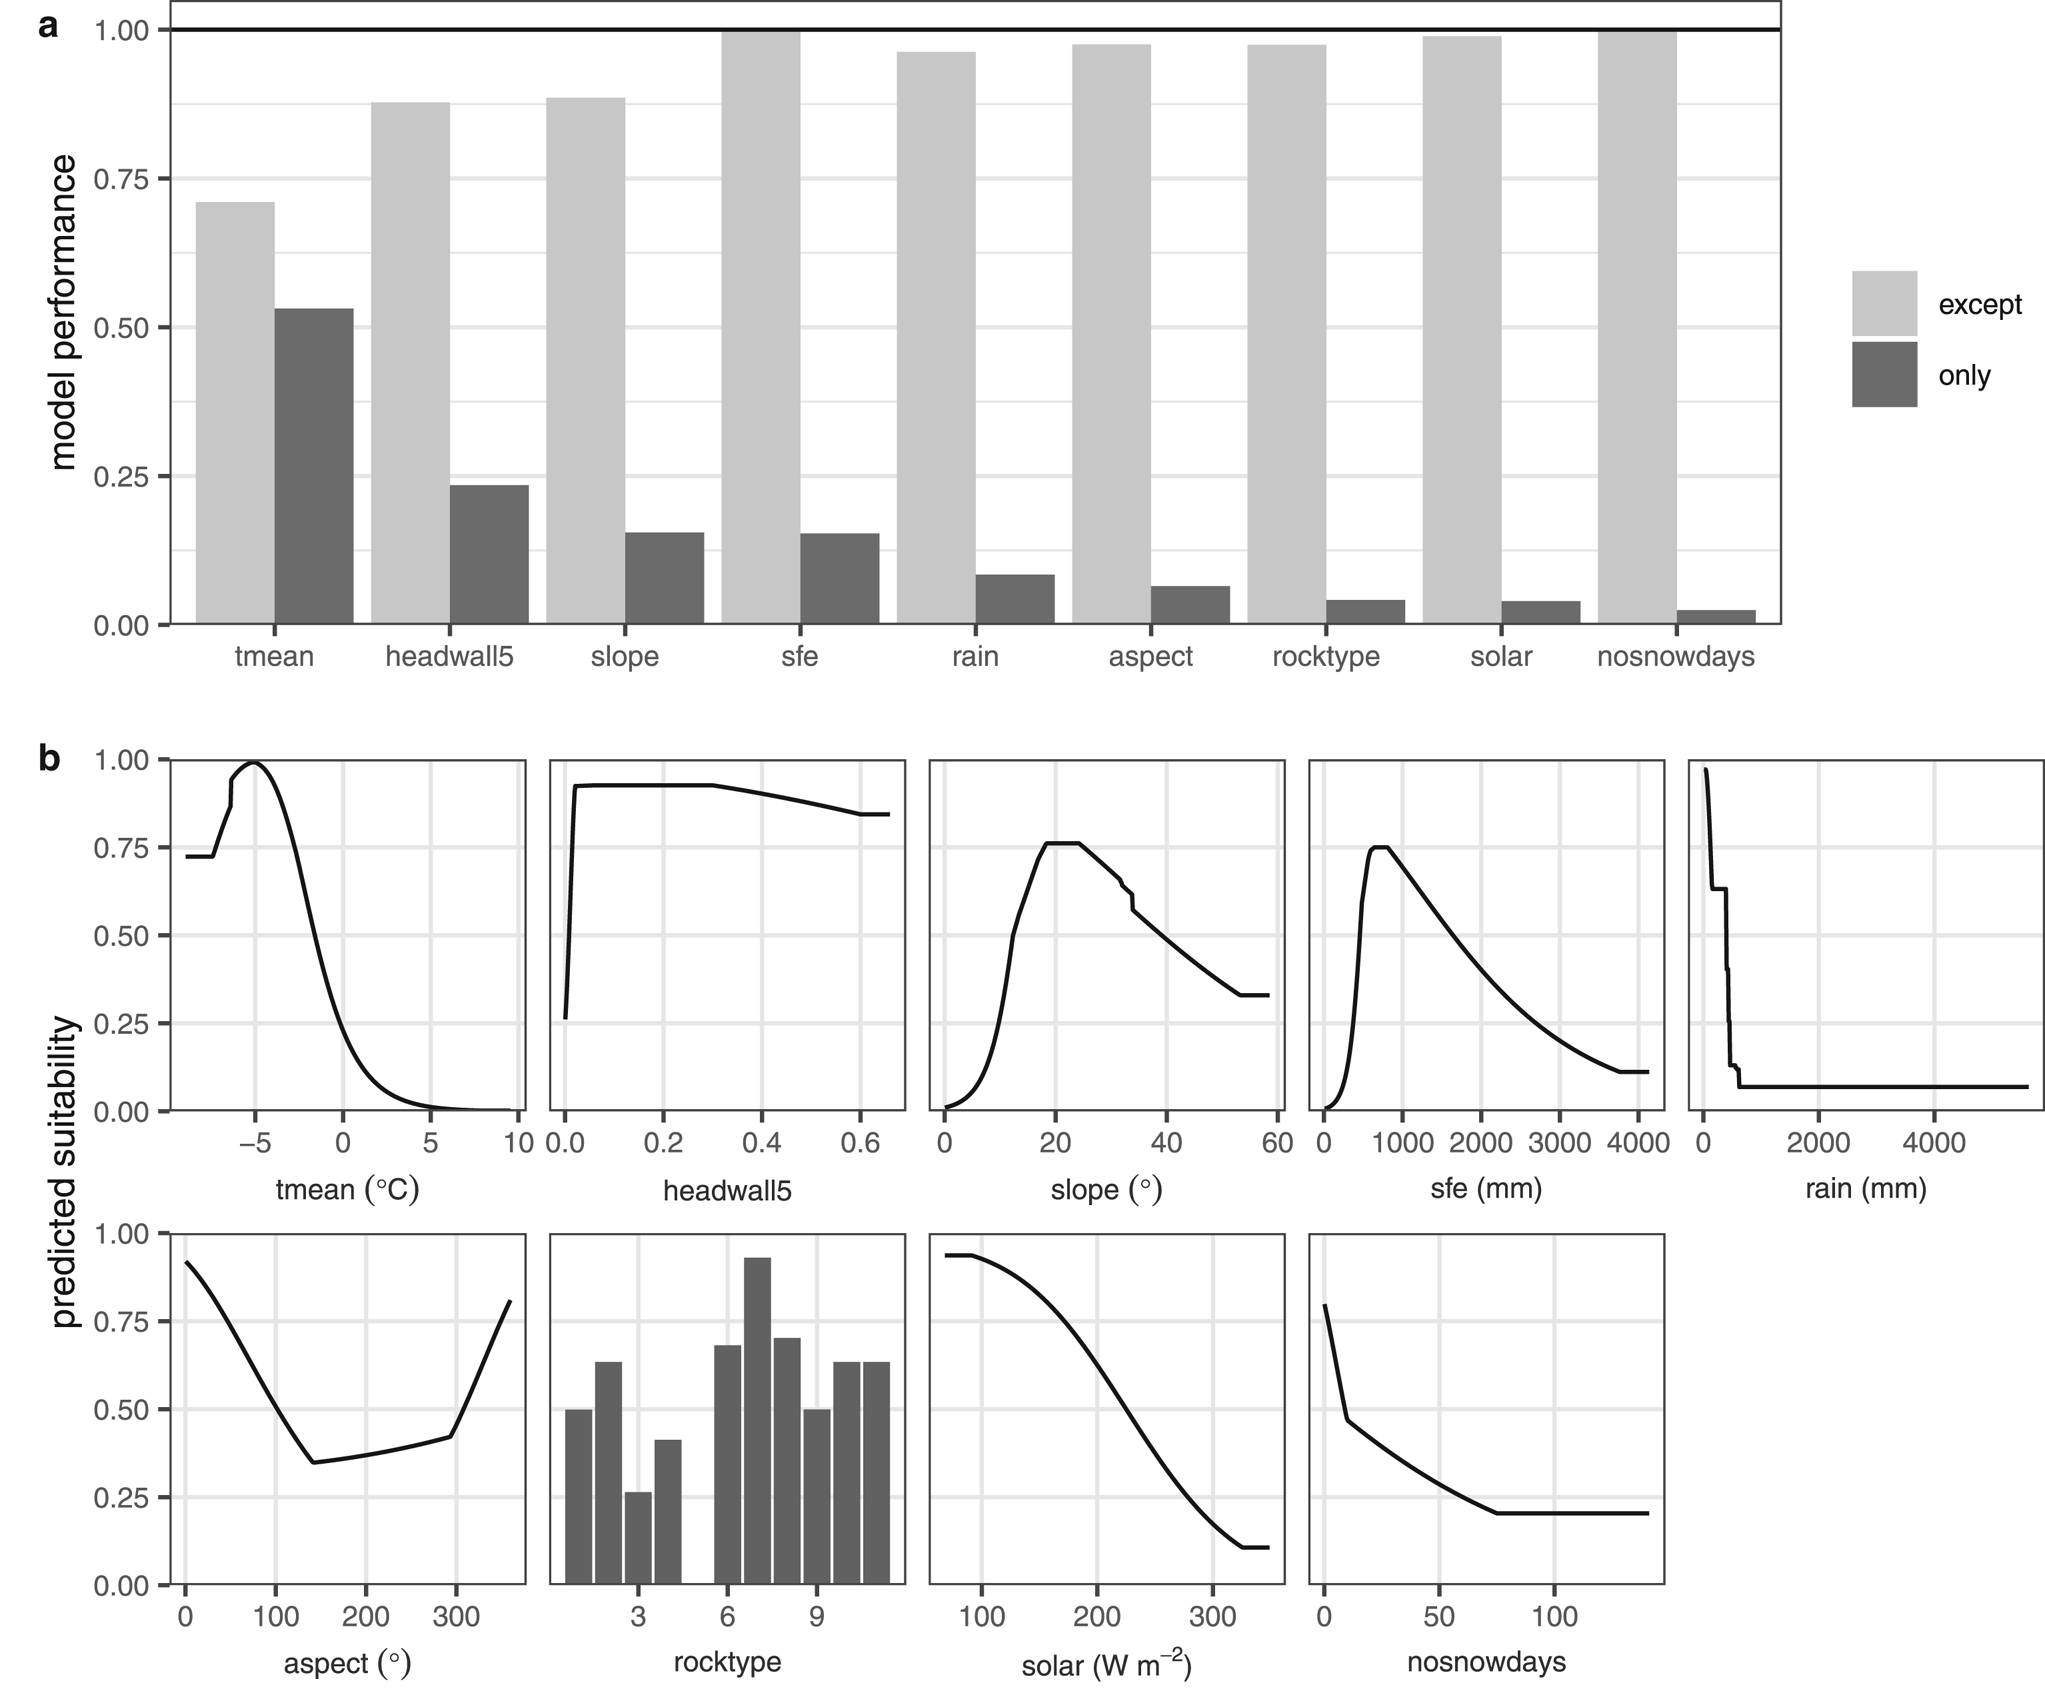
Figure 2. Results of the Maxent modeling, showing the dependence of rock glacier habitat suitability on each pre-industrial covariate. (a) Results of the Maxent jackknife approach, showing the importance of each variable relative to a baseline model including all covariates. Model performance (y-axis) is the normalized regularized training gain. Black horizontal line at 1.0 indicates the performance of the model with all variables. Light gray bars indicate the performance of models built with all variables except for the variable of interest. Dark gray bars indicate the performance of models built on each variable alone and determine the order of the bars. (b) Response functions illustrating the relationship between the covariate values (x-axis) and the rock glacier habitat suitability (y-axis) based on models of each variable in isolation (dark gray bars in (a)). Covariates considered are annual mean temperature (tmean), headwall area (headwall5), terrain slope (slope), snowfall water equivalent (sfe), annual rainfall (rain), terrain aspect (aspect), rock type (rocktype), mean annual downward shortwave radiation (solar) and number of snow-free days between snow on and snow off dates (nosnowdays). Descriptions of rock type values are available in Table S2.
The mean suitability at active rock glacier locations was higher than at inactive rock glacier locations (0.72 and 0.52, respectively; Table S4). Rock glaciers excluded at the prediction threshold (suitability <0.23, representing the bottom 10% of rock glaciers) were scattered across the domain, with the greatest concentrations in Colorado and New Mexico (Fig. S5). Known rock glaciers predicted to have low suitability tended to have smaller headwall areas, more snow-free days, more diverse aspects and rock types, less snowfall, more solar radiation and warmer temperatures (Fig. S6).
Models calibrated on portions of the domain and validated on other portions of the domain maintained high AUC values in both calibration and validation, suggesting that the model is robust to changing environmental conditions (Table S5). In particular, a model calibrated on colder rock glacier locations exhibited no degradation in performance when applied to warmer rock glacier locations, suggesting that the model may be transferable to future climates.
Predicted rock glacier distributions
The Maxent model described above was forced with pre-industrial covariates to predict rock glacier habitat suitability under pre-industrial hydroclimate, which is assumed to drive the present distribution of rock glaciers. Using a suitability threshold of 0.23, this approach predicted ~29 300 km2 of potential rock glacier habitat across the 437 000 km2 modeling domain, with concentrations in the high-elevation regions of the Rockies, the southeastern Sierra Nevada, and the eastern portion of the North Cascades (Table S3; Figs 3a, d). The areas of high-predicted rock glacier suitability aligned well with known current rock glacier locations (Fig. 1); however, the total area of suitable rock glacier habitat was much greater than the area of known rock glaciers (226 km2; Trcka, Reference Trcka2020), suggesting that modeled suitable areas should be viewed as possible not actual rock glacier habitat. The spatial distribution of pre-industrial rock glacier suitability also corresponded well with the spatial distribution of permafrost (Fig. S7). Permafrost probabilities were greater than rock glacier suitability values in some of the highest elevation, coldest mountain ranges in Wyoming and Colorado, whereas the opposite was true in warmer mountain ranges such as the Northern Cascades and the Sierra Nevada. This finding is expected given that permafrost presence is conditioned primarily on temperature, which is mediated to some extent by snow cover and the degree of air ventilation within the ground (Harris and Pedersen, Reference Harris and Pedersen1998). In contrast, rock glaciers require suitable moisture and debris inputs as well as temperature, factors that are controlled by topographic, geologic and broader hydroclimatic conditions. We also emphasize that rock glaciers in this region are typically smaller than the 1 km2 gridcells of the permafrost data and low permafrost probability values indicate sporadic permafrost, therefore it is reasonable that rock glaciers may occur in locations with low permafrost probabilities.
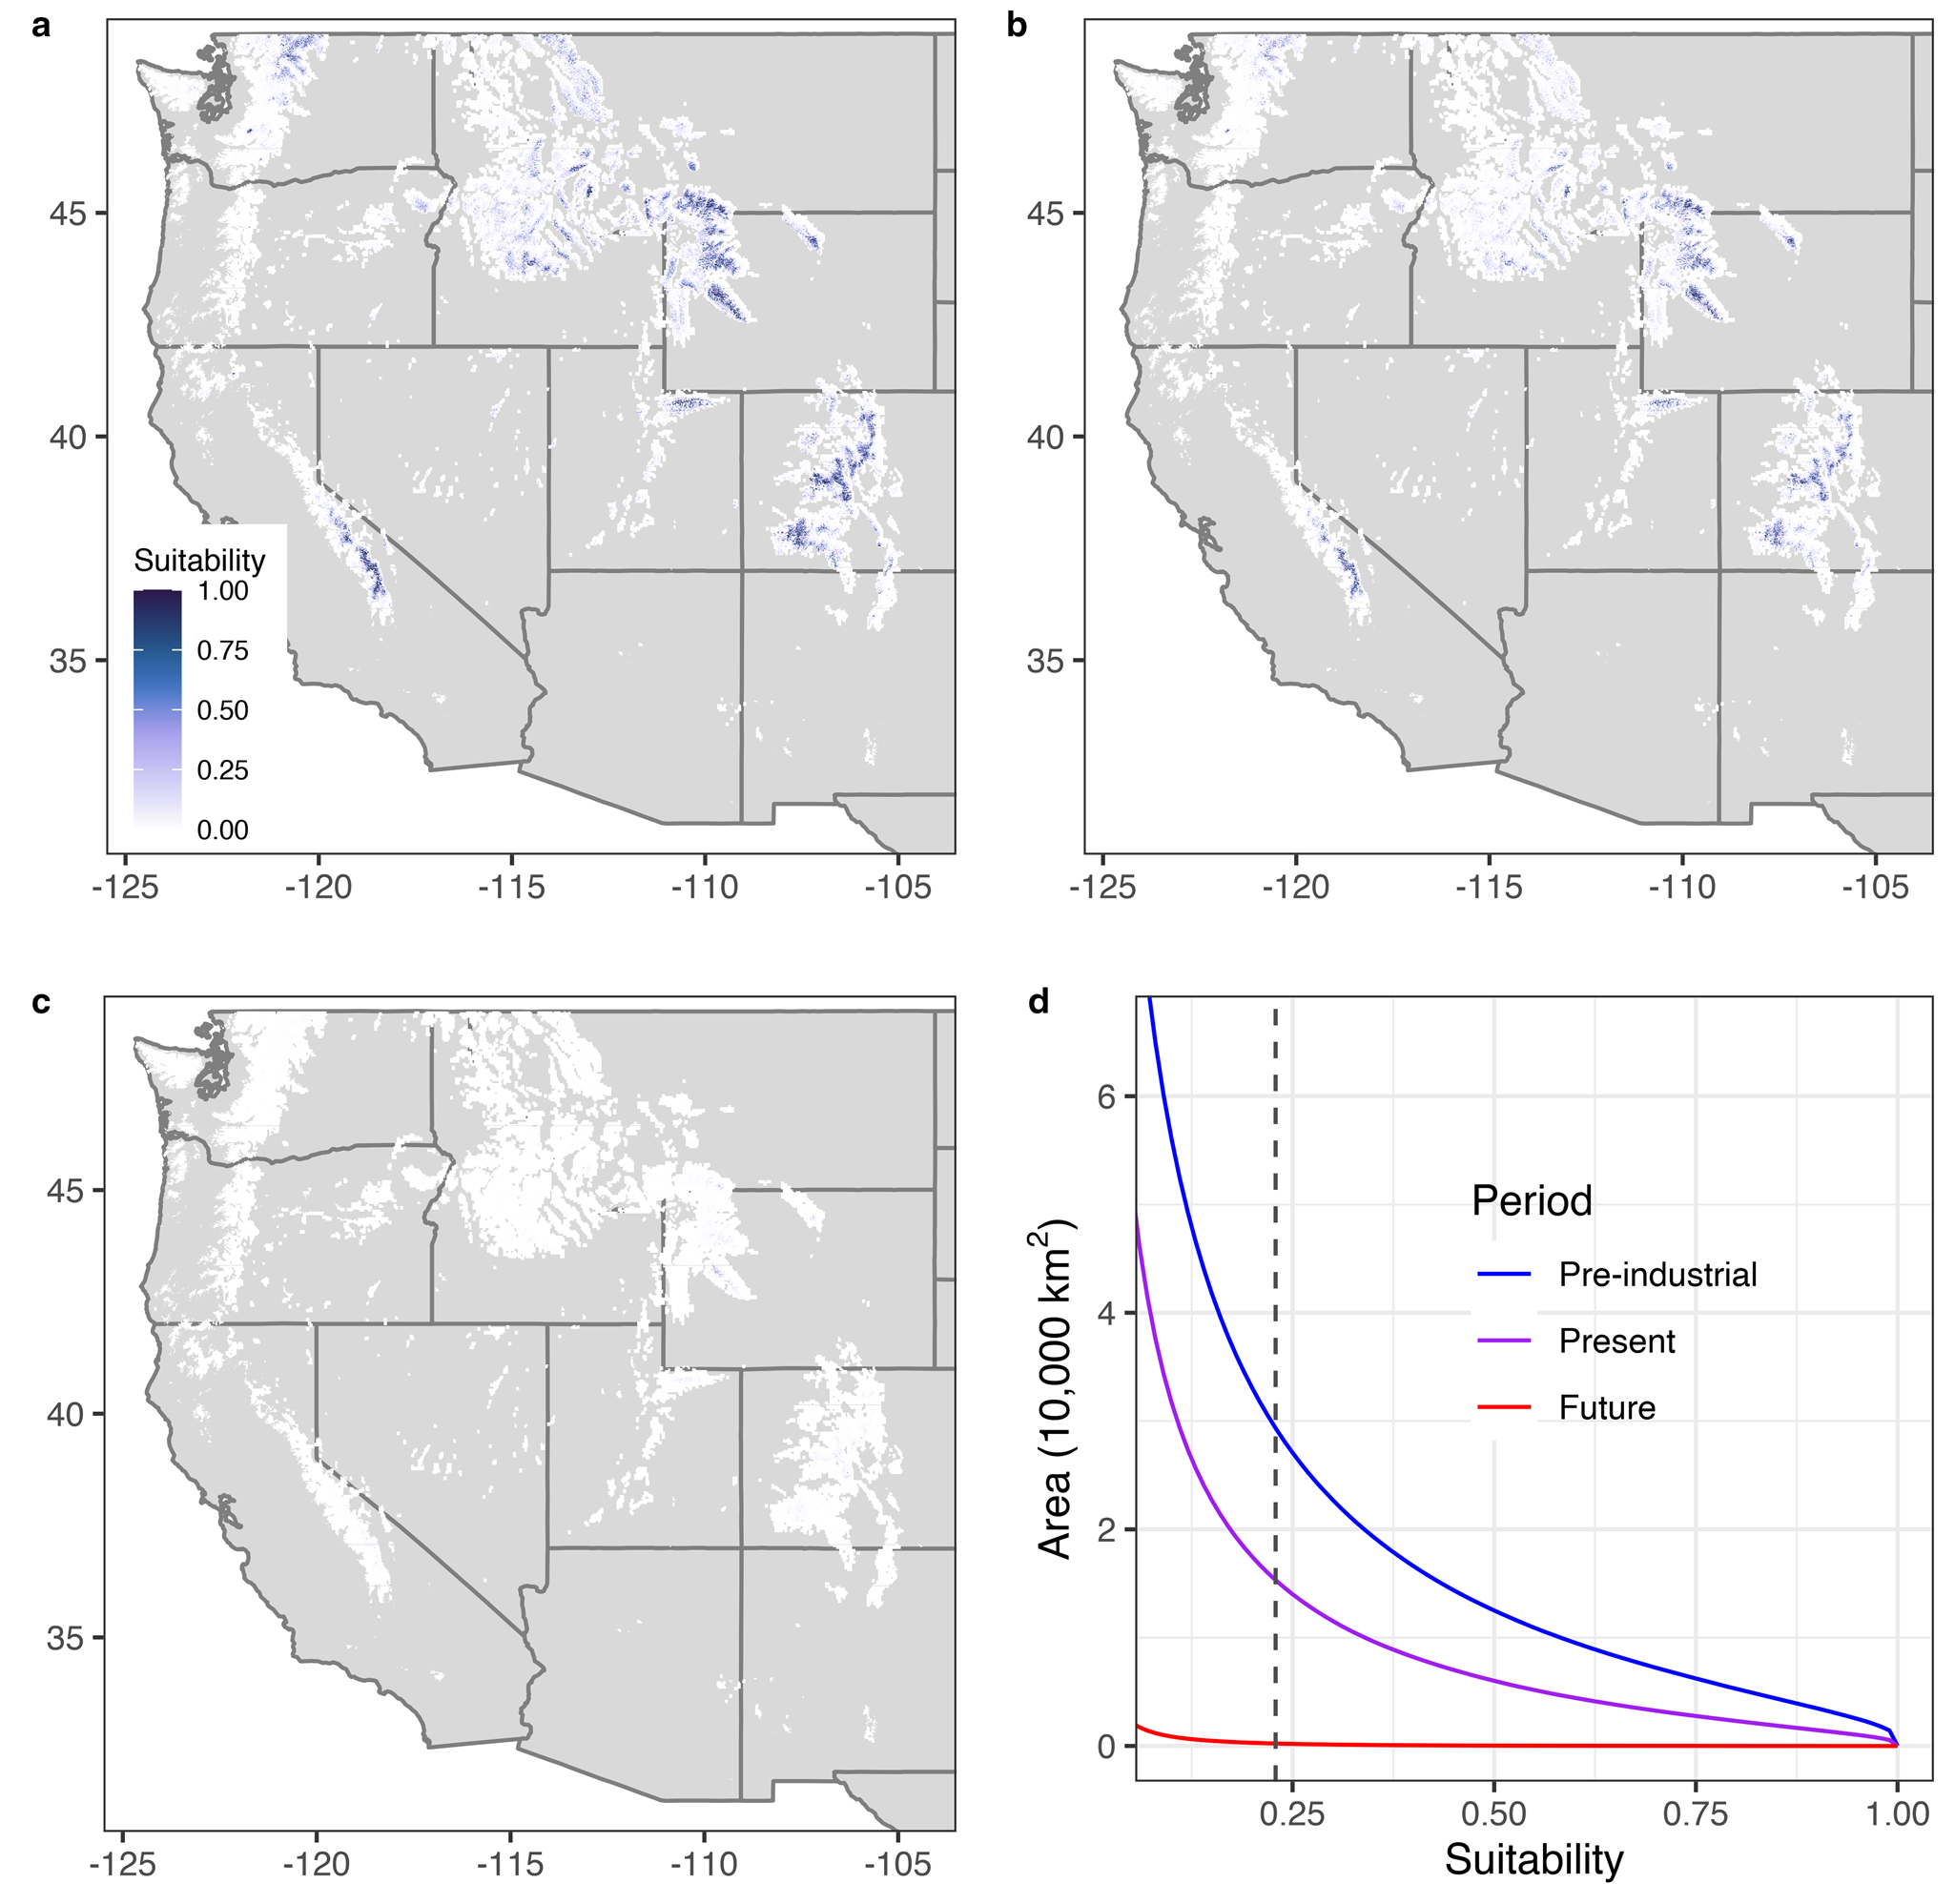
Figure 3. Predicted suitability for rock glaciers under pre-industrial (a), present (b) and end of 21st-century high-end warming (c) conditions across the contiguous western USA (d) shows the area on the y-axis that exceeds the suitability level on the x-axis (starting at 0.1) for the three time periods. The dashed line in (d) marks the suitability threshold used in subsequent analyses (0.229).
Maxent was then forced with data representing present and future hydroclimatic conditions. These scenarios simulate the response of rock glaciers in equilibrium with novel conditions, not the response of rock glaciers on the same time frame as the hydroclimatic changes. Thus, rock glacier response to present hydroclimate conditions may not be realized until hundreds of years from now. The rock glacier suitability in equilibrium with the present hydroclimate exhibits a spatial pattern similar to that in equilibrium with pre-industrial hydroclimate (Fig. 3b). However, most locations that were suitable in the pre-industrial period saw a reduction in suitability when projected to the present hydroclimate, resulting in a net reduction in suitable area of 48% or 14 400 km2, and 23% of known rock glacier locations being unsuitable (Table S3). A few areas were predicted to have enhanced suitability (<0.1% of the domain), including high-elevation portions of the Southern Sierra and Middle Rockies. These locations were cooler, had more solar radiation and were more focused on southern aspects relative to locations where habitat persisted or disappeared (Fig. S8). Locations where habitat persisted tended to be more focused on north aspects and have cooler temperatures than locations where habitat disappeared (Fig. S8).
Drastic reductions in rock glacier habitat were simulated using future late 21st-century high-end warming (Fig. 3c). Relative to the present period, more than 99% (~29 100 km2) of suitable habitat was projected to disappear, including 94% of known rock glacier locations (Table S3). The 0.1% of the domain projected to retain suitable habitat under the future hydroclimate was scattered in the Sierra Nevada, the Middle Rockies, the Wasatch and Uinta mountains and the Southern Rockies (Table S3). These locations were cooler, more focused on north aspects, received less solar radiation, had larger headwall areas and were at higher elevations than locations where suitability was projected to disappear (Fig. S9). No gridcells were predicted to have enhanced suitability in the future hydroclimate.
Glacier to rock glacier transformation
To address our third research question, regarding glacier to rock glacier transformation, we evaluated the rock glacier suitability at locations presently occupied by glaciers. Present-day glaciers cover ~554 km2 of the modeling domain (Fountain and others, Reference Fountain, Glenn and Basagic2017). Relative to rock glacier locations, glacier locations span a larger range of temperature and have more snowfall and lower solar radiation (Fig. S10). Additionally, glaciers can occupy sites with more rain, at lower elevations, and with higher slopes than rock glaciers. During the pre-industrial period, 42.6% of present glacier area was considered suitable for rock glaciers. Suitable area declined to 28.3% in the present period and 2.9% in the future period. Glacierized locations that retained suitable rock glacier habitat in the present period had cooler temperatures, less rain and snowfall and were at higher elevations than locations that became unsuitable (Fig. 4). Rock glacier suitability increased between the pre-industrial and present periods at some glacierized locations in the Middle Rockies. These locations had cooler temperatures, more solar radiation and were located at higher elevations, on lower slopes and were less focused on north aspects (Fig. 4).
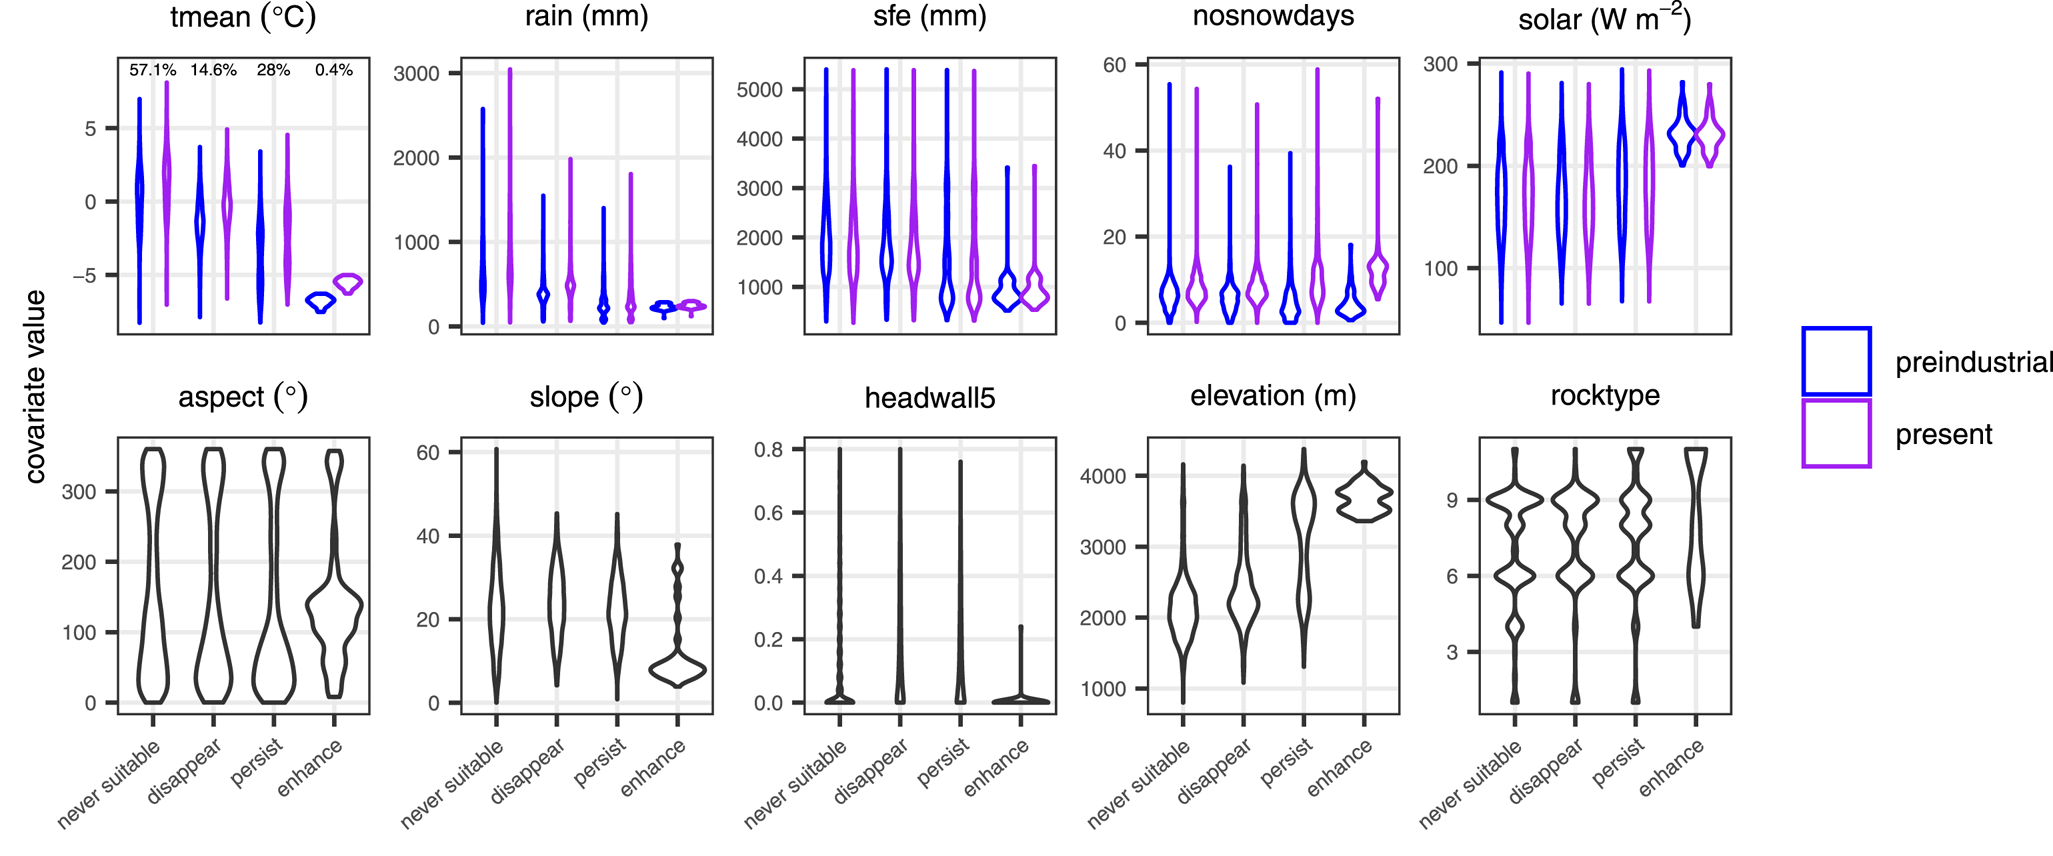
Figure 4. Distribution of covariates between pre-industrial (blue) and present (purple) time periods, for presently glacierized locations, grouped by suitability change category. For covariates that are not time-varying (bottom row), a single violin is shown for each suitability category. In the first subplot, percent values indicate the percent of modeled glacierized area that falls into each category.
Between the present and future periods, there was a large reduction in rock glacier suitability at glacierized locations (Fig. S5). Relative to locations where suitability disappeared, locations where suitability persisted had cooler temperatures, less rain, more solar radiation, larger headwall areas and were more concentrated on north aspects and at high elevations.
Discussion
Maxent model fit and transferability
The Maxent model calibrated on pre-industrial covariates and current known rock glacier locations performed very well in both calibration and cross validation, maintaining AUC values >0.85 in all cases (Table S5). The excellent cross-validation performance and the diversity of conditions across the contiguous western USA suggest that the model may transfer well to locations outside of the modeling domain, including warmer novel climates. The calibration AUC of 0.97 indicates that the model is skilled at discriminating between rock glacier and background locations (Merow and others, Reference Merow, Smith and Silander2013); however the model predicted ~29 300 km2 of suitable habitat in the pre-industrial period, which is significantly greater than the estimated area of present rock glaciers (226 km2; Trcka, Reference Trcka2020). Model identification of unoccupied but ‘potential’ habitat and its distinction from the realized environmental niche is common in species distribution modeling (Elith and Leathwick, Reference Elith and Leathwick2009). Discrepancies between the two in this case may stem from several sources. Rock glaciers are difficult to detect in aerial imagery and therefore may be underestimated in the inventory. Some rock glaciers may have adjusted more quickly to hydroclimatic changes than we assumed and may already be lost, resulting in rock glacier models based on pre-industrial climate over predicting habitat. Finally, differences between modeled and actual habitat may be in part due to imperfect representation of constraints on rock glacier habitat stemming from choice of covariates and uncertainty in covariate values, which we discuss further below.
Rock glacier environmental niche
Relationships between topographic and geologic covariates and rock glacier habitat suitability simulated by the model (Fig. 2b) matched expectations based on the literature (Wahrhaftig and Cox, Reference Wahrhaftig and Cox1959; Brazier and others, Reference Brazier, Kirkbride and Owens1998; Matsuoka and Ikeda, Reference Matsuoka and Ikeda2001; Frauenfelder and others, Reference Frauenfelder, Haeberli and Hoelzle2003; Haeberli and others, Reference Haeberli2006; Johnson and others, Reference Johnson, Thackray and Van Kirk2007; Angillieri, Reference Angillieri2010; Bolch and Gorbunov, Reference Bolch and Gorbunov2014; Kenner and Magnusson, Reference Kenner and Magnusson2017; Charbonneau and Smith, Reference Charbonneau and Smith2018). Climatically, rock glaciers were more likely in areas with pre-industrial annual mean temperature <0°C, with peak suitability within a few degrees of −5°C, which corresponds well with some other estimates of rock glacier temperature niches based on present climate (Bolch and Gorbunov, Reference Bolch and Gorbunov2014; Kenner and Magnusson, Reference Kenner and Magnusson2017; Munroe, Reference Munroe2018) but is cooler than other estimates (Millar and others, Reference Millar, Westfall and Delany2013; Millar and Westfall, Reference Millar and Westfall2019). Additionally, the distribution of suitable habitat under pre-industrial hydroclimatic was similar to estimates of the current distribution of permafrost (Obu and others, Reference Obu2019). In terms of precipitation, rock glaciers were more likely in areas that received <500 mm a−1 of rain and between 500 and 2000 mm a−1 of sfe, which is comparable to previous estimates of winter precipitation at rock glaciers (Millar and Westfall, Reference Millar and Westfall2008; Millar and Westfall, Reference Millar and Westfall2019). Areas with low solar radiation had higher predicted suitability (Fig. 2b, Johnson and others, Reference Johnson, Thackray and Van Kirk2007). Compared with previous efforts to understand controls on rock glacier spatial distributions, this work considered more functionally relevant covariates, a larger spatial extent, a larger sample of known rock glaciers and a larger range of environmental conditions. These characteristics, in addition to several successful cross validations, lend confidence to the generalizability of the relationships we found between environmental covariates and rock glacier distributions.
Future spatial distribution of rock glaciers
This work provided the first estimates of future rock glacier spatial distributions. Relative to pre-industrial rock glacier habitat, habitat in equilibria with the present hydroclimate showed moderate declines in suitability in most mountain ranges and some increases in suitability in high-elevation areas and on equatorward aspects (Figs 3b, S7). An additional 12.5% of known rock glacier locations were considered unsuitable in the present hydroclimate, suggesting that the rock glaciers there are currently in disequilibrium. Simulated changes under the present hydroclimate scenario could be realized as soon as the end of the 21st century but may take longer. In contrast, 99% of habitat that was suitable for rock glaciers under the pre-industrial hydroclimate became unsuitable in equilibria with future hydroclimate (Fig. 3c, Table S3). Remaining habitat under such high-end warming was concentrated at the highest elevations and on northward aspects (Fig. S9). While these projections are dire, equilibration to these conditions would likely be realized over the next several hundred years. These contrasting scenarios illustrate the potential for actions which stabilize climate warming close to current levels to avoid the near complete loss of one element of the mountain cryosphere.
While snow and glaciers are expected to become increasingly focused on north facing slopes with minimal solar radiation (Florentine and others, Reference Florentine, Harper, Fagre, Moore and Peitzsch2018; Barsugli and others, Reference Barsugli2020), rock glacier habitat was predicted to improve on some south-facing slopes with high solar radiation under the present hydroclimate (Figs 4, S7). These sites were also some of the coldest and highest elevation sites. This finding aligns with previous work on current rock glacier distributions that shows that rock glaciers can exist on equatorward aspects with high solar radiation if they are sufficiently cold (Brenning and Trombotto, Reference Brenning and Trombotto2006; Brenning and Azócar, Reference Brenning and Azócar2010). This can be explained by the fact that solar radiation warms the debris surface and the air above the rock glacier, but due to air density differences the warm air is unlikely to infiltrate the debris matrix and thus warming is limited to conduction through the debris matrix, which is minimal (Haeberli and others, Reference Haeberli2006). However, these high-radiation sites only maintained habitat through the present period; under the future scenario, rock glacier habitat became increasingly focused on poleward aspects and at high elevations (Fig. 5, S8), similar to expectations for snow and glaciers.
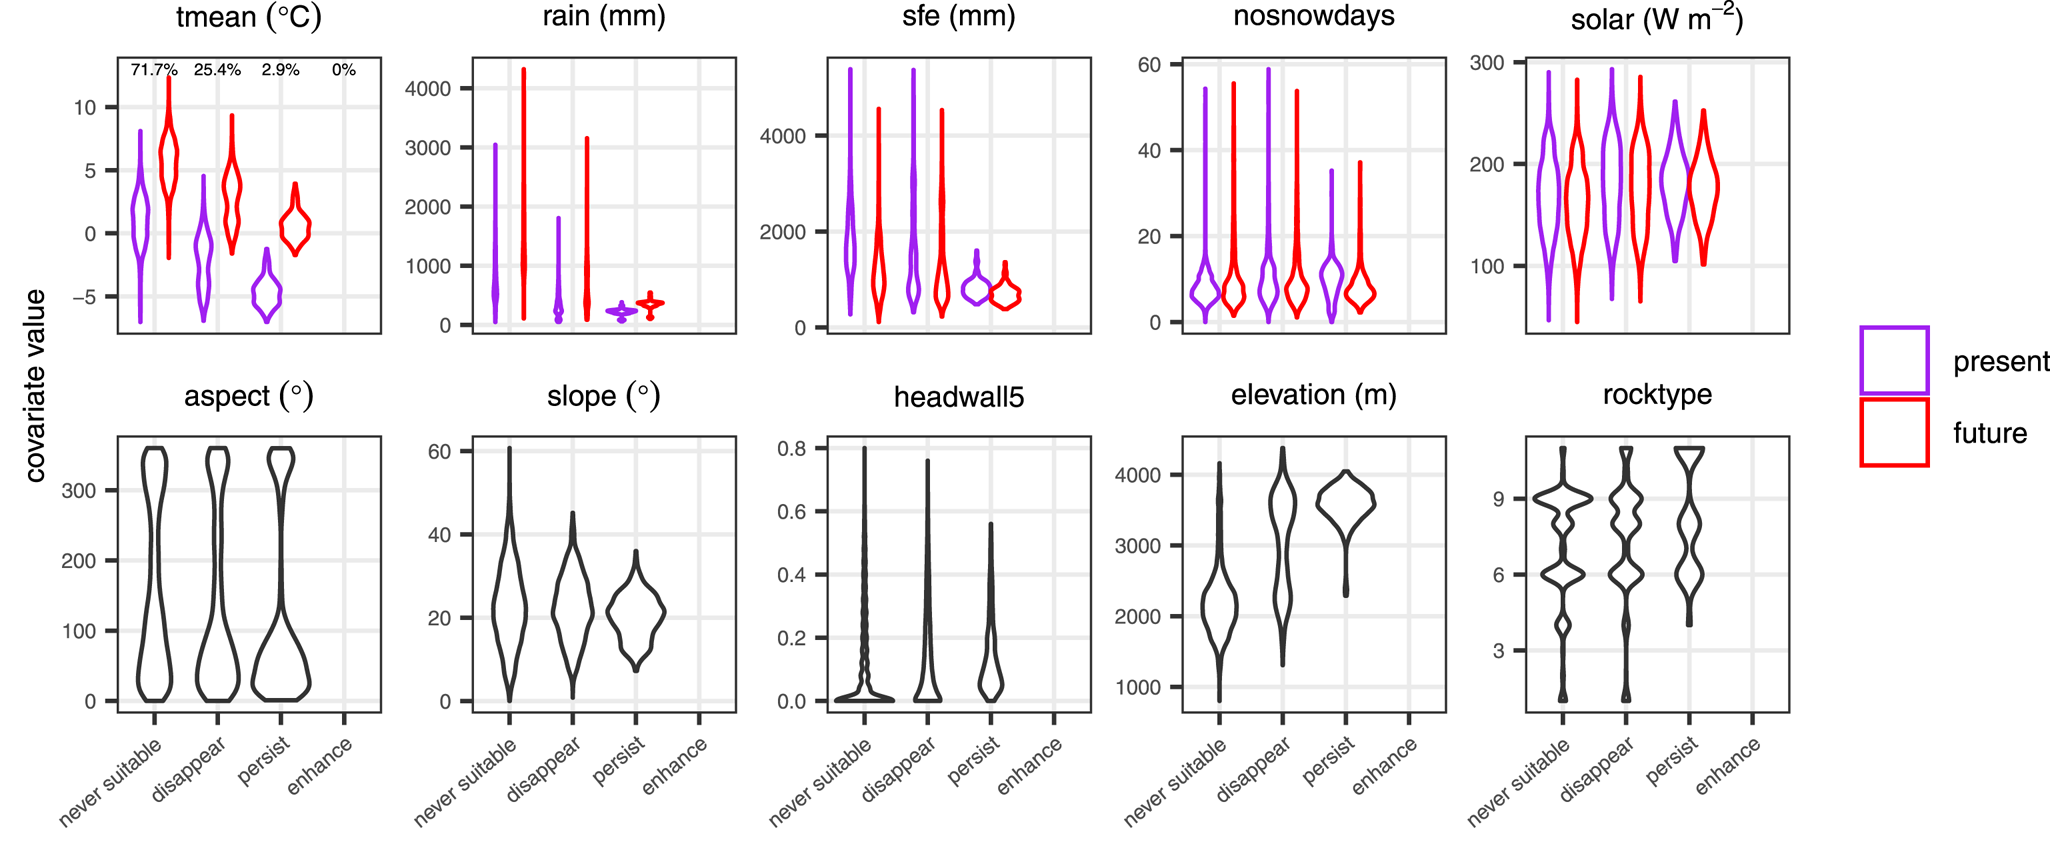
Figure 5. Distribution of covariates between present (purple) and future (red) time periods, for presently glacierized locations, grouped by suitability change category. For covariates that are not time-varying (bottom row), a single violin is shown for each suitability category. In the first subplot, percent values indicate the percent of modeled glacierized area that falls into each category.
Glacier to rock glacier transformation
We found limited potential for glacier to rock glacier transformation in the contiguous western USA. Presently glacierized areas that were suitable for rock glaciers in the present hydroclimate were cold, high-elevation sites that received <1500 mm of sfe (Fig. 4) and were scattered across the southern Sierra Nevada, Middle Rockies and North Cascade mountains. Under the future scenario, presently glacierized areas with suitable rock glacier habitat were largely restricted to the Middle Rockies. Case studies of glacier to rock glacier transformations in the Central Andes showed that this transformation can occur over the course of decades (Monnier and Kinnard, Reference Monnier and Kinnard2015, Reference Monnier and Kinnard2017). Along with other studies, they highlighted the importance of topoclimatic conditions and specifically a reduction in the ratio of ice supply to debris supply (Anderson and others, Reference Anderson, Anderson, Armstrong, Rossi and Crump2018; Knight and others, Reference Knight, Harrison and Jones2019). Glacier ice volume in the western USA has declined and is projected to continue declining through the 21st century (Radić and others, Reference Radić2014; Frans and others, Reference Frans, Istanbulluoglu, Lettenmaier, Fountain and Riedel2018; Rounce and others, Reference Rounce2023). However, the largest glaciers (concentrated in Oregon and Washington) tend to be in locations that receive the most precipitation and snowfall but have the smallest headwall areas, and vice versa. Therefore, we hypothesize that many contiguous western US glaciers in wetter locations will not transition to rock glaciers because the reduction in ice supply necessary to achieve a suitable ice to debris ratio would require a large reduction in the snowfall to rainfall ratio and be associated with a large increase in rainfall, which is unsuitable for rock glaciers. This aligns with work based on observations of currently transitioning landforms, which suggested that debris supply may determine which glaciers transition to rock glaciers and which do not (Jones and others, Reference Jones, Harrison and Anderson2019).
Uncertainties and future work
Sources of uncertainty in our estimates of rock glacier distributions and their environmental controls include the spatial scale of the covariates (especially in the case of terrain metrics; Deng and others, Reference Deng, Wilson and Bauer2007), missing or poorly captured processes such as snow redistribution or rock fracture density (e.g. Molnar and others, Reference Molnar, Anderson and Anderson2007), uncertainties in the downscaled climate data, the model formulation (e.g. beta parameter, feature classes, and covariate selection; Convertino and others, Reference Convertino, Muñoz-Carpena, Chu-Agor, Kiker and Linkov2014), the suitability threshold (Liu and others, Reference Liu, Newell and White2016), and differential response times of rock glaciers to climate forcing due in part to variations in surface debris thickness and internal structure, details which are not considered here (Knight and others, Reference Knight, Harrison and Jones2019). Predicting future rock glacier distributions introduces additional uncertainties regarding the stationarity of modeled relationships between covariates and rock glaciers as well as uncertainties in the future climate data stemming from climate models and scenarios. Specifically, the assumption that current rock glaciers are in equilibria with pre-industrial hydroclimatic conditions may overestimate or underestimate rock glacier decline for rock glaciers that have equilibrated to more or less recent conditions, respectively. Future work should quantify these sources of uncertainty and their effects on predicted rock glacier habitat. While the chosen covariates did an excellent job of predicting current rock glacier habitat in calibration and cross validation, future work could incorporate more process-relevant predictors such as a refined metric of headwall area (Janke and Frauenfelder, Reference Janke and Frauenfelder2008), some measure of fracturing propensity (Chueca, Reference Chueca1992), and a metric of snow redistribution via wind and avalanching (Kenner and Magnusson, Reference Kenner and Magnusson2017). These refinements would likely improve modeled suitability at known rock glacier locations and decrease the modeled overestimation of suitable area.
Conclusions
We employed a species distribution model and process-relevant, high-resolution environmental descriptors across the contiguous western USA to (1) understand the topographic, geologic and hydroclimatic niche of rock glaciers, (2) project how rock glacier spatial distributions may change with continued climate change and (3) evaluate the possibility of glacier to rock glacier transformation. Our model identified mean annual air temperature and headwall area as the dominant controls on rock glacier spatial distributions, with rock glaciers more likely to be found in areas with mean annual temperatures close to −5°C, little rain, northern aspects and broad headwalls. Under a scenario in which rock glaciers equilibrate to the present climate, 12.5% of current rock glacier locations are projected to become unsuitable for rock glaciers while total rock glacier habitat across the domain is projected to decline by 48% relative to the preindustrial period. Equilibration to late 21st-century climate under a high-end warming scenario is projected to result in 94% of current rock glacier locations becoming unsuitable and a 99% reduction in suitable rock glacier habitat across the domain. Under future warming, we find limited potential for glacier to rock glacier transformation (2.9% of glacierized area), concentrated in cold, high elevation, moderate precipitation areas.
The impacts of the loss of active rock glaciers in the contiguous western USA will likely be felt most at local scales and in semi-arid regions. Beyond their intrinsic value as features of the mountain landscape, rock glaciers support greater plant, arthropod and bacterial diversity than nearby landscapes (Franklin, Reference Franklin2012; Millar and others, Reference Millar2015; Fegel and others, Reference Fegel, Baron, Fountain, Johnson and Hall2016) and provide potential climate refugia for pika and cold-adapted fish (Harrington and others, Reference Harrington, Hayashi and Kurylyk2017; Millar and Westfall, Reference Millar and Westfall2019). Equilibration to future hydroclimate, and the transition from active to inactive or relict, may take hundreds of years (Müller and others, Reference Müller, Vieli and Gärtner-Roer2016) during which time rock glaciers may continue to provide these services as well as increased contributions to streamflow in semi-arid watersheds (Wagner and others, Reference Wagner, Pauritsch and Winkler2016; Harrington and others, Reference Harrington, Mozil, Hayashi and Bentley2018; Brighenti and others, Reference Brighenti2019). However, under the high warming scenario considered here, rock glaciers, like snow and glaciers, are likely to eventually disappear from the landscape. In contrast, stabilizing climate at today's temperatures will largely preserve active rock glaciers in this region.
Supplementary material
The supplementary material for this article can be found at https://doi.org/10.1017/jog.2024.56.
Acknowledgments
We appreciate the thorough and insightful comments of Dr Constance Millar and an anonymous reviewer which improved this manuscript. Funding sources include the National Science Foundation's IGERT Program (award 1249400) to A.C.L., USDA-NIFA award (2021-69012-35916) to J.T.A., NASA award (20-2020EPSCoR-0027) to T.C.B. and USFS award (20-CS-11132400-229) to A.G.F.


 Open access