Mexico is a middle-income country that has experienced a nutrition transition characterized by a decrease in the prevalence of different forms of undernutrition, whereas the prevalence of obesity has had one of the world’s largest increases(Reference Kroker-Lobos, Pedroza-Tobias and Pedraza1,Reference Gómez-Dantés, Fullman and Lamadrid-Figueroa2) . For instance, 76 % of women and 69 % of men had overweight or obesity in 2016, while 88 % of women and 65 % of men had abdominal obesity during the same year(Reference Hernández-Ávila, Rivera-Domarco and Shamah3).
Diets high in energy, saturated fat, sodium, refined carbohydrates or added sugars, but low in fruits, vegetables or whole-grain products, are thought to be the leading risk factors for morbidity and mortality from obesity and obesity-related diseases(Reference Lim, Vos and Flaxman4). Previous studies in Mexico indicate that the consumption of energy-containing beverages doubled from 1999 to 2006, whereas in 2012, the contribution of sugar-sweetened beverages and food products high in saturated fat or added sugars to total energy intake was about 10 and 16 %, respectively, in all age groups(Reference Stern, Smith and Zhang5,Reference Aburto, Pedraza and Sanchez-Pimienta6) . However, the approach of analysing single or a few nutrients or foods does not consider the complexity of dietary behaviours, as nutrients and foods are not eaten in isolation(Reference Arvaniti and Panagiotakos7).
Dietary indices, or scores, are the most common approaches to providing an overall rating of an individual’s intake in reference to dietary recommendations used to examine the association between overall diet quality and health outcomes, including manifestation of type 2 diabetes and incidence or mortality due to CVD(Reference Schwingshackl and Hoffmann8–Reference Harmon, Boushey and Shvetsov11). However, only a few studies have analysed the relationship of overall diet quality with BMI or waist circumference (WC), finding inconsistent results(Reference Sundararajan, Campbell and Choi12–Reference Gregory, McCullough and Ramirez-Zea15). Furthermore, there are pre-existing disparities in dietary intakes and obesity by socio-economic status in Mexico. In 2012, fruit and vegetable intake as well as the intakes of saturated fat and added sugars (including sugar-sweetened beverages) were higher among those with high compared with low socio-economic status(Reference Aburto, Pedraza and Sanchez-Pimienta6,Reference López-Olmedo, Carriquiry and Rodríguez-Ramírez16) . Likewise, the prevalence of obesity was higher in adults with higher socio-economic status(Reference Pedroza-Tobías and Rivera-Dommarco17). Nevertheless, it has not been explored whether the association of diet quality with BMI and WC differs by socio-economic status. Therefore, it is relevant to understand what role education level, a proxy of socio-economic status, plays in the relationship of diet quality with BMI and WC. Finally, the relationship of diet quality with BMI and WC stratified by sex has been barely studied, despite previous evidence showing that women may be more concerned with the quality of food(Reference Arganini, Saba, Comitato and Maddock18) and health consciousness might vary by education level(Reference Vogel, Lewis and Ntani19). Furthermore, in obesity research as well as in all biomedical research, it is recognized that weight gain as well as adipose tissue storage and metabolism may vary by sex(Reference Lovejoy and Sainsbury20–Reference Whitaker, Choh and Lee22). In the present paper, we examine the association of diet quality with BMI and WC, overall and by education level, among Mexican men and women. The paper uses two different dietary quality indices: one based on the Mexican Dietary Guidelines (MxDG) and the other on foods and nutrients associated with cardiometabolic risk. The latter, the Alternate Healthy Eating Index (AHEI), is the only diet quality index validated against many different non-communicable diseases(Reference Chiuve, Fung and Rimm23).
Methods
Study design and population
We used data from the National Health and Nutrition Survey (ENSANUT; from its Spanish acronym, Encuesta Nacional de Salud y Nutrición) 2012. We obtained information about sociodemographic characteristics, nutrition and health of 96 031 people from 50 528 randomly selected households. Dietary collection and assessment have been described elsewhere, but in brief, we collected dietary information in a random sub-sample (n 10 886) representing the national, regional (North/Central/South) and urban/rural population(Reference Gutiérrez, Rivera-Domarco and Shamah-Levy24). We used the 24 h dietary recall developed by the US Department of Agriculture, adapting it to the Mexican context(Reference Conway, Ingwersen and Vinyard25,Reference Blanton, Moshfegh and Baer26) . We calculated energy and nutrient intakes using the food composition database compiled by the National Institute of Public Health(27–Reference Villalpando, Ramírez-Silva and Bernal Medina30).
We included non-pregnant and non-lactating adults aged 20–69 years with dietary information (n 2676). We excluded those without weight, height or WC measurements (n 107), without information on type 2 diabetes or smoking status (n 282), and without information on parity (n 3). Moreover, adults classified as underweight (BMI < 18·5 kg/m2) were excluded (n 28). Although there is no established definition of low WC, we also decided to exclude men and women if their WC was ≤65 and ≤55 cm, respectively (n 4). Finally, we excluded those with a ratio of total energy intake to estimated energy requirement (in logarithmic scale) below −3 sd and above +3 sd (n 30), as previously described(Reference López-Olmedo, Carriquiry and Rodríguez-Ramírez16). Some individuals were excluded for two or more variables; therefore, the total number of excluded participants does not equal the sum of all the excluded participants by variable. The analytic sample was composed of 2310 adults.
Variable definitions
BMI and waist circumference
Body weight was measured with light clothing using digital scales (model 872, Seca) with 0·1 kg precision and height using stadiometers (Dyna-top, model E-1, Mexico) with 0·1 cm precision. WC was measured using a fibreglass tape at the midpoint between the highest part of the iliac crest and the lowest part of the ribs’ margin of the median axial line(31). Trained personnel took the measurements using standard procedures(Reference Lohman, Roche and Martorell32,Reference Habicht33) . We calculated BMI using the standard equation and categorized it based on WHO definitions(34). Men and women with a WC of ≥90 and ≥80 cm, respectively, were also categorized as having abdominal obesity, using as reference the classification by the International Diabetes Federation(Reference Alberti, Eckel and Grundy35).
Mexican Diet Quality Index
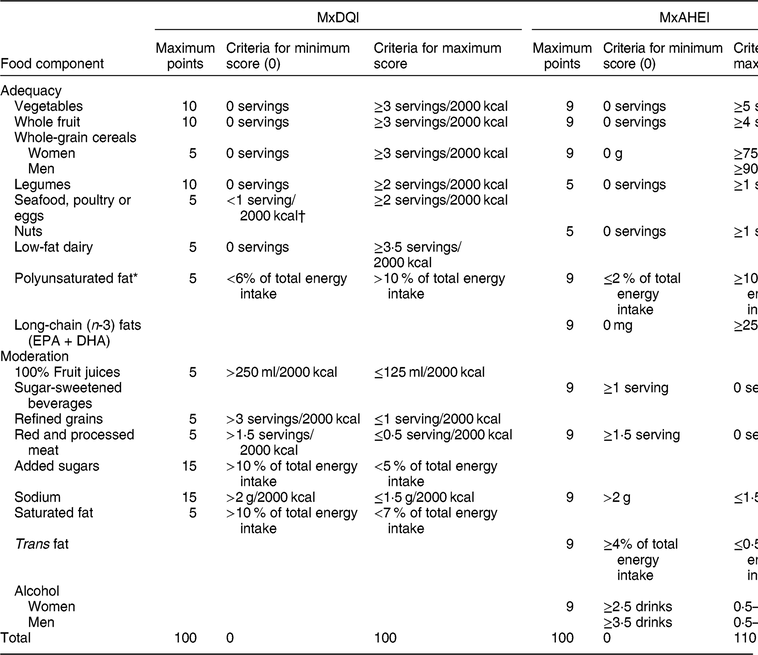
We developed the Mexican Diet Quality Index (MxDQI) based on the MxDG, which were published in 2015(Reference Bonvecchio-Arenas, Fernández-Gaxiola and Plazas-Belusteguigoitia36). These guidelines recommend the number and size of servings for nine food groups, by age group and by total energy intake. We used the number of servings recommended for adults with a total energy intake of 8368 kJ/d (2000 kcal/d) as reference (for more details see the online supplementary material, Supplemental Table 1). We created thirteen MxDQI components based on all food groups except tap water, because the MxDG include only a suggested range of water consumption since water needs can vary by age, physical activity and weather (Table 1). Rather than number of servings, we used cut-off points recommended by the WHO, as well as recommendations for fat intake for the Mexican population, to define minimum and maximum scores for polyunsaturated fat, saturated fat and added sugars(Reference Bourges, Casanueva and Rosado37–39). Finally, we considered sodium intake as an MxDQI component because the MxDG, consistent with international guidelines, recommend consuming no more than 2000 mg Na/d. The minimum score for sodium was based on the results of systematic reviews and meta-analyses(Reference Micha, Shulkin and Peñalvo40). We defined scores between 0 (non-compliance) and 15 (intakes close to recommended) for each component. Specifically, we assigned a maximum score of 5 to those MxDQI components derived from the same food group (e.g. whole-grain and refined-grain cereals). We also assigned the added sugars and sodium components a maximum score of 15, given their high consumption in the Mexican population and therefore their potential impact on health (Table 1)(Reference Sánchez-Pimienta, Batis and Lutter41,Reference Vallejo, Colin-Ramirez and Rivera Mancia42) .
Table 1 Mexican Diet Quality Index (MxDQI) and Mexican Alternate Healthy Eating Index (MxAHEI) components and criteria for scoring
* This dietary component in MxAHEI does not include long-chain (n-3) fats (EPA + DHA).
† 2000 kcal = 8368 kJ.
Mexican Alternate Healthy Eating Index
The AHEI includes twelve components scored from 0 (worst) to 5 or 10 (best), and the total AHEI-2010 score ranges from 0 (non-adherence) to 110 (perfect adherence)(Reference Chiuve, Fung and Rimm23). For developing the Mexican Alternate Healthy Eating Index (MxAHEI), we used the original AHEI-2010 criteria for minimum and maximum score, except for sodium. We considered the same sodium criteria as for the MxDQI, since the cut-offs for sodium in AHEI-2010 were based on deciles of distribution in the population(Reference Chiuve, Fung and Rimm23). Furthermore, we based serving sizes on the Mexican System of Food Equivalents(Reference Pérez-Lizaur43). We scaled up the MxAHEI to 100 for comparisons with MxDQI (Table 1).
Covariates
The ENSANUT 2012 captured several variables through questionnaire; for our analysis, we considered education level, type 2 diabetes status, age, sex, parity, area and region of residence, assets index, type of housing, number of individuals in a household, marital status, smoking status and physical activity. We defined education level as no reading/writing skills, reading/writing skills or 3–9 years of school (elementary and middle school) and ≥10 years of school (high school or more), based on the reported grade completed and whether participants knew how to read and write. We selected these categories based on studies about the social and economic impact of illiteracy (including individuals with ≤2 years of elementary school) in Latin American and Caribbean regions(Reference Martínez and Fernández44,Reference Robles and Navarro45) . The categorization of type 2 diabetes status (yes/no) was based on previous diagnosis by a doctor. We classified parity as none, 1–2, 3–4 and ≥5 pregnancies. Likewise, we categorized locations with <2500 inhabitants as rural and locations with ≥2500 inhabitants as urban, and we defined regions as North, Central and South.Footnote * An assets index was constructed using factor analysis, where factor scores were estimated using a principal components approach, applied to household characteristics and assets(Reference Gutiérrez46). The index score was computed for each respondent and respondents were then classified into three categories (low, medium and high) using tertiles of the distribution of the assets index scores as cut-off points. Other variables were categorized as follows: type of housing as owned, rented or other (individuals occupied the property in another situation not specified); number of individuals in a household as 1–2, 3–4 or ≥5; and marital status as married/living together, divorced/separated/widowed or single. We categorized smoking status as current, former and never based on the questions: (i) ‘Have you ever smoked at least one hundred cigarettes (5 packs) in your life?’ and (ii) ‘How many cigarettes you are smoking currently?’ (possible answers: ‘I am not currently smoking’ or number and frequency). Finally, we assessed physical activity using the Spanish short version of the International Physical Activity Questionnaire and classified it based on WHO recommendations(Reference Medina, Janssen and Campos47).
Statistical analysis
We conducted all analyses using the statistical software package Stata version 14.0 (2015). We used survey commands to account for survey design and weighting to generate nationally representative results. Statistical tests were two-tailed and considered significant at P < 0·05. We examined characteristics of anthropometric measurements, total diet scores, sociodemographic variables and lifestyle behaviours by sex and education level. We first performed sex-specific multivariable linear regression models for testing the statistically significant associations of MxDQI and MxAHEI scores, total and by component, with BMI and WC, adjusting for age (quadratic), total energy intake, smoking status, type 2 diabetes status, parity, area and region of residence, tertile of assets index, type of housing, number of individuals in a household, marital status and education level. Furthermore, we adjusted MxDQI models for alcohol intake. Models including dietary components as outcome variables were also adjusted for the other dietary components to account for the potential correlation among all components. To test whether the association of diet quality with BMI and WC was different for individuals with different education levels, we performed models that included interaction terms between diet score and the three defined levels of education. We performed global Wald tests to determine whether any diet score coefficients differed across the three education levels in men and women.
Sensitivity analyses
We did not include physical activity in the main analyses due to the poor validity of the International Physical Activity Questionnaire short form for assessing moderate-to-vigorous physical activity among Mexican adults(Reference Medina, Barquera and Janssen48). However, physical activity could be an important confounder of the relationship between diet quality and anthropometry. Thus, we conducted sensitivity analyses to test whether the inclusion of crude physical activity data in models altered the associations of dietary indices with BMI and WC. Second, we conducted analyses in which corn tortilla was treated as a refined grain instead of a whole grain, since it is uncertain whether all corn tortillas are made with whole grains. Third, a set of sensitivity analyses focused on different approaches for examining the association of dietary components with BMI and WC. We tested two additional types of models, models that were not adjusted for other dietary components and models that adjusted for total score minus the dietary component of interest, to assess whether estimations were different from those obtained when adjusting for the other dietary components.
Results
Overall, the prevalence of overweight was slightly lower in women than in men, but the prevalence of obesity and abdominal obesity was higher in women than in men, as observed in the entire ENSANUT 2012 sample. Moreover, the mean of total MxDQI and MxAHEI score was about 40 in men and women; however, the total dietary scores were higher in men and women with the lowest education level. A higher proportion of men and women with low education level met the scoring criteria of several dietary components, including whole-grain cereals, legumes, red and processed meat, and saturated fat (Table 2).
Table 2 Characteristics of Mexican men and women by education level. ENSANUT 2012 (n 2310)
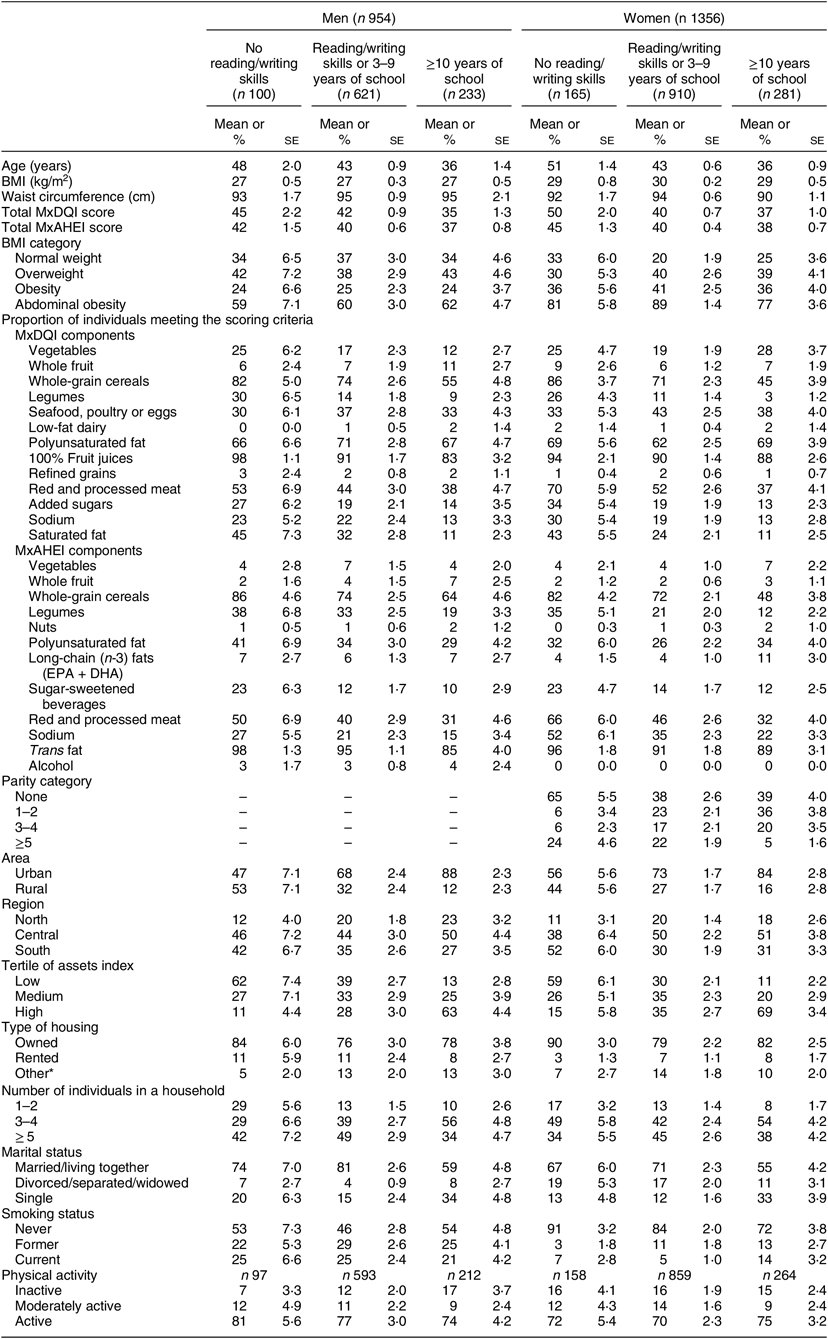
ENSANUT, National Health and Nutrition Survey, MxDQI, Mexican Diet Quality Index, MxAHEI, Mexican Alternate Healthy Eating Index. Data for age, BMI, waist circumference, total MxDQI score and total MxAHEI score are presented as mean and se; all other data are presented as % and se.
* They occupied the property in another situation not specified.
Association of MxDQI and MxAHEI with BMI in men and women
The total MxDQI score was not associated with BMI among men and women. However, the vegetables as well as the seafood, poultry or eggs components were inversely associated with BMI in men. Likewise, the total MxAHEI score was not associated with BMI in both men and women. Nevertheless, the red and processed meat component was inversely associated with BMI among men, whereas the alcohol component was positively associated with BMI in women (Table 3).
Table 3 Association of Mexican Diet Quality Index (MxDQI) and Mexican Alternate Healthy Eating Index (MxAHEI) with BMI in men and women. ENSANUT 2012 (n 2310)
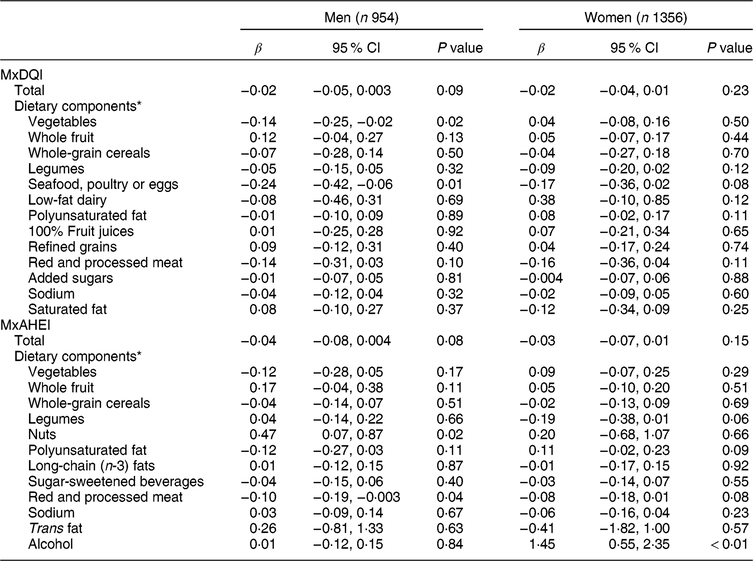
ENSANUT, National Health and Nutrition Survey.
* Adjusted for the other dietary components.
Association of MxDQI and MxAHEI with waist circumference in men and women
Among men, a one-unit increase in total MxDQI and total MxAHEI scores was associated with a reduction in WC of 0·10 (95 % CI 0·004, 0·20) cm and 0·15 (95 % CI 0·01, 0·28) cm, respectively. With regard to specific components, we observed that seafood, poultry or eggs as well as red and processed meat components were inversely associated with WC. In women, dietary scores were not associated with WC (Table 4).
Table 4 Association of total Mexican Diet Quality Index (MxDQI) and Mexican Alternate Healthy Eating Index (MxAHEI) with waist circumference in men and women. ENSANUT 2012 (n 2310)
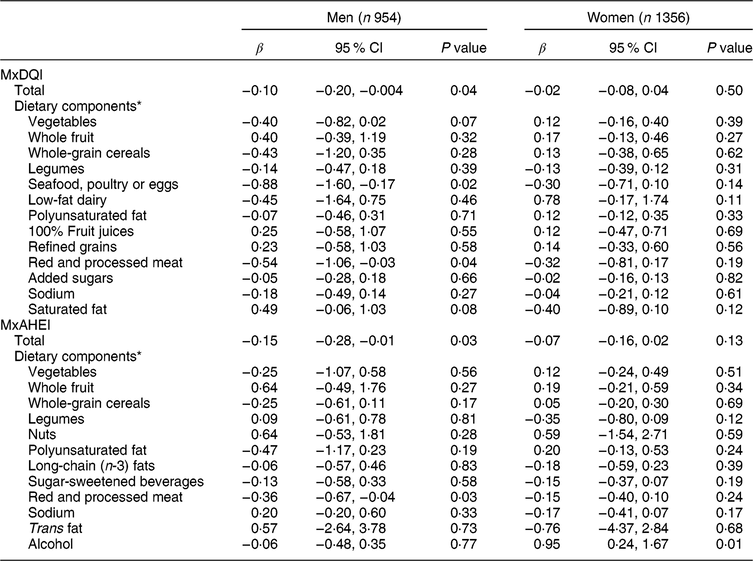
ENSANUT, National Health and Nutrition Survey.
* Adjusted for the other dietary components.
Association of MxDQI and MxAHEI with BMI by education level in men and women
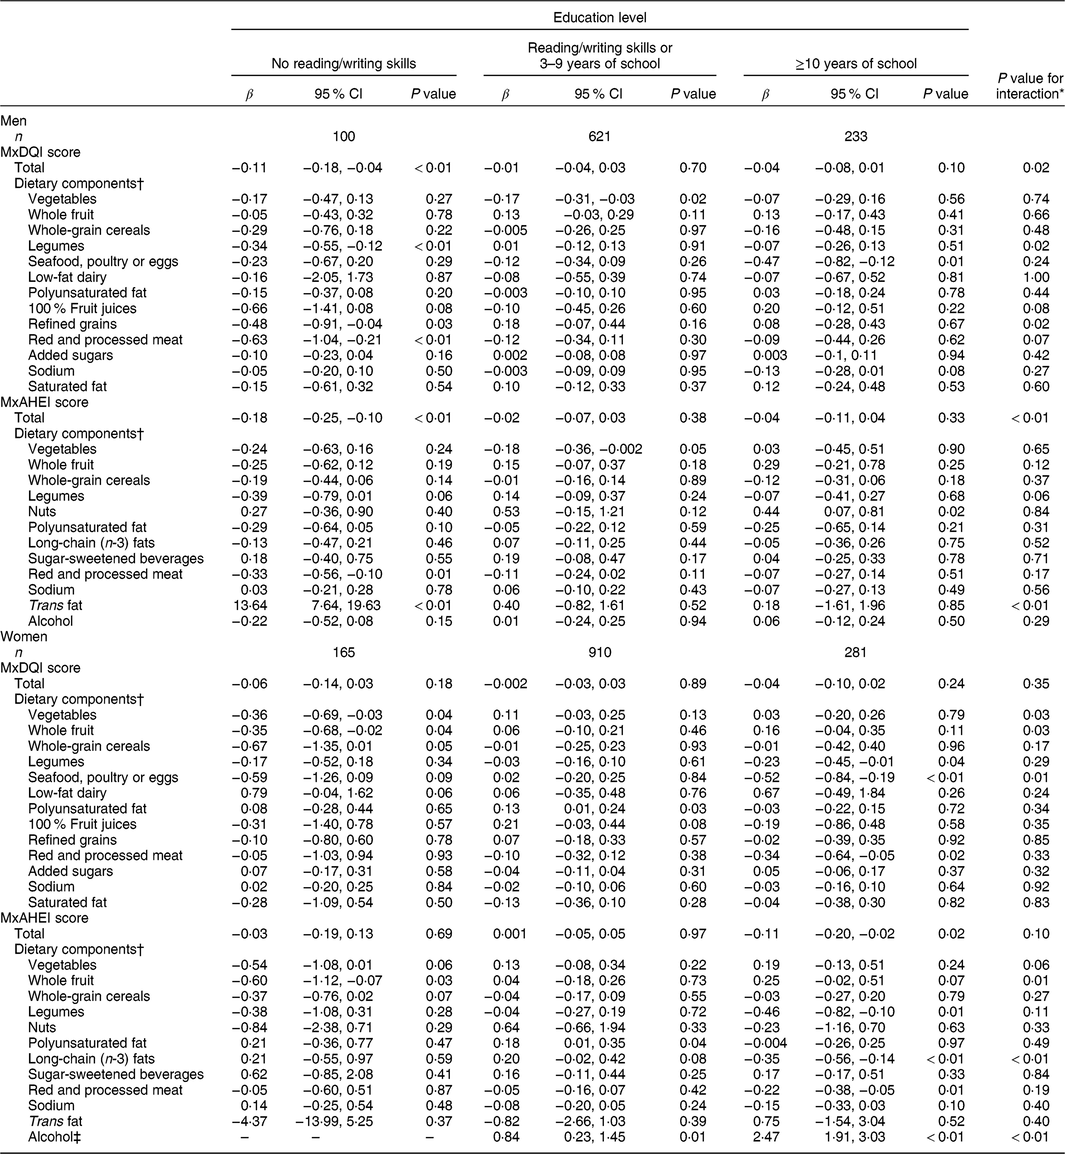
We found that the association of total MxDQI and total MxAHEI scores with BMI was different by education level in men (P for interaction < 0·05). A one-unit increase in total MxDQI and total MxAHEI scores was associated with a mean reduction in BMI of 0·11 (95 % CI 0·04, 0·18) kg/m2 and 0·18 (95 % CI 0·10, 0·25) kg/m2, respectively, for men with the lowest level of education. There was no association between the dietary scores and BMI for higher-educated men. With regard to components, we observed that the legumes and refined grains components were inversely associated with BMI in men with lowest education level (P for interaction < 0·05; Table 5).
Table 5 Association of Mexican Diet Quality Index (MxDQI) and Mexican Alternate Healthy Eating Index (MxAHEI) with BMI in men and women by education level. ENSANUT 2012 (n 2310)
ENSANUT, National Health and Nutrition Survey.
* The P value for interaction represents the statistical significance of the interaction term to test whether the association between diet quality and BMI is different for low- v. high-educated individuals.
† Adjusted for the other dietary components.
‡ Blank cells indicate variable was omitted from model.
In women, the association of total MxDQI score with BMI was not different by education level. However, vegetables, whole fruit, as well as seafood, poultry or eggs components were inversely associated with BMI in women with no reading/writing skills (P for interaction < 0·05). Likewise, the association between total MxAHEI score and BMI was not different by education level. Nevertheless, the whole fruit component was inversely associated with BMI among women with the lowest education level, and the long-chain (n-3) fats component was inversely associated with BMI in women with ≥10 years of school (Table 5).
Association of MxDQI and MxAHEI with waist circumference by education level in men and women
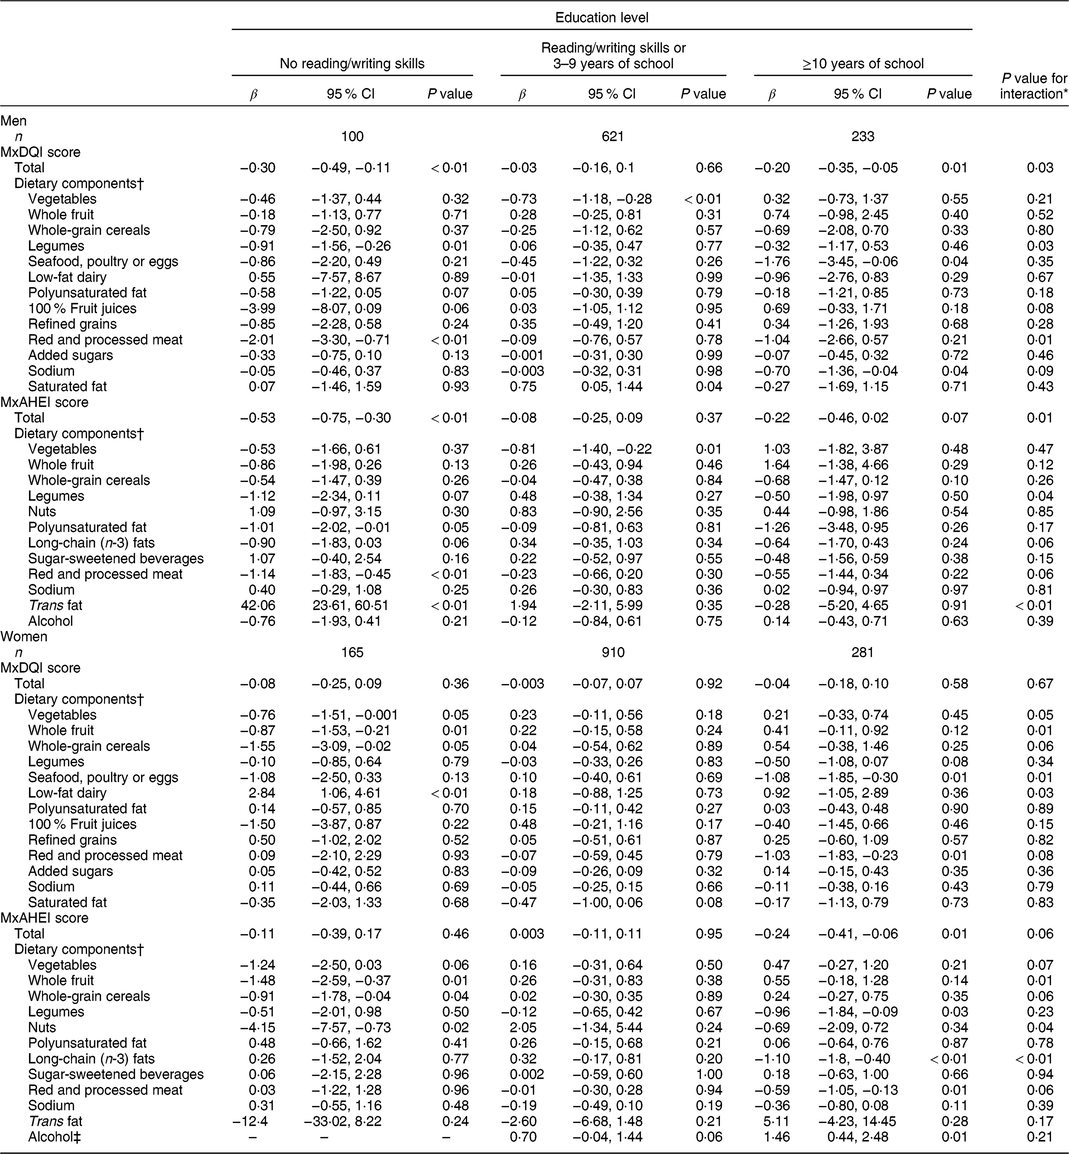
As observed for BMI, the association between total MxDQI score and WC was different by education level in men (P for interaction < 0·05). The total MxDQI score was inversely associated with BMI in men with the lowest and highest education level (P < 0·05). Among specific components, legumes as well as red and processed meat MxDQI components were inversely associated with WC among men with no reading/writing skills (P for interaction < 0·05). Likewise, the association between total MxAHEI and WC was different by education level (P for interaction < 0·05). The total MxAHEI score was inversely associated with WC in men with no reading/writing skills. The red and processed meat MxAHEI component was inversely associated with WC in men with lowest education level (P for interaction < 0·05; Table 6).
Table 6 Association of Mexican Diet Quality Index (MxDQI) and Mexican Alternate Healthy Eating Index (MxAHEI) with waist circumference in men and women by education level. ENSANUT 2012 (n 2310)
ENSANUT, National Health and Nutrition Survey.
* The P value for interaction represents the statistical significance of the interaction term to test whether the association between diet quality and waist circumference is different for low- v. high-educated individuals.
† Adjusted for the other dietary components.
‡ Blank cells indicate variable was omitted from model.
The association between total MxDQI score and WC in women was not different by education level. However, the whole fruit component was inversely associated with WC among women with no reading/writing skills, whereas the seafood, poultry or eggs component was inversely associated with WC among women with ≥10 years of school (P for interaction < 0·05). Likewise, we observed that whole fruit and nuts MxAHEI components were inversely associated with WC in women with the lowest education level, while the long-chain (n-3) fats component was inversely associated with WC among women with ≥ 10 years of school (Table 6).
Results of sensitivity analyses
Estimated associations of total MxDQI and MxAHEI scores with BMI and WC were similar to those observed when total MxDQI and MxAHEI models were further adjusted for physical activity. However, when physical activity was included as covariate, the associations between dietary scores and WC were no longer statistically significant in men, whereas in women these associations were statistically significant in the MxAHEI models (see online supplementary material, Supplemental Table 2). Likewise, estimated associations of total MxDQI and MxAHEI scores with BMI and WC were similar to those observed when corn tortilla was considered as refined instead of whole grain (Supplemental Table 2). The whole-grain cereals MxDQI component was positively associated with BMI in men, whereas the refined grain MxDQI component was positively associated with BMI in women when corn tortilla was considered as refined grain (Supplemental Table 3). Supplemental Tables 4–7 present the results of testing the association of diet quality scores with BMI and WC without adjusting for the other dietary components and adjusting for total scores minus the dietary component of interest, which were similar to those obtained using models adjusted for the other dietary components.
Discussion
To our best knowledge, the present study is the first that examines the association of diet quality with BMI and WC using two different dietary quality scores, one based on the most recent MxDG and the other on foods and nutrients associated with cardiometabolic risk. We found that both total dietary quality scores were not associated with BMI in men and women. However, some dietary components were inversely associated with BMI, including the vegetables and seafood, poultry or eggs MxDQI components, as well as the red and processed meat MxAHEI component in men. We also observed that the total dietary scores were inversely associated with WC in men, but not in women. We specifically found that the seafood, poultry or eggs as well as red and processed meat components were inversely associated with WC in men.
The present study is also one of the first to examine the association of diet quality with BMI and WC by education level, which we considered relevant as a first exploration given the disparities in dietary intakes and obesity prevalence by socio-economic status already documented in Mexican adults. We found that for men with the least education, total high diet quality was associated with lower BMI and WC. In contrast, there was no association between total diet quality and BMI or WC in higher-educated men.
It is not clear from the current study why better total diet quality predicts lower BMI and WC for lower-educated but not higher-educated men. Several studies have found that individuals with lower socio-economic status more frequently undertake behaviours that could be detrimental to health than those of higher socio-economic status, such as low physical activity, smoking or poor sleep duration(Reference Pampel, Krueger and Denney49,Reference Pepper, Nettle, Gibson and Lawson50) . Thus, one possibility is that improvements in diet quality offset the association of these other behaviours with health in low-educated men. A second possibility might be that for low-educated men, diet quality is a proxy for better health behaviour overall; men who seek out healthy diets despite the norm may also be more likely to engage in other health-promoting behaviours, and this combined behaviour leads to better weight outcomes. A third possibility relates more specifically to the role of physical activity: men with less education may have jobs that are more physically demanding in comparison to higher-educated men; higher diet quality scores together with higher work-related physical activity could be associated with a reduction of BMI and WC. Previous studies in low- and middle-income countries have found that individuals with less education were more active than groups with more education(Reference Allen, Williams and Townsend51) and occupational activity has been found to be one of the major contributors to the intensity of overall physical activity(Reference Chen, Wu and Narimatsu52). Unfortunately, we were unable to include physical activity in the main analyses due to the poor validity of the International Physical Activity Questionnaire short form in Mexican adults(Reference Medina, Barquera and Janssen48), so we were able to examine only crude physical activity in our models. More research is needed to understand how diet interacts with other key lifestyle components, such as physical activity, sedentary activity, occupation and sleep duration, to understand the pathway between diet and obesity across the population.
In our primary models, the association of total MxDQI and MxAHEI scores with BMI and WC was not different by education level in women, but the pattern of the associations tended to be the opposite than in men. We found a statistically significant association of total MxAHEI score with BMI and WC in women with ≥10 years of education. Although associations were not statistically significant in women with lower education levels, BMI and WC estimations were in the same direction as those observed in higher-educated women. Sex differences in associations between risk factors and obesity have been reported elsewhere, and several explanations have been proposed given the complexity of the subject matter, including differences in the duration and intensity of occupational physical activity. Studies suggest that higher-educated women could have higher physical activity levels than lower-educated women, which in turn can be associated with lower BMI or WC if women improve the quality of their diet(Reference Smith, Ng and Popkin53,Reference Vargas, Merino and Hernández54) . One of the potential reasons why we did not find different results by education may be because lower-educated women could also have levels of housework-related physical activity that interact with diet to reduce BMI and WC, but not enough to find statistically significant associations. However, the association between total MxAHEI score and WC differed by education in women after adjusting for physical activity. Future research using valid measurements of physical activity will be needed to understand how diet might interact with physical activity in women.
We specifically observed that the association of different dietary components with BMI or WC was different by education level in men and women. Higher consumption of legumes and lower intakes of refined grains and red and processed meat were inversely associated with BMI or WC among men with the lowest education level, whereas among women in the same level of education as men, a higher consumption of fruit and vegetables was associated with low BMI or WC. A potential explanation of these results is the heterogeneity in the consumption of dietary components among men and women. Given the truncated nature of the diet quality indices, it is possible that, for instance, the consumption of fruit and vegetables was even higher in women than in men, and therefore associated with lower BMI or WC, even though the proportion of individuals who met the scoring criteria of each one of the dietary components was similar between men and women by education level. Another possible reason for the differences by sex is that women and men completed the 24 h dietary recall differently, potentially resulting in different measurement error. Furthermore, we found that different dietary components were associated with BMI and WC. For instance, red and processed meat, in both MxDQI and MxAHEI, was consistently associated with WC but not with BMI. Similar results were observed in a previous study in Iranian adults(Reference Dabbagh-Moghadam, Mozaffari-Khosravi and Nasiri55). Therefore, it is possible that the WC measure is more sensitive to the changes in some dietary factors, compared with other measures of general obesity such as BMI.
Limitations
It is important to acknowledge the limitations of our study. First, the potential reverse causal link between diet quality and obesity cannot be dismissed, given the nature of the cross-sectional study design. Second, the current study was based on a single 24 h recall, which does not allow between- and within-person variability to be distinguished, and therefore usual intake cannot be estimated. Specifically, episodically consumed dietary components, such as alcohol, could be misrepresented and this might be why we were unable to find consistent associations of dietary quality with BMI and WC. Despite the limitation of using this method, some cross-sectional studies have found associations between diet quality and health outcomes using a single 24 h recall(Reference Sundararajan, Campbell and Choi12,Reference Tande, Magel and Strand56,Reference Guo, Warden and Paeratakul57) , which may indicate that some food components and weights were not the most adequate to estimate the diet quality in Mexican adults. For instance, it could be useful to categorize tortillas as cooked and fried, since both types of tortilla can be highly consumed but their associations with BMI and WC may be opposite. Therefore, future direction should include the modifications of these indices or the creation of other indices that better reflect changes in BMI and WC in Mexican adults. The FFQ could provide a better estimation of usual intakes and therefore of usual diet quality. However, the FFQ used in ENSANUT was too aggregated and would result in misclassification because many details of dietary intake were not measured, and the quantification of intake was not as accurate as with 24 h dietary recalls. Recent studies have shown that the combined use of multiple 24 h dietary recalls and FFQ provides data superior to use of either method alone(Reference Carroll, Midthune and Subar58–Reference Freedman, Midthune and Arab60), but this was not possible for the present study since these two dietary methods were collected in different sub-samples. Therefore, we recommend the collection in the future of both dietary instruments in the same sub-sample for a better estimation of the usual diet quality index. Finally, we selected education level as the measure of socio-economic status, rather than occupation or income. Education level can determine the occupation, and education level and occupation are jointly associated with income level(Reference Galobardes, Morabia and Bernstein61). However, these three proxies of socio-economic status could also have an independent role in predicting health-related behaviours. We considered it inappropriate to analyse occupation because of the complexity of understanding the potential sex differences, since 78 % of men reported they had paid work the week prior to the interview, whereas 62 % of women reported unpaid work in the same period. Moreover, income was measured using an open-ended question. Income is more difficult to estimate in low- to middle-income countries because of greater reliance on the informal economy and self-employment(Reference Howe, Galobardes and Matijasevich62). However, we used an asset-based household index as a control variable in our models. This index has been recommended by economists as a key proxy of household income, especially in low- to middle-income countries, including Mexico(Reference Howe, Galobardes and Matijasevich62,Reference Rutstein and Johnson63) . Despite the limitations, the results presented provide an overview of how diet quality is associated with BMI and WC and how these associations can be potentially different by education level in a representative sample of Mexican men and women, which offers insights for understanding diet–health outcome disparities in Mexico.
Conclusion
Results show total dietary quality scores were not associated with BMI in men and women, whereas the MxAHEI score was inversely with WC in men but not in women. Furthermore, the association of total MxDQI and MxAHEI scores with BMI and WC was different by education level in Mexican men. In Mexican women, the association of diet quality scores with BMI and WC did not differ by education. These results provide insights when implementing public actions that prevent or ameliorate the high prevalence of obesity in Mexican adults, considering the potential differences by sex and education.
Acknowledgements
Acknowledgements: The authors thank Dr Phil Bardsley for exceptional assistance with the data management, Ms Emily Ford Yoon and Ms Frances Dancy Burton for administrative assistance, and Ms Denise Ammons for graphics support. Financial support: This work was funded primarily by Bloomberg Philanthropies (grants to the University of North Carolina and Centro de Investigación en Nutrición y Salud, Instituto Nacional de Salud Pública), with support from the National Institutes of Health (NIH; grant number R01DK108148), the Robert Wood Johnson Foundation (grant number 71698), and the Carolina Population Center and its NIH Center grant (grant number P2C HD050924). N.L.-O. is supported by a Mexican National Council for Science and Technology (CONACyT) scholarship. Funders had no role in the design, analysis or writing of this article. Conflict of interest: None. Authorship: N.L.-O., B.M.P. and L.S.T. were responsible for study design, results interpretation and writing the manuscript. N.L.-O. was responsible for performing statistical analysis and drafting and editing of the manuscript. All authors contributed to study design and critical revision of the manuscript. All authors approved the final manuscript. Ethics of human subject participation: This study was conducted according to the guidelines laid down in the Declaration of Helsinki and all procedures involving human subjects were approved by the Ethics Committee of the Mexican National Institute of Public Health. Written informed consent was obtained from all subjects under study.
Supplementary material
To view supplementary material for this article, please visit https://doi.org/10.1017/S136898001900065X


