In 1823, at the nadir of the first major downturn in the cotton market, cotton was selling at less than 10 cents a pound in South Carolina, then the center of cotton cultivation in the United States. Hezekiah Niles, editor of Niles’ Register, a leading business paper of the day, had predicted that cultivation would be reduced when the price fell beneath 10 cents, for at any lower price cotton would be “unworthy of the attention of the capitalist, if he has the power to turn his capital to almost anything else” (Niles Reference Niles1822: 216). Yet the price stayed below 10 cents a pound for most of the remaining years before the Civil War, and South Carolina steadily increased its cotton cultivation in those four decades.
In 1841, in the midst of the next major cotton downturn, with South Carolina facing stiff competition from the new cotton states of the Southwest, Governor J. H. Hammond reported his calculations of the cost of cotton production to the State Agricultural Society. In his address, Hammond recommended that South Carolina planters switch to growing food, for he claimed that “cotton cannot be profitably grown here at 8 cents per lb.” (Hammond Reference Hammond1841: 180). Yet the price remained below 8 cents for all but one year of the 1840s, and cotton production in South Carolina almost doubled over that time.
That the lower prices resulted in South Carolina planters producing more rather than less cotton not only presents a puzzle for standard economic theory, but may also come as a surprise to those familiar with the literature on the history of American slavery. Writing in the 1960s, both the Marxist historian Eugene Genovese (Reference Genovese1965: 298) and the neoclassical economist Douglass North (Reference North1966: 72, 129–30) described how planters in the Old South withdrew from the market when prices fell, planting less cotton and more subsistence crops, much as Hammond had recommended. For Genovese (Reference Genovese1965: 19–23) this was a symptom of the South's “precapitalist” mode of production. He argued that the planters’ quasifeudal values of landed independence encouraged them to insulate themselves from the market (ibid.: 31, xxiii). For North (Reference North1966: 71), by contrast, it was simply a “rational redirection of resources during periods of depressed prices.” Yet the evidence from South Carolina suggests that both authors were mistaken, for planters there increased their production of cotton as prices fell, a behavior that economists sometimes refer to as “perverse supply response” (Ozanne Reference Ozanne1999).
In this article, I attribute this “perversity” to an effect of credit markets and debt enforcement on, first, the choice of crop, and second, the productivity of plantations. I focus on the depression of the 1840s, when new Southwestern supplies kept cotton prices low, wiping out profit margins for many South Carolina plantations. Although the price of corn also fell during this period, planters could still have saved on food purchases by planting more subsistence crops, as Hammond had advised. However, most plantations purchased their inputs on credit, and many had accumulated long-term debt by mortgaging land and slaves. The need to repay these debts prevented plantations from taking up Hammond's advice and becoming more self-sufficient, for as prices fell they had to plant more of the cash crop to meet these fixed monetary commitments.Footnote 1
I argue that cotton specialization was a short-term solution to a problem of cash flows, but a virtual doubling of cotton output over a decade cannot be attributed to specialization alone. Instead, I argue that in the long run more cotton was grown, despite continued low prices, because South Carolina plantations were ultimately able to recover their profit margins by increasing productivity—through introducing new techniques and varieties, and expanding their scale of operations. Despite their “premodern” sympathies, South Carolina slave owners responded to competition in a quintessentially capitalist manner—by specialization, innovation, and adaptation—because they were dependent on credit, and therefore on markets, to preserve their status as slave owners. I refer to the pressures generated by debt and its enforcement as “credit market discipline.”
The article proceeds as follows. In the next section, I review the literature on economic growth under slavery, relating my findings to new developments in the field. I then define credit market discipline and identify its key historical precondition: the ability of creditors to seize the assets of insolvent debtors. I provide evidence, in the third section, of the buildup of debt in South Carolina and the wave of foreclosures that swept the state in the 1840s. In section five, I trace the impact of this crisis on cotton production in South Carolina. I then briefly contrast South Carolina with Kentucky, where I claim that a legacy of debt relief helped to insulate slave owners from credit market discipline. Finally, I conclude by relating my findings to debates on the capitalist nature of antebellum slavery.
Reviewing the Literature on Slavery and Capitalism
Early studies of the slave plantation assumed that it changed little over time. The typical explanation was that slave owners valued independence over profitability, and that slaves had no incentive to work hard or innovate (Cairnes Reference Cairnes1862; Genovese Reference Genovese1965; Phillips Reference Phillips1918). These claims were overturned in the 1960s and 1970s by economic historians who found that slave ownership was profitable (Conrad and Meyer Reference Conrad and Meyer1958), and that Southern plantations were more efficient than Northern farms (Fogel and Engerman Reference Fogel and Engerman1975). At the same time, new estimates of gross domestic product showed that incomes in the antebellum South were growing as fast, if not faster, than those in the North.Footnote 2 Yet these studies tended to focus on the level of income, and most attributed change to the migration of slavery to more fertile Southwestern soils, such that the image of the static plantation was by and large preserved.
Of course, all parties recognized one big productivity-enhancing change: the saw gin patented by Eli Whitney in 1794. However, the labor bottleneck on cotton plantations subsequently shifted from ginning to picking, an activity that remained entirely manual well into the twentieth century. The lack of further mechanization reinforced the static view of the cotton plantation (Fleisig Reference Fleisig1965). Nevertheless, those who analyzed plantation records could observe a significant increase in the amount of cotton picked per slave (Whartenby Reference Whartenby1977: 54). Recently, Alan Olmstead and Paul Rhode (Reference Olmstead and Rhode2008, Reference Wright2010) collected a large database of these records. They found that the average amount of cotton that slaves picked in a day rose fourfold from 1800 to 1860, increasing at an annual rate of 2.3 percent.Footnote 3 By comparison, according Broadberry et al. (Reference Broadberry, Campbell and Van Leeuwen2011, table 8) the annual rate of labor productivity growth in textiles in Britain over the same period—during the height of the Industrial Revolution—was only 1.8 percent.Footnote 4 The traditional view of the static plantation was shattered.
Olmstead and Rhode attribute the bulk of this labor productivity growth to biological innovation: breeding cotton varieties that had higher yields and were easier to pick. Edward Baptist (Reference Baptist2014) has recently proposed an alternative explanation: New and brutal methods of competitive discipline forced slaves to come up with more productive methods of picking. Although their assumptions differ, these authors agree that slave owners innovated in response to market competition. Their work is thus in harmony with an emerging consensus view of a “modernizing” and even “capitalist” South (Barnes et al. Reference Barnes, Schoen and Towers2011; Beckert and Rockman Reference Beckert and Rockman2016), in which cost-cutting innovation was just as rapid and widespread as in the North. New historians have found evidence of systematic reductions in (1) labor costs, as in the mechanization of Louisiana sugar plantations (Follett Reference Follett2000), (2) transport costs, as in the spread of steamships and railroads through the South (Johnson Reference Hopkins2013; Majewski Reference Majewski2011), and (3) transaction costs, as in the financial innovations of Southern banking (Kilbourne Reference Kilbourne1995, Reference Kilbourne2006).
However, while this literature provides us with a detailed picture of how antebellum slave owners modernized “the peculiar institution,” it rarely addresses the question of why. By bracketing this question historians have tended, perhaps unintentionally, to revive a “consensus history” view of the origins of American capitalism. On this view, capitalism is either the natural outcome of human endeavor freed from the constraints of feudal relations, or the specific heritage of a “protestant spirit” that traveled to the New World on the first ships. Yet this view has been challenged by historians of “the market revolution” in the North (Stokes and Conway Reference Stokes and Conway1996), while in the South it must contend with evidence of the “premodern” sympathies of slave owners (Genovese Reference Genovese1965: 3). Even if we find examples of individual slave owners who were ardent modernizers, this alone cannot explain an increase in the average productivity of Southern plantation. For this we need to understand why the broad mass of slave owners, who often extolled a conservative distaste for markets and modernity, adopted the same innovations.
In what follows, I offer an alternative explanation of the capitalist behavior patterns of antebellum slave owners, one that relies on neither a quasinatural profit-maximizing agent, nor a modernizing cultural hegemony. Rather I point out a key constraint—the seizure and sale of the land and slaves of insolvent debtors—that compelled slave owners to compete via markets, whether they wanted to or not.
Origins and Definition of Credit Market Discipline
In Hyman Minsky's terms, debt tightens the “survival constraint” on capitalist actors (Mehrling Reference Mehrling1999: 139). Minsky (Reference Minsky1954: 135) shows that while access to liquidity is a condition of daily survival for everyone in a capitalist society, it is a condition that weighs heaviest on debtors, who are contractually committed to make timely payments. In a transitional context where subsistence production is still common, the spread of debt financing will increase the demand for money. If compelled to make fixed money payments on a regular basis, producers will become dependent on markets, for they will have to “sell to survive” (Brenner Reference Brenner and Wickham2007). Moreover, competition over a limited supply of credit can help enforce competitive behavior among producers because those able to generate higher returns can post more collateral or pay higher rates to bid credit away from less successful producers. Under these circumstances if one group of producers finds a way to lower their costs, others will eventually have to follow suit if they want to maintain access to credit, and thereby to the means of production.
However, for this constraint to be binding, and thus for debt dependency to have a determinate effect on the behavior of producers, an additional condition must be met: Those who fail to make payments must be penalized. I call this “credit market discipline.” In traditional societies debtors were often penalized through prison or slavery. While these threats provided ample incentives to repay debts, they also restricted the spread of markets. Both removed insolvent producers from direct involvement with the market, and imprisonment provided the creditor with no means to recoup his losses. By contrast foreclosure, the principal modern form of credit market discipline, sequesters not the person of the debtor but his assets. Foreclosure acts as a selection mechanism, reinforcing market dependency. For in addition to threatening indebted asset owners with lamentable consequence of nonpayment, the legal “execution” of debts enables others to bid for their assets at court sales. Thus, even if some producers refuse to specialize and innovate in response to market incentives, the effect of foreclosure will be to generate aggregate patterns of specialization and innovation nonetheless, for it will reallocate their assets to those more willing or able to make the most cost-efficient use of them.
Origins of Credit Market Discipline in the United States
From today's vantage point it seems obvious that creditors should be able to seize the assets of insolvent debtors to satisfy their claims. However, this ability emerged only during the transition to capitalism, and it first appeared in a British colonial context. In his survey of credit relations in the Atlantic slave colonies, Jacob Price (Reference Price and Solow1991) distinguishes between a “Latin model” of creditor law, which protected the integrity of the estates of insolvent debtors, and an “Anglo-Saxon model,” in which even unsecured creditors were given the right to seize land and slaves. According to Price, the Anglo-Saxon model originated in the reaction of British merchants to a number of debt-relief measures passed by colonial parliaments in the early eighteenth century.Footnote 5 To protect their interest merchant creditors petitioned the British Parliament to pass the Debt Recovery Act (DRA) in 1732.Footnote 6 This act made slaves and land in the colonies liable for the satisfaction of debts by defining them as equivalent to personal or chattel property, thereby removing any legal protection of the assets of debtors or their heirs in foreclosure and inheritance proceedings (Price Reference Price1992: 82). It also specified that land and slaves could be seized or sold for the repayment of any debt, whether secured or unsecured, according to the local procedures for chattel property (Priest Reference Priest2006: 389). Because this was typically public auction, the law effectively eradicated the traditional equity right of debtors to redeem mortgaged slaves and land after execution of a legal judgment.Footnote 7
What Price fails to mention is that at the time of its creation the “Anglo-Saxon model” did not exist in the Anglo-Saxon homeland. As Claire Priest (Reference Priest2006) has shown, the merchants who petitioned Parliament were appealing to customary rights in the regulation of commercial debts, rights they had succeeded in extending to many colonies due to their influence on colonial legislatures, but not to rights that any of them held in Britain. A Parliament dominated by landed interests would never have tolerated the DRA in its own backyard. Preserving the integrity of manorial estates was just as important for English landowners as it was for those of Spain, France, and Portugal. Hence in Britain real property was by default exempted from the claims of all unsecured creditors, and at death was transferred to heirs free of such claims. Even creditors secured by mortgages were often prevented from seizing real property, and chancery courts typically gave heirs precedence over secured creditors in inheritance proceedings. British law would not remove its exemptions for real property until a hundred years after the passage of the DRA, in 1833 (ibid.: 338, 424).
The legislative regime imposed by merchants in the colonies thus truly represented a “new world” of creditor-debtor relations. As Priest (ibid.: 390) notes, “[I]n America, the treatment of land as legally equivalent to any other form of chattel in relation to creditor's claims obliterated the division between landed wealth and commercial wealth, and thus between landowners and merchants.”Footnote 8 Because it gave creditors more security, the DRA increased the supply of credit and reduced interest rates in the colonies.Footnote 9 This in turn appears to have boosted trade, helping to shift the locus of the transatlantic economy to the British.Footnote 10 In the process vital assets that had previously been protected from the influence of markets—notably land and labor—were transformed into fully alienable commodities. In his Commentaries on the Constitution (Reference Story1833: 128) Joseph Story writes that the effect of the act was to “make land, to some degree, a substitute for money.” This was even more true of slaves, whose mobility and versatility as laborers made them a far more liquid asset.
The American Revolution further consolidated credit market discipline in the United States. After suppressing several debtor revolts in the 1780s, most state legislatures and judiciaries reaffirmed the principles of the DRA in the 1790s.Footnote 11 Meanwhile the Constitution explicitly forbade states from passing many forms of debt relief.Footnote 12 Such protections enabled credit to be extended on longer terms, not only by merchants, but also by wealthy individuals, institutional investors, and the state (using land banks) (Martin Reference Martin2010: 840–46). In the South lending at interest became a habit of planter elites, a way to make use of surplus funds, and part of a longer-term shift from real to paper assets (Blackmar Reference Blackmar, Zakim and Kornblith2012). Woodman (Reference Woodman1968: 34) describes how “the security of cotton—grown, growing, and to be grown—served as the basis of an immense credit system in the antebellum south.” When planters rolled over debt from one year to the next they typically offered the additional security of mortgages on land or slaves. Historians have tended to view credit relations between planters as a form of patronage, an age-old neighborly custom governed by norms of reciprocity rather than market pressures.Footnote 13 No doubt these aspects of local credit markets persisted. But the growth of mortgage security is indicative of an increasingly impersonal credit system: one in which neighborly trust was either supplemented or substituted by hard collateral.
Case Study: South Carolina in the 1840s
My hypothesis is that credit market discipline helped to drive capitalist dynamics in the antebellum South. Specifically, I claim that the ability of creditors to seize the land and slaves of insolvent debtors compelled slave owners to specialize for the market and increase productivity. It did so because most slave owners were in debt, and those who failed to repay their debts at the going rate would end up losing their land and slaves, and thus cease to be slave owners. While this form of credit market discipline is built into the legal form of creditor-debtor relations, its effect should be correlated with foreclosure risk. When this risk is high, as when cotton prices were falling, the debt overhang should have induced individual slave owners to raise cash and cut costs by any means necessary. In addition, foreclosure sales may have reallocated slaves to more productive plantations. Thus, according to my hypothesis, credit market discipline in a period of falling prices should lead planters not to withdraw from markets, as North and Genovese imagined, but to double down on market competition: to specialize in the highest value crop and adopt cost-reducing innovations.
I have chosen South Carolina as my case study for three reasons. First, more data on debt, foreclosure, and slave sales is available for antebellum South Carolina than for any other state. Second, despite a brief experimentation with debt relief in the revolutionary era, nineteenth-century South Carolina is known for being a stalwart enforcer of creditor rights.Footnote 14 It thus represents a clear case of credit market discipline. Third, it allows me to contrast my argument with a competing hypothesis, for South Carolina is in a sense the last place one would expect to find modern market-oriented behavior. As Thomas Russell (Reference Russell1993: 19) points out: “[W]hat marks the Palmetto State's peculiarity in the historiography is its ultraness: ultra-Southern, ultra-slave, ultra-aristocratic, ultra-anti-Yankee.” If Genovese's view of the “premodern” motivations of slave owners has any basis, it is in South Carolina that we should be able to see its effects.
Credit Expansion in the 1830s
In the 1830s, an influx of foreign capital and the advent of free banking led to a credit boom across the United States (Knodell Reference Knodell2006; Temin Reference Temin1969). Comprehensive data on antebellum debt levels is hard to find, but South Carolina kept some of the best records.Footnote 15 Figure 1, showing 4,485 mortgages collateralized by slaves recorded in Charleston from 1776 to 1843, indicates that the total number of such mortgages was higher in the 1830s than in any previous decade.Footnote 16 Bonnie Martin's sample of equity mortgages in three South Carolina counties (of which 71 percent listed slaves as collateral) shows that the amount of capital raised by such mortgages doubled from 1821 to 1835 (Martin Reference Martin, Beckert and Rockman2016: 115). The credit expansion was even greater in the upland cotton county of Fairfield, where the value of mortgages increased by 400 percent from 1821 to 1837 (ibid.: 116).
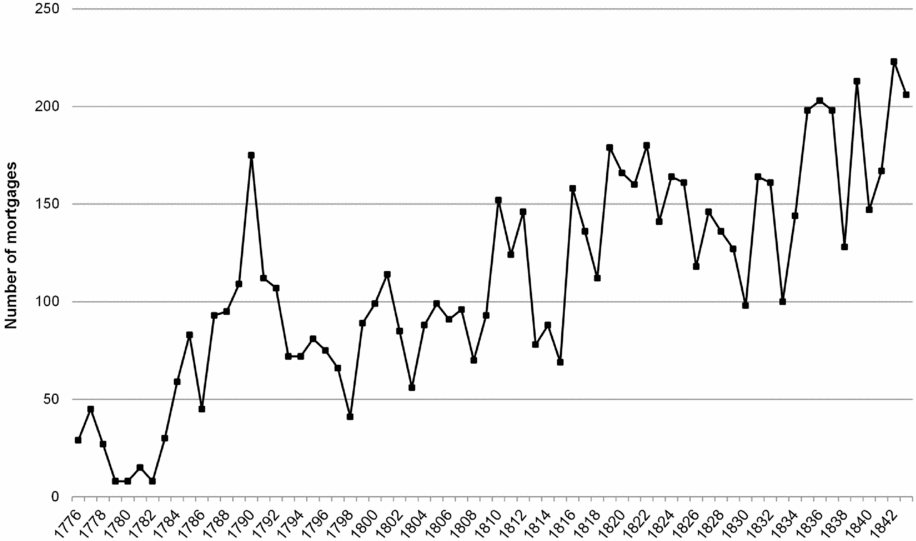
Figure 1. Number of slave mortgages in South Carolina, 1776–1843.
Bank records provide an alternative snapshot of the 1830s credit boom. When antebellum banks expanded their balance sheets it was typically to accommodate demand for commercial credit, by discounting notes and bills of exchange (Bodenhorn Reference Bodenhorn2000). Figure 2 displays the average annual assets of South Carolina's five major banks. South Carolina's largest bank, the State Bank of South Carolina, more than doubled its balance sheet in real terms in the 1830s.Footnote 17 The State Bank also significantly extended its proprietary lending against land and slave collateral in the mid-1830s (see figure 3). When many of its borrowers defaulted in the 1840s, the bank became one of the state's largest owners of slaves.Footnote 18
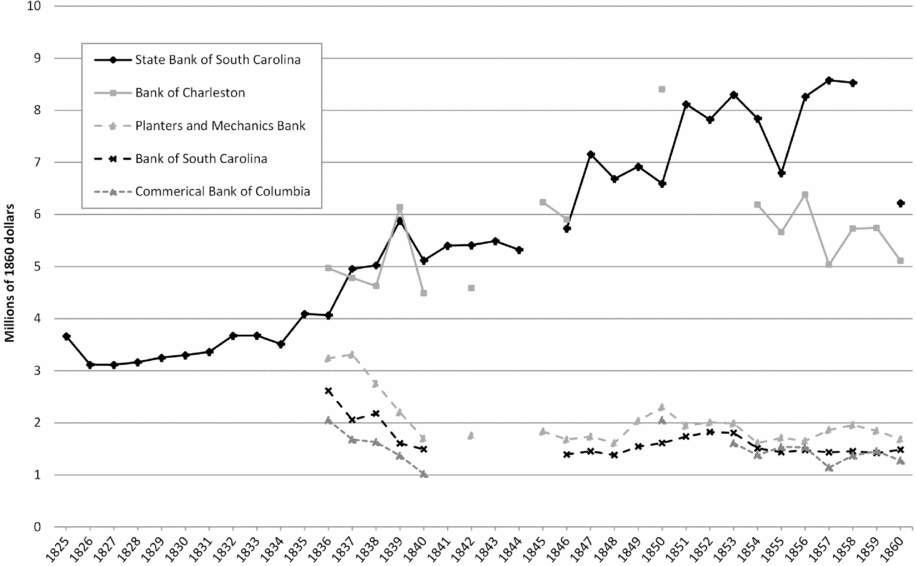
Figure 2. Total assets of South Carolina banks, 1825–60.

Figure 3. Total value of bonds and mortgages held by the State Bank of South Carolina, 1821–60.
Foreclosure Crisis in the 1840s
The “Minsky moment,” in which a credit expansion turns to a sudden contraction, came in the panic of 1837. There followed an exceptionally difficult decade for South Carolina's upcountry cotton planters. Prices were depressed at the start of the decade, largely due to a scarcity of money and credit. But the cotton price stayed low due to sluggish economic performance in Britain and increased competition from lower-cost Southwestern cotton producers.
If the sort of credit market discipline I hypothesize were operating in South Carolina we would expect the combination of widespread debt and falling prices to result in a wave of foreclosures as the survival constraint began to kick in. Historians have noted a rise in foreclosure in the 1840s. Lewis Gray (Reference Gray1933: 699) claimed that the low prices “were a source of financial ruin for thousands of planters” in the Old South, while Alfred Glaze Smith (1958: 54) reports that “notices of bankruptcies and assumpsit and capias satisfaciendum proceedings appeared frequently” in South Carolina newspapers. My own analysis of two newspapers finds that the number of such notices approximately doubled.Footnote 19
The most straightforward indicator of the crisis is the number of foreclosure sales. Figure 4 presents the annual percentage of the slave population of two upcountry cotton counties (Fairfield and Marlboro) sold by the courts to repay creditors.Footnote 20 This figure (representing 2,574 individual sales collected by Thomas Russell and the author) shows that court-ordered sales on behalf of creditors increased significantly during the period of falling cotton prices in the early 1840s. Mortgages in Fairfield had reached record highs in this period, as creditors demanded more security from their debtors.Footnote 21 When the cotton price bottomed out in 1845, the same year that a drought drastically cut both corn and cotton yields (Watkins Reference Watkins1908: 80), the number of slaves sold through the courts peaked at 359, or 2.7 percent of the Fairfield's slave population.

Figure 4. Court-ordered slave sales in Fairfield and Marlboro counties, SC, percentage of the slave population sold at auction, 1831–50.
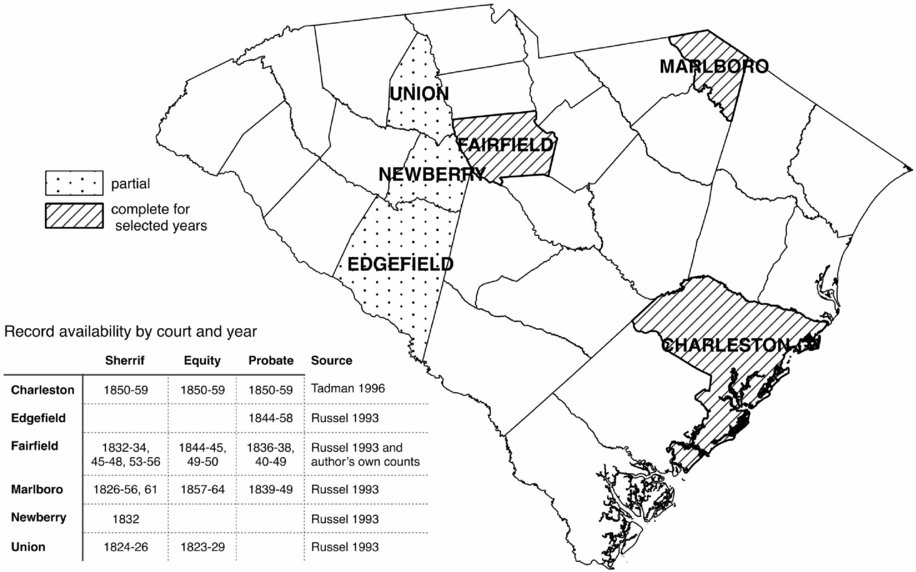
Map 1. South Carolina counties for which court sale data is available.
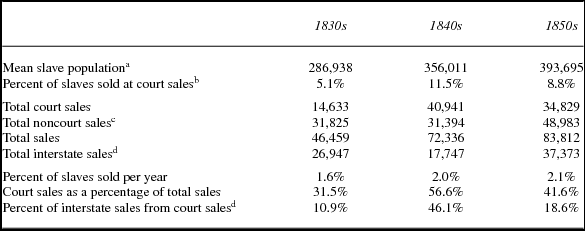
Based on these new estimates of court sales, table 1 presents revised estimates of total slave sales in South Carolina for the three decades following 1830.Footnote 22 It shows that in total 11.5 percent of the slave population in five upcountry cotton counties were sold at auction to repay debt in the 1840s, more than double the number for the decades before and after. Moreover, the majority (56 percent) of slave sales in the 1840s took the form of court sales. By contrast in 2008, at the peak of the recent foreclosure crisis, only 23 percent of all home sales were foreclosures (RealtyTrac 2010).
Table 1. Revised estimates of slave sales in South Carolina

a From Tadman (Reference Tadman1996).
b From Russell (Reference Russell1993: appendix) updated with Fairfield probate and equity sales.
c Based on two assumptions by Tadman (Reference Tadman1996: 120): that 20 percent of court sales went to the interstate trade, and that noncourt local sales were 40 percent of local court sales.
d Slave exports from Tadman (Reference Tadman1996: 12), percentage by traders from Steckel and Ziebarth (Reference Steckel and Ziebarth2013). See appendix for discussion of these estimates.
Together figure 4 and table 1 illustrate what Irving Fisher (Reference Fisher1933) has called a crisis of debt deflation: Falling prices increase the burden of debts contracted at fixed interest rates, shifting resources from debtors to creditors.Footnote 23 However, the true extent of credit market discipline is probably underestimated by these data. For every actual court sale, there were presumably many private sales to pay off creditors before having to face the humiliation and costs (in court fees) of a forced public auction.Footnote 24
Consequences: Specialization and Productivity Growth
Governor Hammond was not alone when he argued, in his address of 1841, that South Carolina planters should restrict their planting of cotton. Letters and editorials in the 1840s were replete with proposals that the state should diversify its agriculture and grow more food crops (Gray Reference Gray1933: 917; Smith 1958: 72–83). It was hoped that this would boost the price of cotton and reduce dependence on imports of meat and grain, as well as reducing the debt burden of planters.Footnote 25 But while Hammond and others stressed the advantages of independence, they also saw diversification as an inevitability. In the same year as Hammond gave his address to the Agricultural Society, the Patent Office (Reference Office1841: 75) wrote: “[W]henever . . . the price of cotton is low, the attention of cultivators, the next year, is more particularly diverted from cotton to the culture of corn.” For Hammond, the reason was obvious: “[W]hen the more valuable crops fail, and the means of purchasing are taken from us, we shall be driven to produce provisions of all kinds” (Hammond Reference Hammond1841: 186).
However, this prediction did not bear out. Figure 5 shows that the state's cotton output rose as the price fell. Total cotton yields almost doubled between the census years. The sharpest rise occurred in 1844, five years before prices began to sustainably recover in 1849. Thus, the decade with the lowest cotton prices also saw the greatest increase in production.
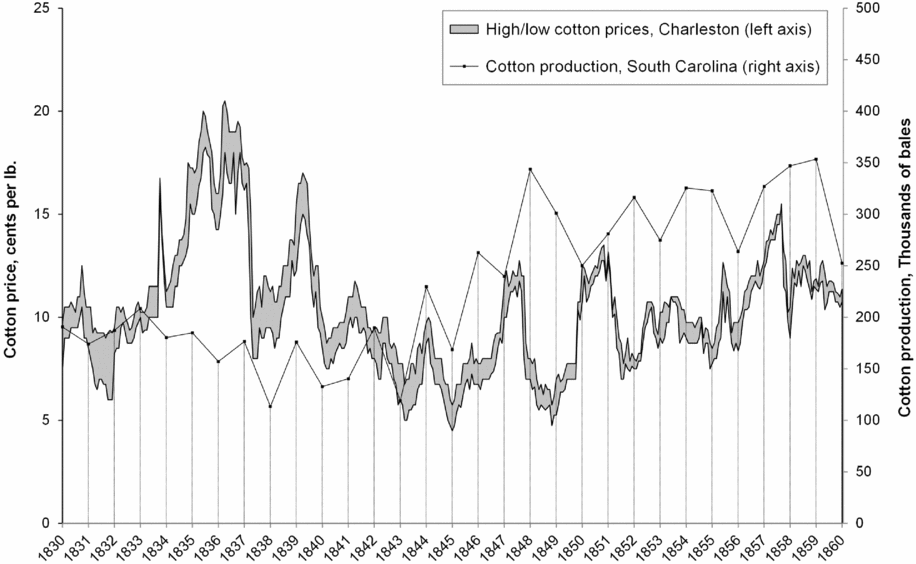
Figure 5. Cotton prices and production, South Carolina, 1830–60.
One possible explanation is that South Carolina planters did the opposite of what Hammond recommended: They became more rather than less specialized in cotton. Figure 6 displays the trend in cotton production alongside South Carolina's two other major staples—corn and rice—as well as an estimate of corn imported from other states through Charleston. It shows that while cotton production followed its upward trend, the production of corn and rice fluctuated around a roughly constant level. Corn output peaked in 1843, and cotton output fell, suggesting that planters may have tried to follow Hammond's advice in that year. However, in every other year cotton output grew faster than corn, which declined significantly in the middle of the decade, with corn imports through Charleston rising to compensate.Footnote 26
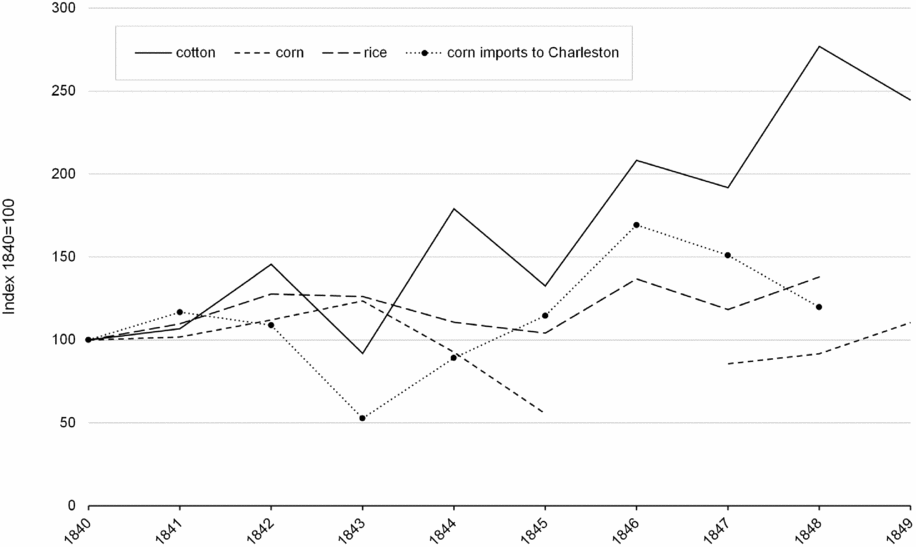
Figure 6. Cotton, rice, and corn production, South Carolina, 1840–49.
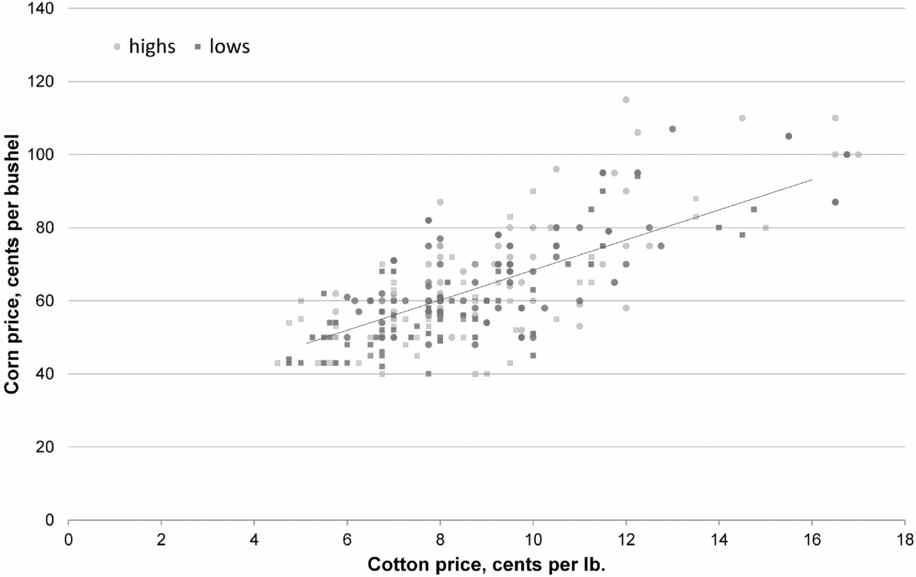
Figure 7. Monthly corn and cotton prices, South Carolina 1839–48.
We can observe this same pattern on Hammond's own plantations. Contrary to the advice he gave planters in 1841, Hammond increased his cotton acreage in that year and the preceding one. While he planted more corn in 1842–43, he returned to his concentration on cotton in 1844–45, the years of lowest cotton prices. Hammond's biographer, Drew Faust (Reference Faust1985: 122), concludes that “despite his dramatic appeal to fellow Carolinians to liberate themselves from the cotton market, Hammond himself remained largely in its thrall.”Footnote 27
Economic historians might simply dismiss Hammond's advice as irrational, for two reasons. First, if we overlook consideration of security and risk, and see cropping decisions only in terms of relative prices, then it makes little sense to switch to corn in response to falling cotton prices, for the price of corn also fell in the 1840s. Figure 7 shows the correlation between South Carolina corn and cotton prices.Footnote 28 Second, many economic historians have cast doubt on the trade-off implicit in Hammond's advice, pointing to complementarities between the labor requirements of cotton and corn. They imagine that because labor was typically the scarce factor, planters simply grew as much cotton as their slaves could pick, setting them to work on corn only during lulls in the cotton season.Footnote 29 If this were strictly true it would have been impossible for planters in South Carolina to have produced more cotton in the short run without purchasing extra slaves. We would also expect to find little or no variation in the cotton share of output across farms. However, we know this in fact varied greatly with farm size and region.Footnote 30 To solve this puzzle Gavin Wright (Reference Wright2006: 101) has suggested that smaller plantations, confronting constraints of land and credit, followed a “safety first” strategy. The risks of a generally bad corn harvest were double because plantations would face both a shortage of their own supplies and higher prices for purchased corn inputs. Smaller plantations had less collateral with which to mitigate such risks by borrowing, which may explain why “most Southern farms were producing less than capacity levels of cotton output” (Wright Reference Wright1978: 62).
If Wright's argument is correct then many smaller plantations would be technically capable of planting more cotton.Footnote 31 But why would they do so if (as Wright assumes) they were risk averse? An answer is suggested by South Carolina governor George McDuffie, in an address to the State Agricultural Society in 1840, a year before Hammond's:
One great cause of the incessant struggle to make large cotton crops, to the neglect of every other interest, is the reckless habit of contracting debts. Negroes are purchased upon credit, and the planter is thus furnished both with the means and the motives for unduly and disproportionately enlarging his cotton crop. As cotton is the only crop that will command money, and as money is the most pressing want of a man in debt, everything is directed to that object. (State Agricultural Society 1846: 107)
McDuffie's speech suggests that while every planter would benefit from higher prices if others reduced their cotton output, this option was often not available to them individually. The security of corn was only as reliable as the corn harvest, and when both crops failed, as they did in 1845, many planters would have had to take out loans to feed their slaves.Footnote 32 A tightening payment constraint would have made it harder for smaller plantations to roll over existing debts, and compel them to rely more on the cash crop to maintain solvency.
Yet it seems unlikely that an expansion of the internal cotton frontier on smaller plantations could alone have led South Carolina's cotton output to double over the 1840s. The sheer scale of the increase suggests that, in addition to assigning more land and slaves to cotton production, South Carolina's slave owners also found ways to extract more cotton from a given quantity of land and slaves.
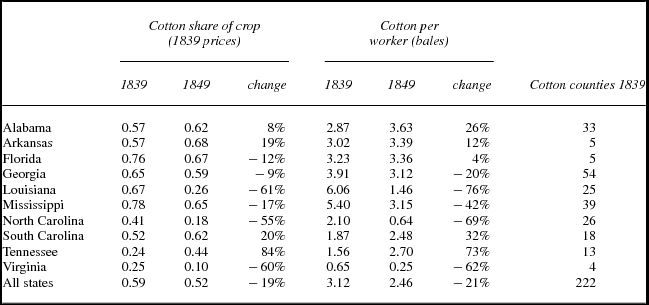
Measuring the relative contribution of specialization versus productivity growth to output growth is hampered by an absence of data on how much land was planted in cotton.Footnote 33 We can, however, compare changes in the share of county-level output to a rough measure of cotton bales per worker.Footnote 34 Table 2 puts both in a comparative context, looking at changes in cotton counties across the South in the 1840s. The first three columns show that while most cotton counties reduced their reliance on cotton in the 1840s, those in South Carolina saw cotton rise from 52 percent to 62 percent of total agricultural output.Footnote 35 The same data (not shown) indicate that these counties also saw a parallel decrease in the corn share, from 35 to 25 percent, even as it increased in most other states.
Table 2. Cotton shares and labor productivity estimates in upland cotton counties, 1839–49
Sources: Agricultural Census (cotton), Craig and Weiss (Reference Craig and Weiss1998) (labor force). Upland cotton counties are those producing more than 1,000 bales of upland cotton in 1839. Cotton shares calculated at fixed 1839 prices.
Although they don't prove that slave owners planted more cotton at the expense of corn, these numbers are consistent with the specialization story.Footnote 36 However, the next three columns of table 2 show that cotton output per slave increased even faster than the cotton share of output, and this too grew faster in South Carolina than in most other states.Footnote 37 These numbers are an inexact measure of slave productivity because we do not know what percentage of the slave labor force produced the cotton, or how many days they worked. However, unambiguous evidence of rising productivity can be found in Olmstead and Rhode's collection of plantation records. Figure 8 shows significant increases in daily rates of cotton picked per slave in the Old South for these years.Footnote 38
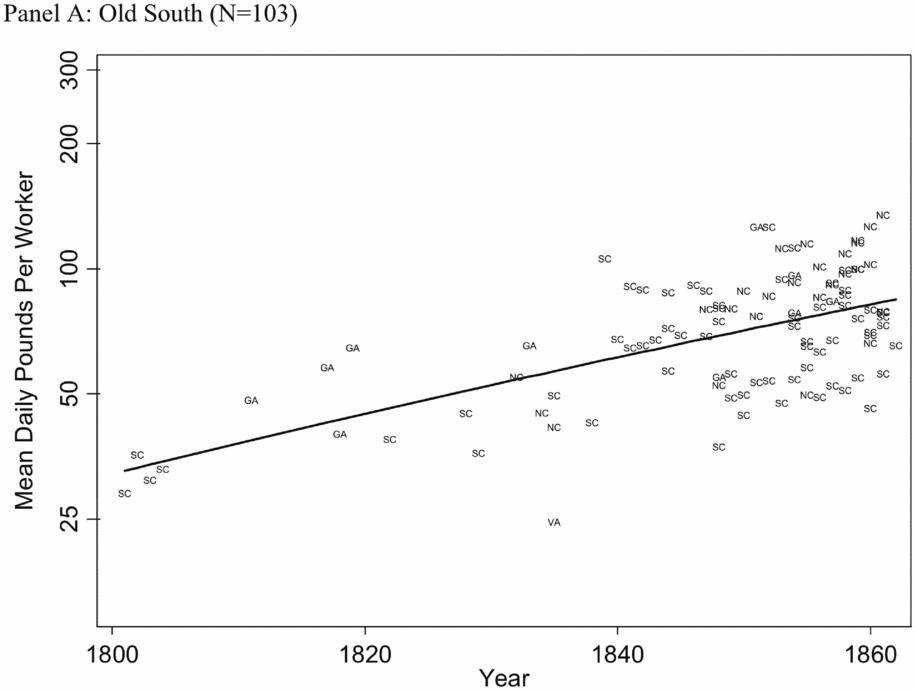
Figure 8. Daily cotton-picking rates, Old South, 1800–60.
While it is difficult to identify empirically the sources of this productivity growth, two possibilities are suggested by the literature: planters may have (1) introduced new, more efficient varieties and techniques, and (2) driven their slaves harder. I will look briefly at both before considering a third possibility: that crisis and foreclosure may have redistributed slaves to more productive plantations.
Under pressure from Southwestern competition, enthusiasm for agricultural innovation swept the South Carolina upcountry in the 1840s. The number of local agricultural societies increased rapidly in the early part of the decade.Footnote 39 They sought to share information about the best varieties and techniques, and published their reports in new journals of scientific agriculture.Footnote 40 Under the aegis of the State Agricultural Society, founded in 1839, they also offered annual awards to planters with the highest yields. In 1840, the society successfully lobbied the legislature to fund an agricultural survey of the state, conducted by the Virginian agricultural reformer Edmund Ruffin. The survey, completed in 1842, uncovered deposits of marl and lime—important fertilizers—and instructed planters on their use. The societies and journals also introduced planters to more efficient methods of ploughing and ginning.Footnote 41 But perhaps the most important technical change of the 1840s was biological in nature.
Olmstead and Rhode (Reference Olmstead and Rhode2008, 2010) attribute much of the productivity growth they observe to the cultivation of new cotton varieties, such as Petit Gulf, which had higher yields and were easier to pick. These “Mexican hybrids” were first developed in the Southwest, and took longer to adapt to the heavier soils of the upcountry piedmont. Olmstead and Rhode (Reference Olmstead and Rhode2010: 3) argue this lag explains much of the initial productivity differential between the regions. However, by the end of the 1840s Petit Gulf was the variety most commonly planted in upcountry South Carolina (Watkins Reference Watkins1908: 81). Adapting seeds was a costly business, requiring cooperation among local planters (Olmstead and Rhode Reference Olmstead and Rhode2008: 1134–40), and seeds were a key focus of the journals and agricultural societies in the 1840s.Footnote 42 Olmstead and Rhode attribute the spread of the new cotton varieties to price competition from Western planters, but these pressures would have been muted without the threat of foreclosure.
Historian Edward Baptist (Reference Baptist2014: 127, 445) has recently contested Olmstead and Rhode's explanation. He avers that the “ultimate cause” of productivity growth was in fact a system of “calibrated torture” designed to maximize the cotton picked per slave (ibid: 130). In what he calls “the whipping machine,” slaves were given individualized daily quotas that were continually increased, and were whipped for failing to meet them (ibid.: 133–42). Baptist's story isn't particularly consistent with the timing and distribution of productivity growth in Olmstead and Rhode's data (Clegg Reference Clegg2015; Olmstead and Rhode Reference Olmstead and Rhode2016) and I have found no evidence that planters treated their slaves more harshly in the 1840s.Footnote 43 However, if they did it would not come as a surprise to Baptist, who claims that “the need to repay loans only accelerated the whipping machine” (ibid.: 271).
It is also possible that some of the productivity increase was due not to any change in the organization of individual plantations, but to a reallocation of land and slaves between plantations. Table 1 indicates that total slave sales increased by 56 percent in the 1840s, with most of these being court sales. Foreclosures allowed solvent planters to buy up the land and slaves of insolvent debtors at fire sale prices.Footnote 44 This could lead to aggregate productivity growth, either because the highest bidders tended to own plantations that were already more productive, or because the resulting concentration of ownership resulted in economies of scale.Footnote 45
While it is not possible to directly measure the reallocation of land and slaves between plantations, it is possible to get an approximate measure of slave movements and the concentration of slave ownership.Footnote 46 South Carolina's slave population tended to grow more slowly than in most other states, due both to net out-migration and disease vectors in lowland rice-producing counties.Footnote 47 However, table 3 shows that the population in South Carolina's uplands not only grew consistently faster than in the South Atlantic region as whole, but also their rate of population growth doubled in the 1840s. This strongly suggests that slaves were being imported into these counties, either through sales or relocation by planters. Given that the slave population of coastal rice counties declined in the 1840s, and that the crisis of that decade appears to have been felt hardest in those counties, it is likely that much of the growth in the upland slave population was due to a redistribution of slaves from the rice-producing lowlands, leaving the state more specialized in cotton as result.Footnote 48
Table 3. Slave population growth 1829–59

Sources: US Census, Agricultural Census. Upland cotton counties are those producing more than 1,000 bales of upland cotton at the beginning of the decade, except for 1829–39 for which only end-of-period cotton production data is available. Rice counties are those producing more than a million pounds of rice. The urban slave population of Charleston (Carter et al. Reference Carter, Gartner, Haines, Olmstead, Sutch and Wright2006: Table Bb102) is excluded.
One indication that this movement was driven by sales rather than relocation is the increasing concentration of slave ownership in upland counties.Footnote 49 Table 4 shows that while the number of slaves per slave owner remained roughly stable for the South as a whole in the 1840s, it rose significantly in South Carolina. Moreover, all this increase is attributable to the increasing concentration of slave ownership in the upland cotton counties. While slave wealth remained more concentrated in other counties (due to the historically larger scale of rice plantations), their levels of concentration fell in the 1840s. In the upcountry, by contrast, plantations were becoming larger. This suggests that more successful planters in such regions were purchasing slaves from less successful planters resulting in both selection and scale effects on productivity.
Table 4. Average number of slaves per slave owner, 1839–59
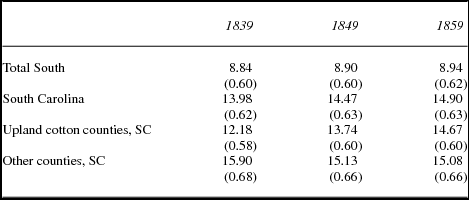
Gini coefficients in parenthesis. Source: US Census (slave schedules).
To sum up, the approximate doubling of South Carolina's cotton output over the 1840s could have been driven either by allocating more land and slaves to cotton or by increasing their productivity. To the extent that it was the latter it may have come about through transformations in the technology and organization of individual plantations, or through changes in composition and economies of scale resulting from concentration of slave and landownership. Although the existing evidence makes it difficult to weigh the relative contribution of these factors, for the purposes of this article it is not necessary to do so, for my hypothesis is consistent with all these mechanisms. As McDuffie suggests, it was their overhead of debts that likely convinced some planters to increase their specialization in the cash crop despite low prices. But it was those same debts, and the risk of foreclosure they entailed, that may have pressured slave owners to adopt the latest cost-reducing seeds and techniques from the Southwest. Finally, if some planters remained attached to their traditions, refusing to adapt to competition, foreclosure would have redistributed their slaves to more productive plantations and led to specialization and productivity growth nonetheless.
Counterfactual Evidence from Kentucky
If South Carolina's slave owners had not been subject to credit market discipline then my argument implies that cotton specialization and productivity growth would have been absent or subdued. One may test this claim by comparing South Carolina to states in which credit market discipline was relatively loosened. We saw in table 2 that South Carolina saw higher productivity growth in the 1840s than any cotton state apart from Tennessee. Yet the available data allows for no simple way to compare the degree of credit market discipline across these states.Footnote 50 The most notorious form of debt relief in the 1840s consisted of Southwestern states defaulting on the bonds of state-backed “planter banks” created in the boom years (Baptist 2014: 291). However, these actions directly affected only a limited group of stockholders, and historians tend to find that foreclosure was also rampant on the Southwestern frontier in the 1840s (Kilbourne Reference Kilbourne1995; Murphy Reference Murphy2017).
A stronger contrast to South Carolina might be Kentucky, which also suffered as a result of Southwestern competition, but had a remarkable legacy of broad-based debt relief. Although some Kentucky planters moved into cotton in the 1830s when prices were high, Kentucky did not develop a full-blown cotton culture until after the Civil War. Kentucky plantations tended to be smaller and less reliant on short-term debts to merchants and factors. But Kentuckians were by no means free from debt, indeed their level of indebtedness proved a highly contentious political issue.
From 1816 to 1819 many Kentucky farmers had purchased land on credit, either on installments from government land offices, or through mortgages from local banks. With the panic of 1819 credit contracted and prices fell, increasing the burden of debt. In a remarkable episode, which foreshadowed the “lender of last resort” function of modern central banks, Kentucky farmers successfully lobbied the state to bail them out (Bodenhorn Reference Bodenhorn2000: 44). The legislature passed laws allowing landowners to delay payments on their mortgages by up to two years. They also chartered the Bank of the Commonwealth of Kentucky, whose primary mission was to relieve indebted farmers through an extension of easy credit. All Kentucky landowners were eligible for a $1,000 loan from the bank, in irredeemable notes that were declared legal tender for the payment of taxes and debts. Many laws were subsequently passed to encourage creditors to accept these notes at par.Footnote 51 The inflation this generated provided significant relief to Kentucky's debtors, while antagonizing creditors.
Although the Commonwealth Bank was effectively destroyed in the early 1830s by an elite coalition led by Henry Clay, Kentucky's radical debt-relief experiments of the 1820s helped shape the state's response to the post-1837 depression. In the early 1840s, the legislature enacted several measures to ease the judicial and financial pressures on Kentucky debtors. They cancelled the middle term of the state's circuit court, restricted the instances in which magistrates could give judgments, exempted the slave property of married women from liability for their husband's debts, increased exemptions for domestic property, and instructed state banks to issue more notes and allow debtors more leeway in repayment (Jones Reference Jones1971). As a result, indebted Kentucky slave owners were less threatened by foreclosure than slave owners in South Carolina.
This different experience of debt and foreclosure was accompanied by a markedly different pattern of allocating slave labor. Both Kentucky and South Carolina slave owners were threatened by competition from the Southwest from the 1830s on, and thereafter both were net exporters of slaves.Footnote 52 But whereas South Carolina doubled its production of cotton in the 1840s, table 5 shows that the low prices of that decade cut Kentucky's small cotton culture in half.Footnote 53 And while the average number of slaves per slave owner rose in South Carolina in the 1840s, in Kentucky it fell.
Table 5. Slave ownership and agricultural production in Kentucky
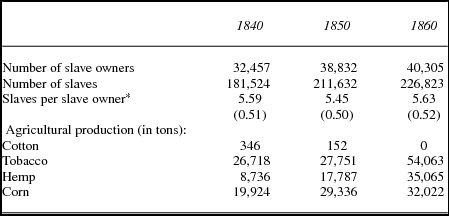
*Gini coefficients in parenthesis. Source: US Census (agricultural census and slave schedules). Conversion to tons: Table of Weights, Raymond and Ward, Chicago (c. 1854).
Of course, cotton was new to Kentucky, and it was harder to grow and transport for reasons of soil and geography. Tobacco, however, had long flourished in Kentucky, so one might expect slave owners to have switched to tobacco when cotton proved unprofitable at the lower price. However, tobacco prices also fell in the 1840s, and Kentucky planters struggled to compete with the more developed tobacco culture of Virginia and North Carolina. With cotton almost eradicated and tobacco stagnating, the expansion of Louisville's hemp industry did stimulate a flow of slaves into hemp production and manufacturing. However, Kentucky's main response to low staple prices in the 1840s was to shift to corn and other food crops. These crops guaranteed farmers’ subsistence when markets failed but provided little opportunity for expanding production by means of export or economies of scale.Footnote 54 It may thus help to explain the falling concentration of slave ownership in these years. In fact, the 1840s saw agriculture in many parts of the state settle on a distinctive pattern of small-scale farming—orientated toward local markets when it was orientated toward markets at all—that would extend into the twentieth century (Hopkins Reference Hopkins1951; Pudup Reference Pudup1990).
While debt enforcement in South Carolina was associated with increased market specialization, a growing concentration of slave ownership, and agricultural innovation, debt relief in Kentucky was associated with a withdrawal to the security of subsistence crops and a deconcentration of slave ownership. Urban manufacturers in Kentucky were to some extent able to take advantage of the stagnation in agriculture by bidding slaves away from plantations.Footnote 55 However, competition with both manufacturing and the Southwest was muted by debt relief, allowing slave owners to weather the storm, much as historians have (wrongly) imagined they did in South Carolina.
Why did South Carolina not pass any of the debt-relief measures we saw in Kentucky and other states? We know that there were murmurings in support of such measures from indebted South Carolina planters, including a proposal to establish a bank similar to the Commonwealth Bank of Kentucky, but these faced a united opposition among the state's political elite.Footnote 56 Ultimately South Carolina passed procreditor legislation in the early 1840s, increasing the penalties for insolvent debtors (Richardson Reference Richardson1851: 14). The reason, I suspect, is twofold.
First, South Carolina debtors may have had less opportunity to benefit from the debt-relief measures carried out in Kentucky. Their direct dealings with international cotton factors meant they were typically paid in sterling bills. Because cotton prices were determined in British exchanges, and debts needed to be convertible to New York or British money, an expansion of bank credit money would just increase the price of local goods in terms of cotton. Whitfield Brooks, a founder of the State Agricultural Society, explained that “the planter of cotton is forced to sell his produce at a price regulated by gold and silver and to purchase every article of consumption by a paper standard in the domestic market” (State Agricultural Society 1846: 22). This meant that the debts of South Carolina planters were less susceptible to being inflated away in the manner achieved in Kentucky. Indeed, having suffered from domestic inflation in the 1830s, South Carolina planters were more wont to censure banks for their irresponsible paper issuance in the upturn than to look to the same for salvation in the downturn.Footnote 57
Second, South Carolina's debtors were unable to form a coherent political opposition. Historians typically attribute the lack of party polarization in South Carolina to the appeal of sectionalism. However, scholars have recently argued that this sectional unity was largely premised on the ability of low-country slave owners to extend slave ownership to the piedmont, partly by extending credit to an emergent upcountry elite (King and Moeller Reference King and Moeller2006: 5–11; Klein Reference Klein1992). The latter in turn became local creditors who could be counted on to oppose debt-relief legislation. The spread of slavery also reduced the influence of a non-slave-owning yeoman class with which indebted slave owners could make common cause. Thus, a regional and class alliance around the issue of debt relief was never able to gain political traction. In Kentucky, by contrast, credit was typically provided by state banks situated in Louisville, the Bank of the United States, or the federal government in the case of land office loans. It was much easier for indebted slave owners and yeomen to rally a local electorate in opposition to such a distant set of creditors.
Conclusion
We began with the paradox that cotton seemed unprofitable beneath 8 cents a pound for most South Carolina planters in 1841, and yet they nonetheless produced more cotton over the following years, even as the price fell.Footnote 58 We now have a two-part explanation for that paradox. In the first instance, they had to plant cotton to repay debts contracted during the boom years. In the second instance, they made cotton profitable at the lower price, by reaping economies of scale and introducing new seeds and techniques.Footnote 59 This was a modern, capitalist response to changing price signals, not the response of a patrician elite. If South Carolina's planters liked to see themselves in the image of the latter, their behavior revealed that other forces were at work.
I have argued that a key force guiding this reaction was the threat and reality of foreclosure, which shaped aggregate patterns of growth and compelled debtors to adapt their behavior. Yet I do not wish to imply that capitalist dynamics are simply the result of creditors lording it over debtors. The belief that creditors were “the power behind the throne” of King Cotton (Stone Reference Stone1915: 562) was common among planters, who liked to blame creditors for many things, including the widespread practice of separating slave families through sale. Yet this view conveniently ignores the fact that many creditors were themselves planters.Footnote 60
In fact, the pecuniary interests of creditor and debtor were often aligned: Both bore the risk of crop or market failure (especially if collateral was posted) and both benefited when returns were high. Planter-creditors may have been motivated to lend by a desire for security, for if their crops failed they could potentially reap from their paper assets. Thus, it would be a mistake to assume that creditors simply imposed their own profit-maximizing preferences on a risk-averse planter class. Yet whatever the mind-set of creditors, an expanding credit economy would still enforce market specialization, for debtors would still have to generate enough cash at current market prices to repay their debts. The point is that a widespread dependency on credit generates structural compulsions of its own, supervening on the ex-ante motivations of individual slave owners.
This observation allows us to relate our findings to a long-standing debate about the relation between slavery and capitalism. This debate has tended to follow Max Weber in identifying capitalism with a “spirit” or “mentality”—one of thrift, rationality, and progress. Thus Genovese, in his argument that slavery was “noncapitalist,” pointed to “paternalist” relations between master and slave, and to the “prebourgeois” culture of the master class. By contrast, Fogel and Engerman contended that slave owners were in fact calculating and modernizing. However, if the debt constraint I am describing was operative, then identifiably capitalist outcomes—market orientation, profit maximizing, technical innovation—are in an important sense independent of mentality. This is because slave owners who were not interested in specializing for the market, maximizing profit or adopting cost-reducing innovations would end up losing their slaves to those who were. On this view, capitalist patterns of behavior can be the unintended consequence of competitive selection operating via credit markets.
My argument is consistent with recent historiography that has emphasized the pressures of debt in driving the transition to capitalist agriculture in the North (Levy Reference Levy, Zakim and Kornblith2012; Post Reference Post2011). I have identified similar dynamics operating in the antebellum South. North and South were marked by very different social and economic structures, but agriculture in both regions was characterized by comparatively high levels of debt and a legal system that enforced creditor claims through compulsory foreclosure. Thus, in both regions, credit market discipline may have led to capitalist development—in the form of market specialization and high levels of productivity growth.Footnote 61
Can this claim be generalized to other places and times? The colonies of British America were peculiar in developing a legal system that favored foreclosure over punishment for insolvent debtors, and removed impediments to the sale or transfer of assets to repay creditors. By contrast, productivity growth appears to have been slower or nonexistent in other New World slave economies, where courts were often less favorable to creditors. For instance, in the sugar-exporting region of Northeastern Brazil, land and slaves were legally protected from seizure for the repayment of debt (Price Reference Price and Solow1991: 305; Schwartz Reference Schwartz and Schwartz2004: 187), while productivity there appears to have stagnated from the mid-eighteenth century onward (Klein and Luna Reference Klein and Luna2009: 34). Further studies will be necessary to establish whether the rise of capitalism coincided with the imposition of credit market discipline in other parts of the world.
Appendix
Revised Estimates of South Carolina's Slave Trade
Several historians have attempted to estimate the scale of the slave trade in South Carolina. Michael Tadman derived decennial estimates of slave sales based on court sales from Charleston and demographic estimates of slave exports (1996: 119–20). Steven Deyle (Reference Deyle2005: 294) combined Tadman's figures with Russell's more comprehensive data on court sales, correcting Russell's own calculations of total sales (Russell Reference Russell1993: 67–68). These authors find that both court-ordered sales and slave exports were lower in the depressed 1840s than in the booming 1850s, suggesting that the foreclosure crisis had little impact on the slave trade.Footnote 62 Yet their methods underestimate the number of court sales in the 1840s, as well as the number of court sales to slave traders.
Tadman tends to downplay the role of slave traders in court sales. He argues that slave traders preferred private to auction sales because they liked to pay in cash, and to buy individual slaves rather than the “mixed lots” available at auction (Tadman Reference Tadman1996: 52–55, 113, 136). Russell points out several flaws in Tadman's argument, but shares his view that slave traders were wary of court auctions.Footnote 63 For Russell the problem was that court auctions were not competitive because auctioneers may have favored debtors and locals over creditors and outsiders (Russell Reference Russell1993: 100–1). Thus, both authors would presumably be skeptical of the argument, made in the preceding text, that debt and foreclosure contributed to productivity growth through reallocating slave labor to more cost-efficient producers.
However, according to Tadman's own estimates for the 1850s a third of all slaves sold outside the state were purchased at court sales, hardly a small amount (Tadman Reference Tadman1996: 119–20). Tadman claims that court sales in the 1840s were of little significance, but Russell (Reference Russell1993: 73) and Deyle (Reference Deyle2005: 294) both find that there were more court sales than noncourt sales in that decade. They estimate court sales as a fixed percentage of the total slave population in each decade, a percentage derived from Russell's average for 1820 to 1860 (.85 percent per year). But Russell's own figures indicate that the percentage of slaves sold through the courts doubled in the 1840s.Footnote 64 Combining my own data on court sales with Russell's, in table 1 I estimate the number of court sales in each decade separately. As a result, the 1840s is revealed as the peak decade for foreclosures, with 10,680 sold by South Carolina's courts, and more than half of all slave sales taking place at court auction.Footnote 65 If we follow Tadman's assumption that 20 percent of court sales went to slave traders then such sales accounted for almost half of the interstate trade from South Carolina in the 1840s.
Another potential problem with the estimates of these authors is that they all assume a fixed proportion of slave exports were sold rather than transported with migrating planters.Footnote 66 Richard H. Steckel and Nicolas Ziebarth (2013) have recently collected new data on the coastal trade that allow us to construct more precise decennial estimates of this proportion. Figure 9 displays the number of coastal slave exports from Charleston from 1816 to 1861. While this figure excludes the overland trade, it casts doubt on Tadman's finding (1996: 12) that fewer slaves were exported in the 1840s than in other decades. It indicates that 20 times as many slaves were shipped from South Carolina during the 1840s as in the 1830s, and seven times as many as in the 1850s. Using a combination of estimating procedures, Steckel and Ziebarth find that the proportion of these slaves shipped by traders was at its highest in the 1840s.Footnote 67
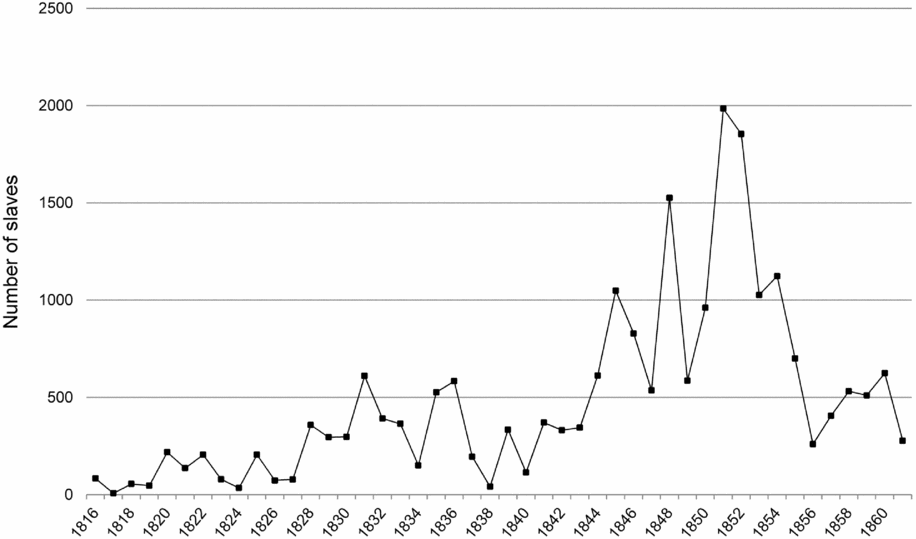
Figure 9. Number of slaves shipped from Charleston to other US ports.
Figure 9 may also be compared to figure 4, for both show a sharp break in 1845, at which point both the number of foreclosures and the number of slaves shipped from South Carolina doubled.Footnote 68 It is hard to account for the latter by any shift in the preference of interstate slave traders toward coastal shipping rather than inland routes, for the 1840s was a decade in which other forms of transportation (canals and railroads) were on the rise. Yet the correlation is consistent with the hypothesis that many of the slaves sold at public auction ended up in the interstate trade.


