Introduction
Acute respiratory infection (ARI) seasonality is generally believed to stem from three main factors: the cyclical nature of host immunity, weather variations and changes in host behaviour, most notably in how people interact with each other [Reference Lipsitch and Viboud1, Reference Grassly and Fraser2]. Close person-to-person contact, particularly among school-age children, is frequently cited as an important example of the latter. An association between school sessions and ARI outbreaks has long been observed [Reference Dingle3], and many researchers have proposed school attendance as an important driver of early autumn and winter spikes in ARIs. Yet research demonstrating this effect is relatively limited. Measles was one of the first viruses that showed a strong correlation with school sessions [Reference Grassly and Fraser2, Reference van den Hof, Conyn-van Spaendonck and van Steenbergen4, Reference Fine and Clarkson5]. More recent research on influenza [Reference Chao, Halloran and Longini6, Reference Heymann7] has also suggested a link, and rhinovirus has demonstrated autumnal peaks that correlate closely with the onset of school [Reference Monto8]. Any attempt to discern a correlation between school attendance and seasonality, however, is necessarily complicated by other potential drivers that these studies do not address.
Of all potential correlates of seasonality, temperature and relative humidity are the most widely studied. Colder temperatures are associated with increases in ARIs, and studies have largely confirmed an inverse relationship in temperate regions. Inverse relationships between viral prevalence and temperature have been shown for common viral pathogens, including influenza, respiratory syncytial virus (RSV), rhinovirus, adenovirus, coronavirus and human metapneumovirus [Reference du Prel9–Reference Ji13]. Relative humidity has been studied extensively, albeit with less consistent findings. Several studies suggest that higher relative humidity correlates with increased prevalence of RSV, rhinovirus, adenovirus and coronavirus [Reference du Prel9–Reference Welliver11, Reference Karim14–Reference Casanova16]. Research on the role of temperature and relative humidity in bacterial causes of seasonal ARI is more limited as seasonal ARI outbreaks are primarily viral in children [Reference Weigl17, Reference Bezerra18] and often viral in adults [Reference Atmar19, Reference Brittain-Long20].
Understanding ARI seasonality informs public health interventions aimed at limiting the spread of respiratory infection. Thus, we designed this study to determine the level to which school attendance contributes to seasonal outbreaks of all-cause respiratory infections, as assessed within a primary care electronic health record (EHR) database. To account for confounding meteorological factors, we included temperature and relative humidity in the model of seasonality.
Methods
Respiratory infection cases
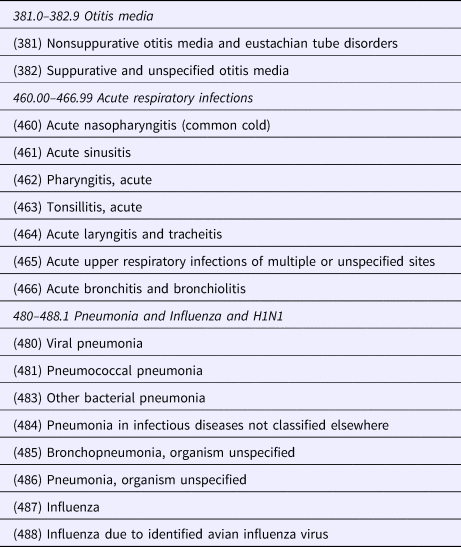
Weekly ARI case counts were estimated using a composite of ‘all-cause’ respiratory infection diagnoses derived from the University of Wisconsin, Department of Family Medicine and Community Health's clinical data warehouse (CDW). The CDW aggregates EPIC Systems EHR data that is extracted daily from a network of 28 ambulatory practices, primarily in the south-central portion of the state. The records for approximately 800 000 ambulatory visits are available annually and represent approximately 2.5% of Wisconsin's total population. Weekly ARI diagnoses from May 2004 to July 2011 were determined by ICD9 codes as shown in Table 1.
Table 1. All cause acute respiratory infections – ICD9 Coding

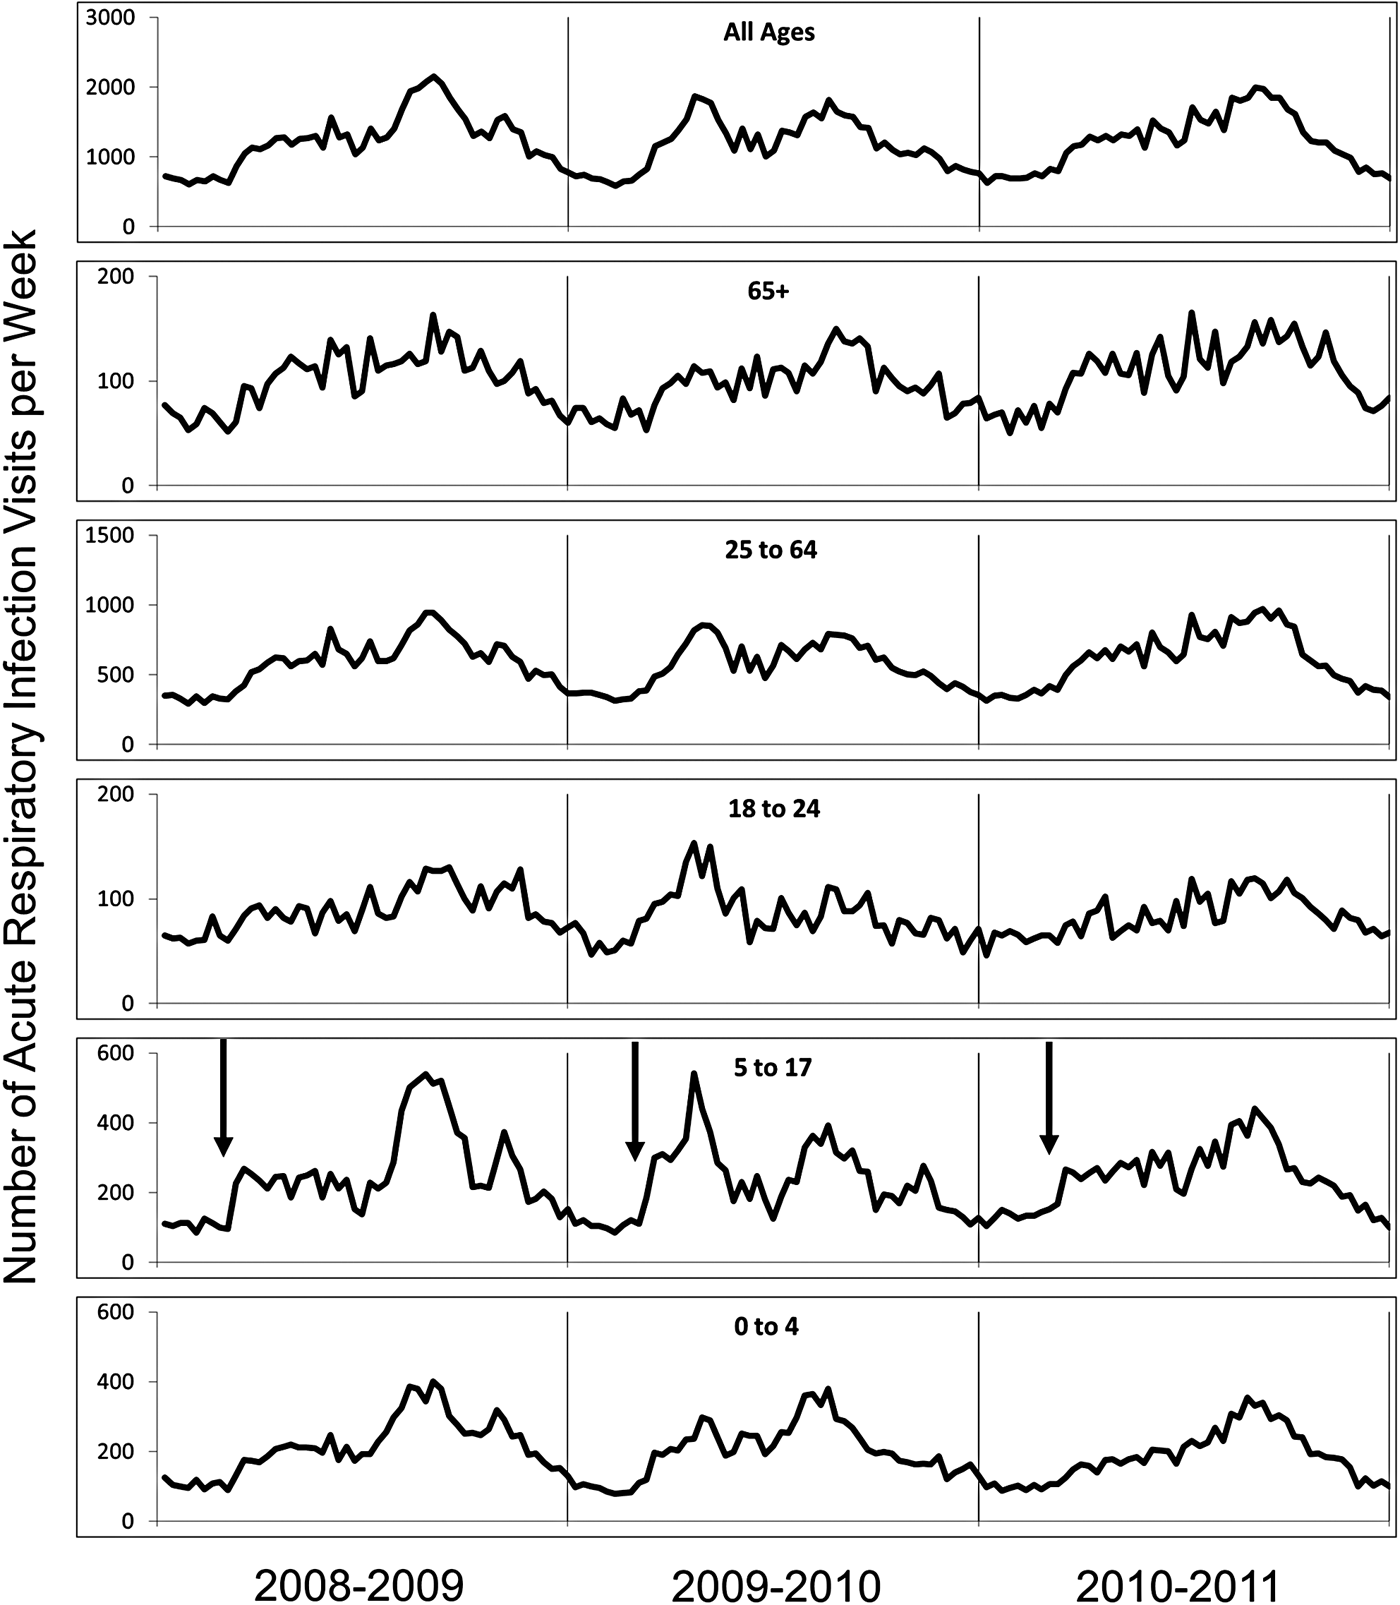
The local database was originally developed for ongoing assessments of inappropriate antibiotic use. ARI diagnoses were stratified by patient age and trended over time. Five age categories were used: preschool children (0–4 years), school-aged children (5–17 years), young adults (18–24 years), adults (25–64 years) and older adults (65+ years). Visits with ARI diagnoses and total clinical encounters for each year under study are shown in Table 2. ARI counts from 2008 to 2011 are depicted in Figure 1.

Fig. 1. ARI counts by age group (July 2008 through June 2011). Arrows in panel for children, ages 5–17 years, indicates start of the academic year.
Table 2. Acute respiratory infection (ARI) diagnoses as a percentage of all clinic visits, 2004–2011, by age group

All-cause respiratory infection diagnoses were used as a surrogate measure for ARI case counts in order to accurately capture respiratory pathogen activity. Because specific clinical and coded diagnoses in primary care settings are imprecise, erroneous or may reflect individual clinician prescribing behaviour [Reference Vinson and Lutz21], we felt that the all-cause metric more accurately reflected community trends in ARI activity.
School attendance
Public primary, middle and high school calendars for all school districts served by clinics included in the CDW were examined to determine start and end dates for both the fall and spring school semesters. Partially due to Wisconsin state mandates, academic year start and end dates, as well as winter breaks were relatively uniform across the state with variation of less than 1 week between districts. School districts showed more variation in timing of spring vacations, so schools were assumed to remain in session throughout the spring semester for data analysis. Spring break typically lasts 9 days (5 school days), but varies widely over a 5-week period among school districts within any given year. As de-identified ARI events were aggregated over a wide geographic area, representing the catchment areas of 28 clinics and several dozen school districts, we were unable to assess for the differences in the aggregated data based on individual exposure to a particular school district break timing. School attendance for each week of every calendar year was coded with one of six values representing: (1) 1 week in session, (2) 2 weeks in session, (3) more than 2 consecutive weeks in session, (4) 1 week out of session, (5) 2 weeks out of session or (6) more than 2 consecutive weeks out of session.
Meteorological data
Weekly average temperature and relative humidity data were obtained from the National Climatic Data Center for the period under study. As most clinics are located in the south-central portion of the state, meteorological data were obtained from the Dane County Regional Airport weather observation station (station ID 474 961, latitude 43°08′N, longitude 89°20′W).
Statistical analysis
Data analysis was performed with R version 2.15.1 [22]. An over-dispersed Poisson generalised additive log-linear regression model was fit to the weekly number of ARI diagnoses as a function of school attendance as a categorical variable and temperature, relative humidity, year and season (calendar week within year) as smooth functions (thin plate regression splines) [Reference Wood23]. The number of ARI diagnoses in the prior week was also included as a covariate to account for possible autocorrelation. Analyses were conducted for all ages combined and for each age group individually. Risk ratios and associated 95% confidence intervals (CIs) were presented for each attendance category relative to the baseline category of more than 2 consecutive weeks out of school (i.e. summer vacation). A nominal P-value of 0.05 was regarded as statistically significant.
Results
During the 7-year study period (2004–2011), 492 037 all-cause ARI cases were recorded, representing 8.3% from a total of 5 922 770 clinical visits. Of note was an inverse relationship between age and the predominance of ARI diagnoses; 27.2% of visits for children (ages 0–4) included an ARI diagnosis as compared with 3.8% of visits for adults age 65 years and older (see Table 2).
School attendance
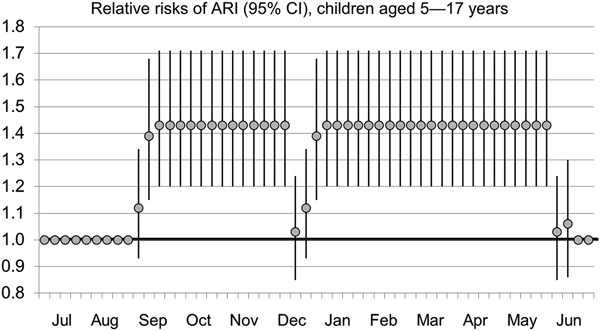
Risk ratios for ARI based on school attendance are presented in Table 3. Controlling for temperature and humidity, risks of ARI were increased for children 0–4 years and 5–17 years during school sessions. During the second week schools were in session, risk ratios were 1.12 (1.02–1.24) for children 0–4 years and 1.39 (1.15–1.68) for children 5–17 years. When schools were in session three or more consecutive weeks, risk ratios were 1.16 (1.06–1.27) and 1.43 (1.20–1.71) for children 0–4 years and 5–17 years, respectively. A similar finding was reflected in the pooled analysis of all ages, with risk ratios of 1.14 (1.04–1.24) for the first week schools were in session, 1.15 (1.05–1.26) for the second week and 1.15 (1.06–1.26) for more than 2 weeks into sessions. Risk ratios through a 12-month period for children ages 5–17 years are depicted in Figure 2.

Fig. 2. Relative risks of ARI (95% CI), children ages 5–17 years.
Table 3. Relative risk of infection during in-school and out-of-school sessions, by age group

Statistically significant (P < 0.05) risk ratios shown in bold.
*P-value < 0.05
**P-value < 0.01
For patients 18–24 years, risk ratios were 1.18 (1.06–1.31) and 1.13 (1.02–1.26) for the first and second weeks of school, respectively. For patients 25–64 years, the risk ratio for the first week of school was 1.16 (1.06–1.27).
There was no increase in risk ratio for out-of-school sessions for any age group with the exception of children 0–4 years, which showed a risk ratio of 1.14 (1.03–1.27) during the second week following the conclusion of the school year. Adults older than 65 did not show increased relative rates at any point during the year when adjusting for school attendance.
Temperature and relative humidity
Once annual seasonality was modelled, neither temperature nor relative humidity was significantly associated with additional risk of infection (P > 0.05 in all age groups). These findings suggest that longer-term seasonal patterns are the predominant factors influencing disease activity and that these seasonal differences cannot be explained by short-term changes in temperature and/or relative humidity.
Discussion
This study showed that the start of school sessions plays a significant role in seasonal outbreaks by increasing the risk of all-cause, medically attended ARIs. The effect is most pronounced in children 5–17 years, but is also seen in children 0–4 years and adults 18–64 years, which may suggest secondary household transmission. Comparisons among risks for differing age groups showed little difference for each of the time periods.
We used all-cause respiratory infection diagnoses as a proxy measure for ARI activity within a specific region to allow for an upper limit of respiratory pathogen activity. We included pneumonia and otitis media, as these diagnoses are often associated with viral aetiologies. For example, influenza vaccines reduce episodes of otitis media in children by 83% during the influenza season [Reference Heikkinen24]. Utilising a common measure, however, prevents assessment of contributions from specific pathogens which may impart a stronger correlation with school attendance [Reference McLean25]. Other factors may have also influenced risk ratios. First, we used a wide-rage age category (25–64) based on the US Influenza Sentinel Providers Surveillance Network, which may have significantly affected the estimate of impact in younger adults, especially in parents of school-aged children. Second, we used a school calendar with mostly uniform annual autumn start dates and spring end dates. However, we could not account for spring school breaks, which may hamper transmission through school closure or conversely lead to higher risk due to increased travel [Reference Polgreen26]. Post-hoc graphical analysis demonstrated a consistent reduction in ARI visits for individuals age 5–17 years during the five potential weeks of spring break. Accordingly, our approach is conservative and likely underestimates school effect for the 5–17 year group. Parents may also be less likely to present to clinics during winter breaks either due to changes in care seeking behaviour or clinic closure.
Consolidating ARI aetiologies into a single category may also mask the contribution of temperature and humidity observed when studying specific pathogens. Enveloped viruses, for example, are known to be highly infectious at low relative humidity, whereas non-enveloped rhinoviruses have increased transmissibility at high relative humidity [Reference Karim14]. Because outbreaks of these viruses peak at different times and frequently overlap, underlying weather effects may be obscured. Further, the relationship between meteorological variables and virus infectivity may not be monotonic. Recent studies of influenza demonstrated a complex relationship to relative humidity [Reference Lowen12, Reference Hanley and Borup27], and other meteorological variables such as absolute humidity can explain the seasonality of influenza in temperate climates [Reference Shaman28]. Nevertheless, temperature and relative humidity are principal attributes of seasonality in temperate latitudes. Hence, the driving influences of these climatic factors were statistically accounted for by incorporating a seasonal term in the analysis. We were not able to isolate a significant role for short-term fluctuations in temperature and relative humidity.
Improved predictive models may allow forecasting of the anticipated volume of medically attended ARI visits, thus, allowing appropriate deployment of medical resources. Coupled with advanced community surveillance [Reference Fowlkes29], public health mitigation efforts for significant outbreaks of respiratory infection may be more feasible. For example, if school exposures are shown to be an important cause of seasonal respiratory infectious disease outbreaks, then appropriately timed temporary school closures may be an effective way of disrupting local seasonal or pandemic outbreaks [30]. School closure appeared to be effective in preventing the spread of both severe acute respiratory syndrome [Reference Chan31] and H1N1 influenza [Reference Calatayud32–Reference Copeland34]. Future research on seasonality and the contribution from school attendance will both help to establish a causative link and may improve predictive models for specific pathogens.
Author ORCIDs
Jonathan Temte, 0000-0001-7097-583X.
Acknowledgements
Chuck Illingworth, MS, was responsible for initial programming and extraction of electronic health record data collection. We are indebted to Dr Amra Uzicanin for her valuable comments on this manuscript. Cristalyne Bell, BS, assisted with manuscript revision.
Financial support
This work was supported by a small grant provided to the authors by the University of Wisconsin School of Medicine and Public Health, Department of Family Medicine and Community Health.
Conflict of interest
All authors have reported no conflict of interest. All authors have signed the ICMJE Form for Disclosure of Potential Conflicts of Interest.


