Introduction
Ice masses are generally considered to move through a combination of three processes: ice deformation, subglacial sediment deformation and basal sliding. The latter process, however, is still poorly understood in detail, restricting its treatment in models of ice motion. Obtaining reliable empirical data relating to basal sliding is difficult, both in the field (due to the inaccessibility of the ice–bed interface) and in the laboratory (due to the requirement for a realistic scale of operation and precise stress and temperature boundary conditions). This lack of empirical data contrasts with basal sliding theory, which has remained little changed since the process was initially considered some 40 years ago in terms of enhanced ice deformation and regelation (e.g. Reference WeertmanWeertman, 1957, Reference Weertman1964; Reference KambKamb, 1970). Both of these theoretical sliding mechanisms result from stress variability within basal ice as it flows over subglacial bedrock hummocks. In the case of enhanced ice deformation, local stoss-face stresses supplement the ambient basal shear stress, increasing the local strain rate accordingly. Since ice velocity is proportional to strain rate multiplied by distance, enhanced ice-deformation speed is considered to be greatest around large bedrock hummocks. In contrast, regelation sliding occurs as a result of the pressure dependence of the melting point of ice. In this case, enhanced stoss-face pressures lower the melting point of ice, causing already temperate ice to melt, either at the ice–bed interface or just within the basal ice (Reference LliboutryLliboutry, 1993). The meltwater flows as a film along the local pressure gradient to the lee side of the bump, where local pressure is lower, the melting point raised and the water refreezes. Refreezing releases latent heat of fusion, which is conducted back through the rock to the stoss face, where it fuels further melting. Thus, the smaller the bump the more rapid the heat transfer and the greater the regelation sliding velocity.
Although the theoretical distinction between regelation and enhanced ice deformation is clear, their actual operation and interplay at the beds of temperate glaciers are poorly understood. In this paper I present field data from an instrument designed to record simultaneously high-resolution time series of ice motion at multiple locations just above the ice–bed interface. These data may be directly relevant to theoretical treatments of the relative contributions of enhanced ice deformation, regelation and pure slip at hard glacier beds. The instrument was installed in an ice-marginal basal cavity at Glacier de Tsanfleuron, Switzerland, during late summer 2000.
Field Site and Methods
Glacier de Tsanfleuron is located to the northwest of Sion, Switzerland. The glacier has a surface area of ∼4 km2 and extends from ∼2420 to ∼2900 m a.s.l. (Fig. 1). It has been widely studied in terms of its basal ice layers (e.g. Reference Hallet, Lorrain and SouchezHallet and others, 1978; Reference Lemmens, Lorrain and HarenLemmens and others, 1983; Reference Souchez and LemmensSouchez and Lemmens, 1985; Reference Tison and LorrainTison and Lorrain, 1987; Reference Hubbard and SharpHubbard and Sharp, 1995), internal ice composition (Reference Hubbard, Tison, Janssens and SpiroHubbard and others, 2000a; Reference Tison, Hubbard, Maltman, Hubbard and HambreyTison and Hubbard, 2000) and hydrochemistry (e.g. Reference Fairchild, Bradby, Spiro, Deynoux, Miller, Domack, Eyles, Fairchild and YoungFairchild and others, 1993, Reference Fairchild, Bradby, Sharp and Tison1994, Reference Fairchild, Killawee, Hubbard and Dreybrodt1999a, Reference Fairchildb). The extensive proglacial (Cretaceous limestone) bedrock plateau exposed by the glacier’s post-Little Ice Age retreat has also been studied in terms of its surface geomorphology and distinctive carbonate crusts (Reference Sharp, Gemmell and TisonSharp and others, 1989, Reference Sharp, Tison and Fierens1990; Reference Fairchild, Bradby, Spiro, Deynoux, Miller, Domack, Eyles, Fairchild and YoungFairchild and others, 1993; Reference Hubbard and HubbardHubbard and Hubbard, 1998; Reference Hubbard, Siegert and McCarrollHubbard and others, 2000b).
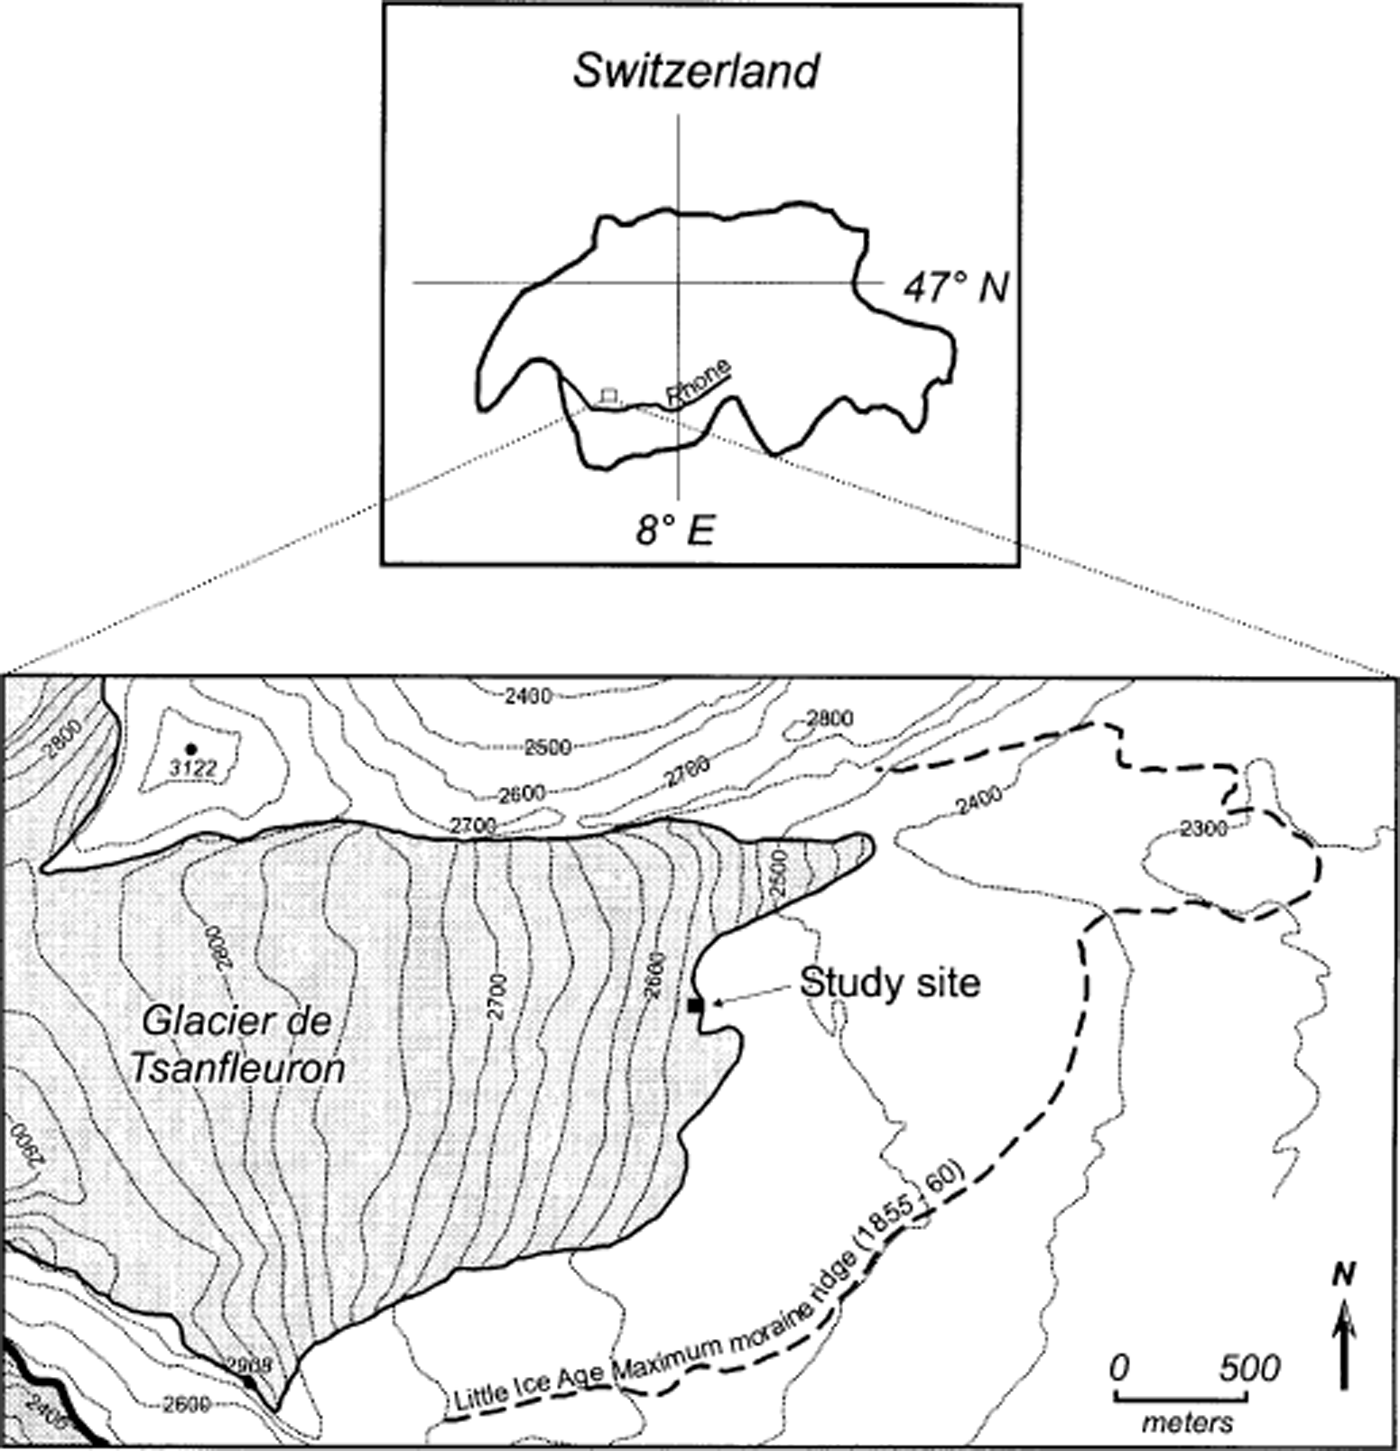
Fig. 1. Glacier de Tsanfleuron, Switzerland, and the location of the cavity within which the investigation was carried out.
The instrument constructed for the present study represents an adaptation of the principle employed in borehole- based drag spools (Reference Blake, Fischer and ClarkeBlake and others, 1994). The instrument comprises a fixed, rigid mast that houses five potentiometers, each attached via a rotating spool (22 mm diameter) and a length of (non-stretchable) cord to an anchor that is initially inserted ∼15 cm distant into the adjacent ice wall (Fig. 2). As the ice moves, each anchor advances and rotates the spool around which its cord is wound. This rotation is registered on the attached potentiometer, and the resulting resistance is recorded on a micro-logger housed within the cavity. The voltage drop across each potentiometer was recorded every 10 s, and output averaged every 120 s between decimal days 229 (17 August) and 236 (24 August), 2000. Spools and potentiometers were pre-calibrated (from measured potentiometer resistance to spooled distance) in the laboratory. Micro-loggers were programmed to record at high resolution (yielding a resolution that was always ≤0.001 mV, depending on the measurement range adopted), and the mechanical potentiometers yielded a voltage change of 25 mV for each ( ∼70 mm) spool rotation. This combination yielded an electronic measurement sensitivity that was better than 0.005 mm. The mast was installed ∼15 m into a natural basal cavity at the frontal margin of Glacier de Tsanfleuron (Figs 1 and 3a), where it was bolted securely, by two legs oriented in orthogonal directions, to the bedrock floor (Fig. 3b). Cord paid out from each spool was attached via anchors inserted to a depth of ∼150 mm into the approximately vertical adjacent ice wall composed of clear-facies basal ice (Reference Hubbard and SharpHubbard and Sharp, 1995) (Fig. 3c). Anchors were attached at heights of ∼25 mm (anchor 1), ∼60 mm (anchor 2), ∼115 mm (anchor 3), ∼195 mm (anchor 4) and ∼265 mm (anchor 5) above the ice-bed interface. Since no anchor could be placed precisely in the same horizontal plane as the point at which its cord left the potentiometer spool, readings included a geometrical error related to variations in the deviation of these cords from horizontal. However, none of these deviations was considered to be >5°, yielding a maximum geometrical error (that was consistent and specific to each anchor) of <0.5% of spooled distance. The study site was located sufficiently far into the cavity to have been isolated from warming and melting by influent warm air, and no melting was observed in the vicinity of the experiment over the period of investigation. The thickness of the overlying ice is estimated to be 5–7 m.
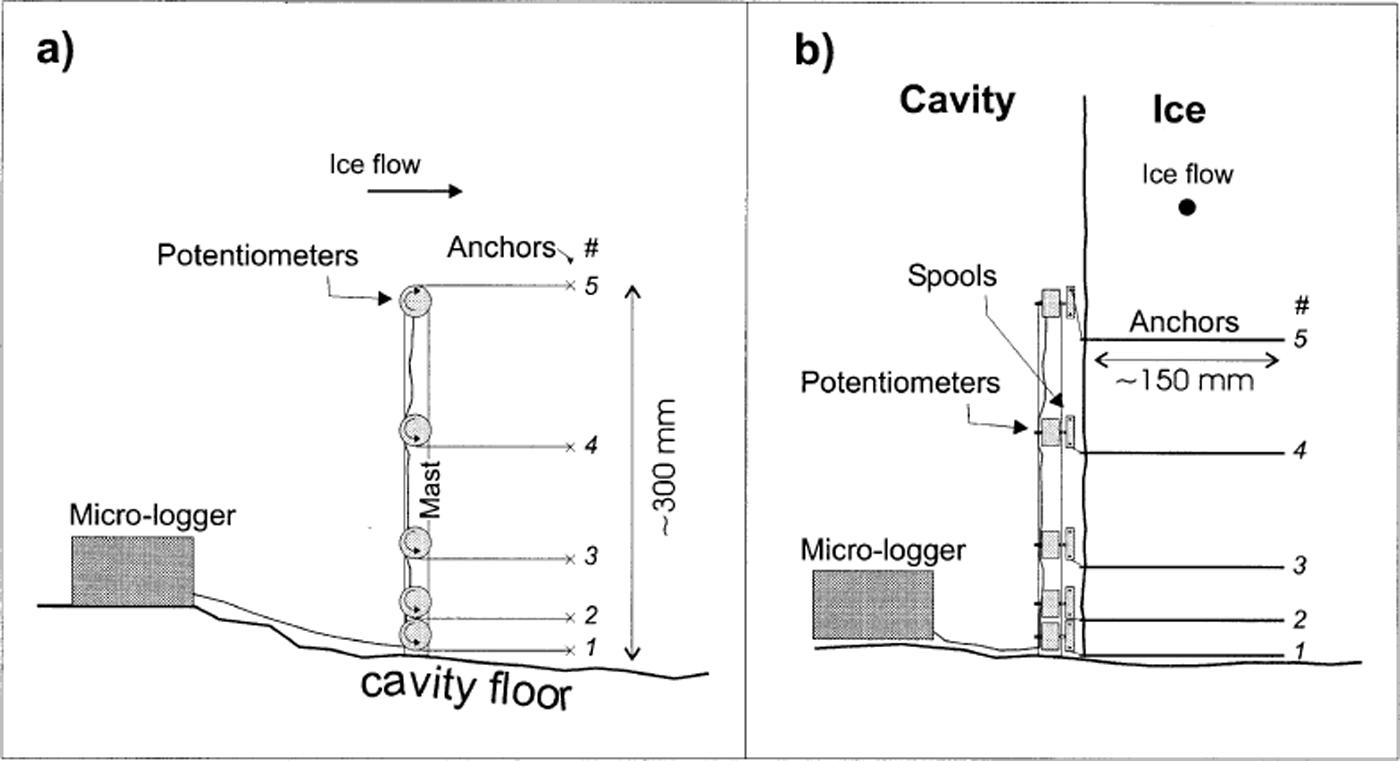
Fig. 2. Schematic illustration of the instrument constructed for this study and installed within a cavity at the bed of Glacier de Tsanfleuron: (a) side view (ice moving left to right); (b) front view (ice moving towards viewer). Anchors are labelled 1–5 in accordance with the analysis.
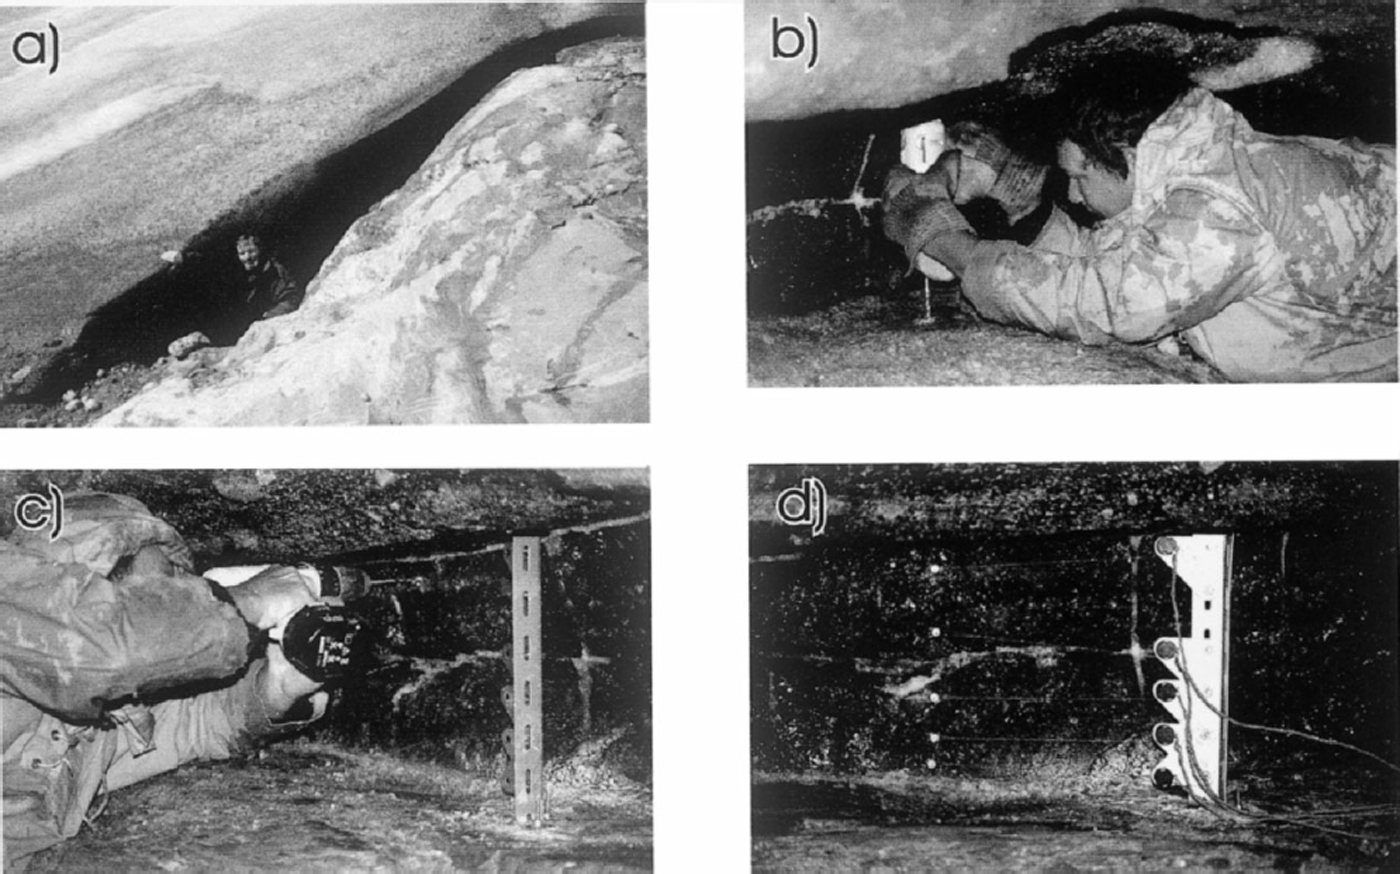
Fig 3. Instrument installation: (a) cavity entrance at frontal margin of Glacier de Tsanfleuron; (b) drilling emplacement bolts into bedrock; (c) drilling anchor holes into adjacent ice wall; (d) mast and anchors in place (ice flow from right to left).
Method-related signal variations due to the potentiometers, spools and cord were investigated in the laboratory by attaching a cord from a firmly anchored potentiometer to a clockwork, rotating cylindrical drum. While the velocity of this anchor (∼30 mm d−1) was broadly similar to that expected at the bed of Glacier de Tsanfleuron, it was also expected to be both systematically variable and noisy (reflecting the mechanical motion involved).
Results
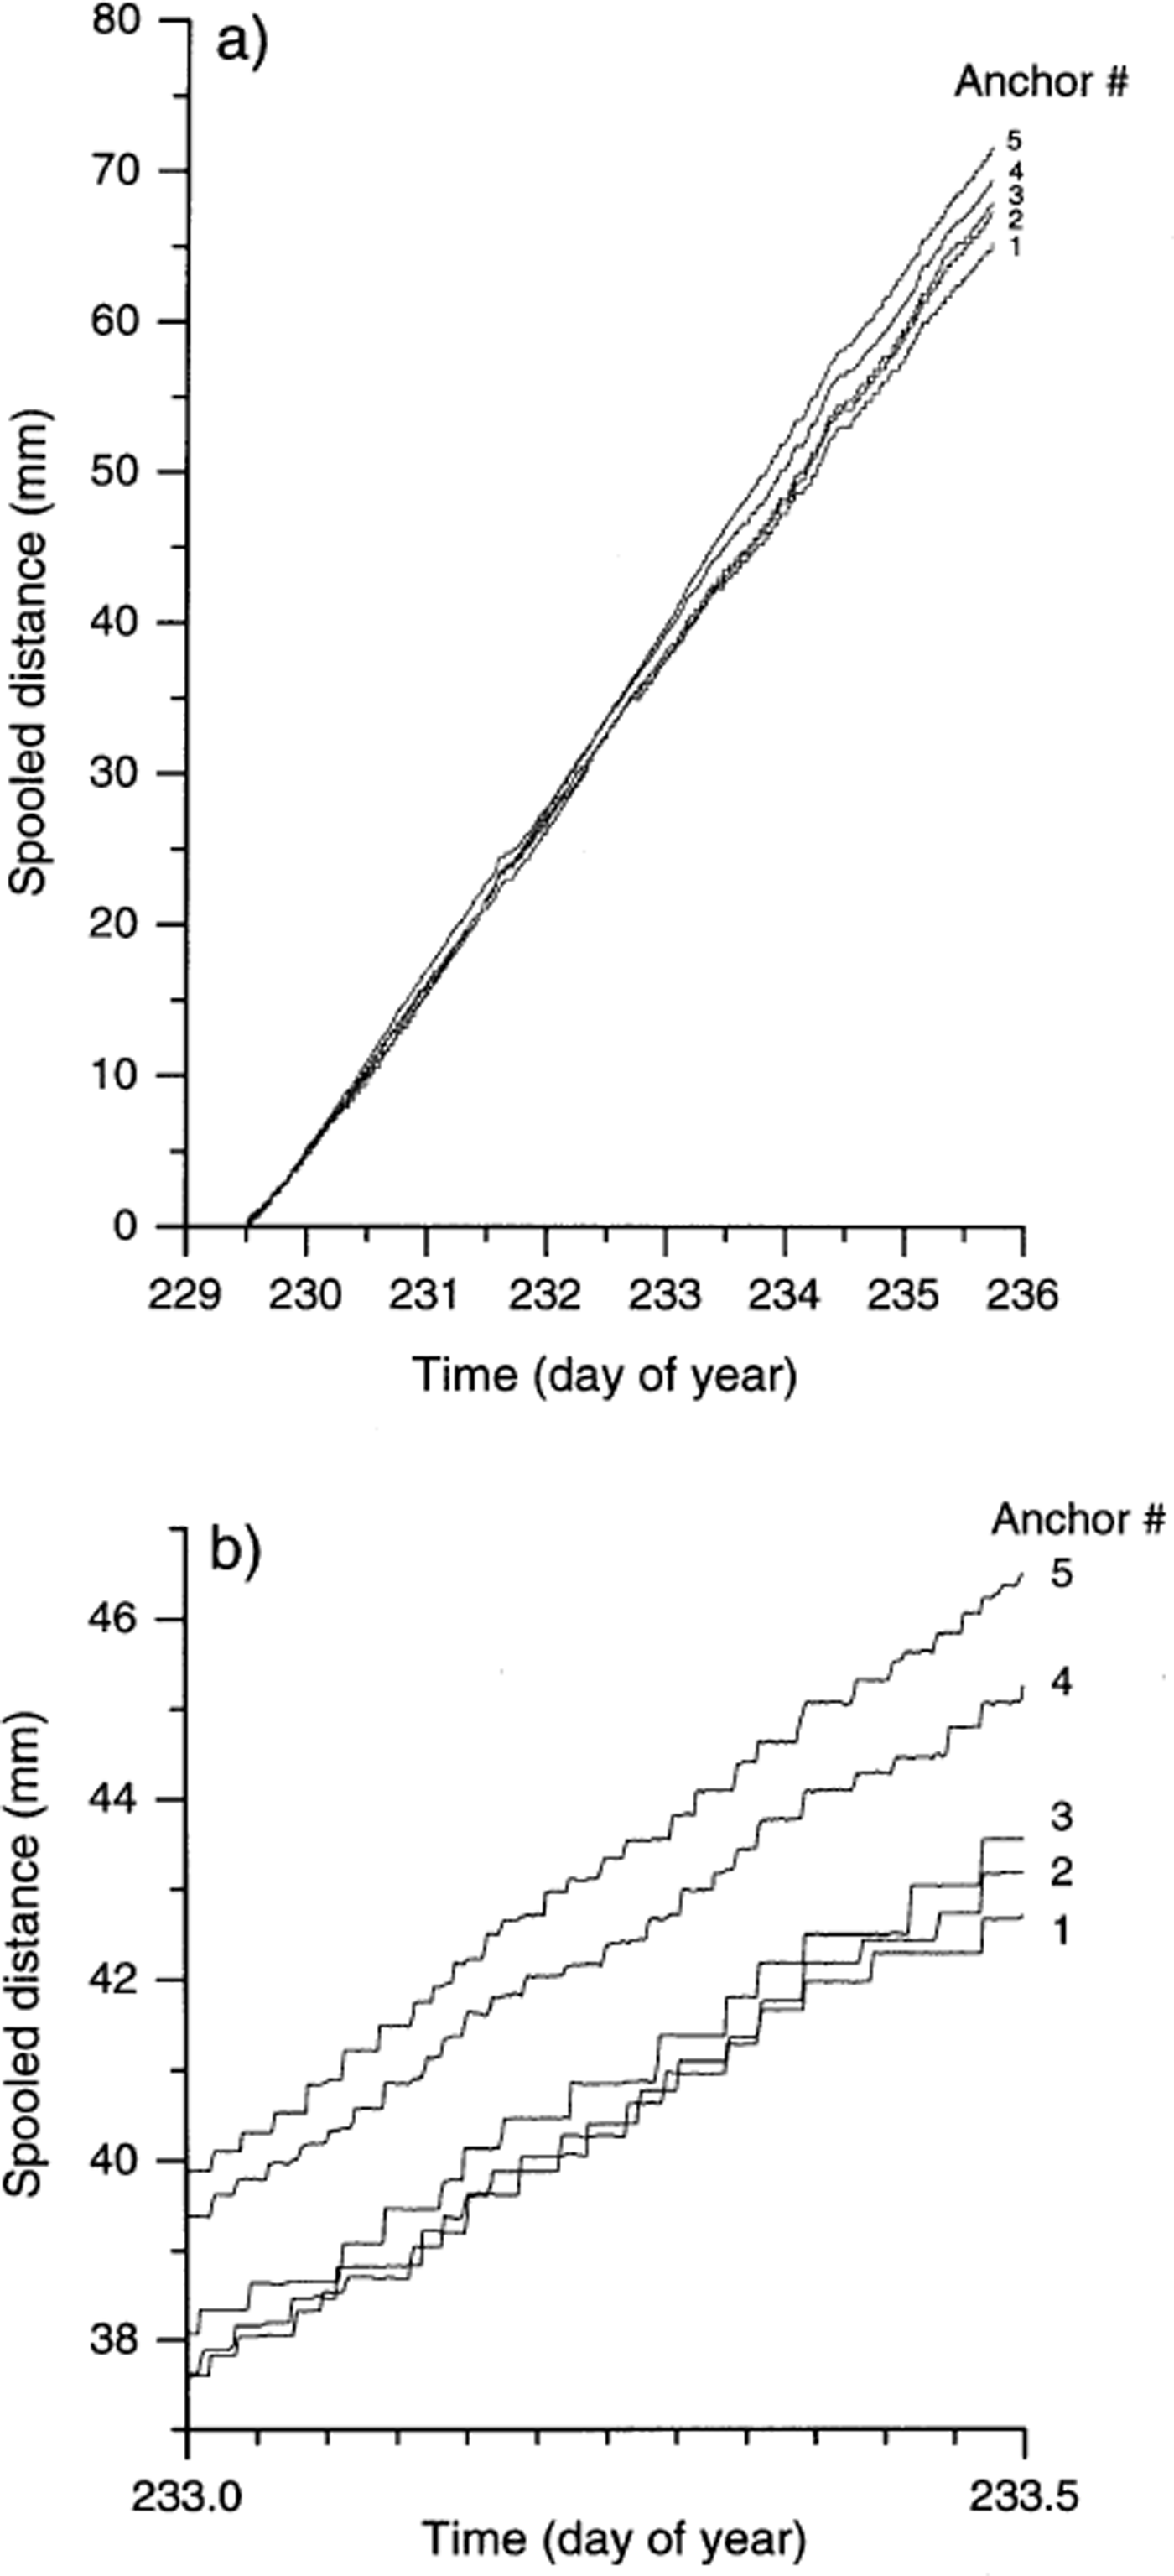
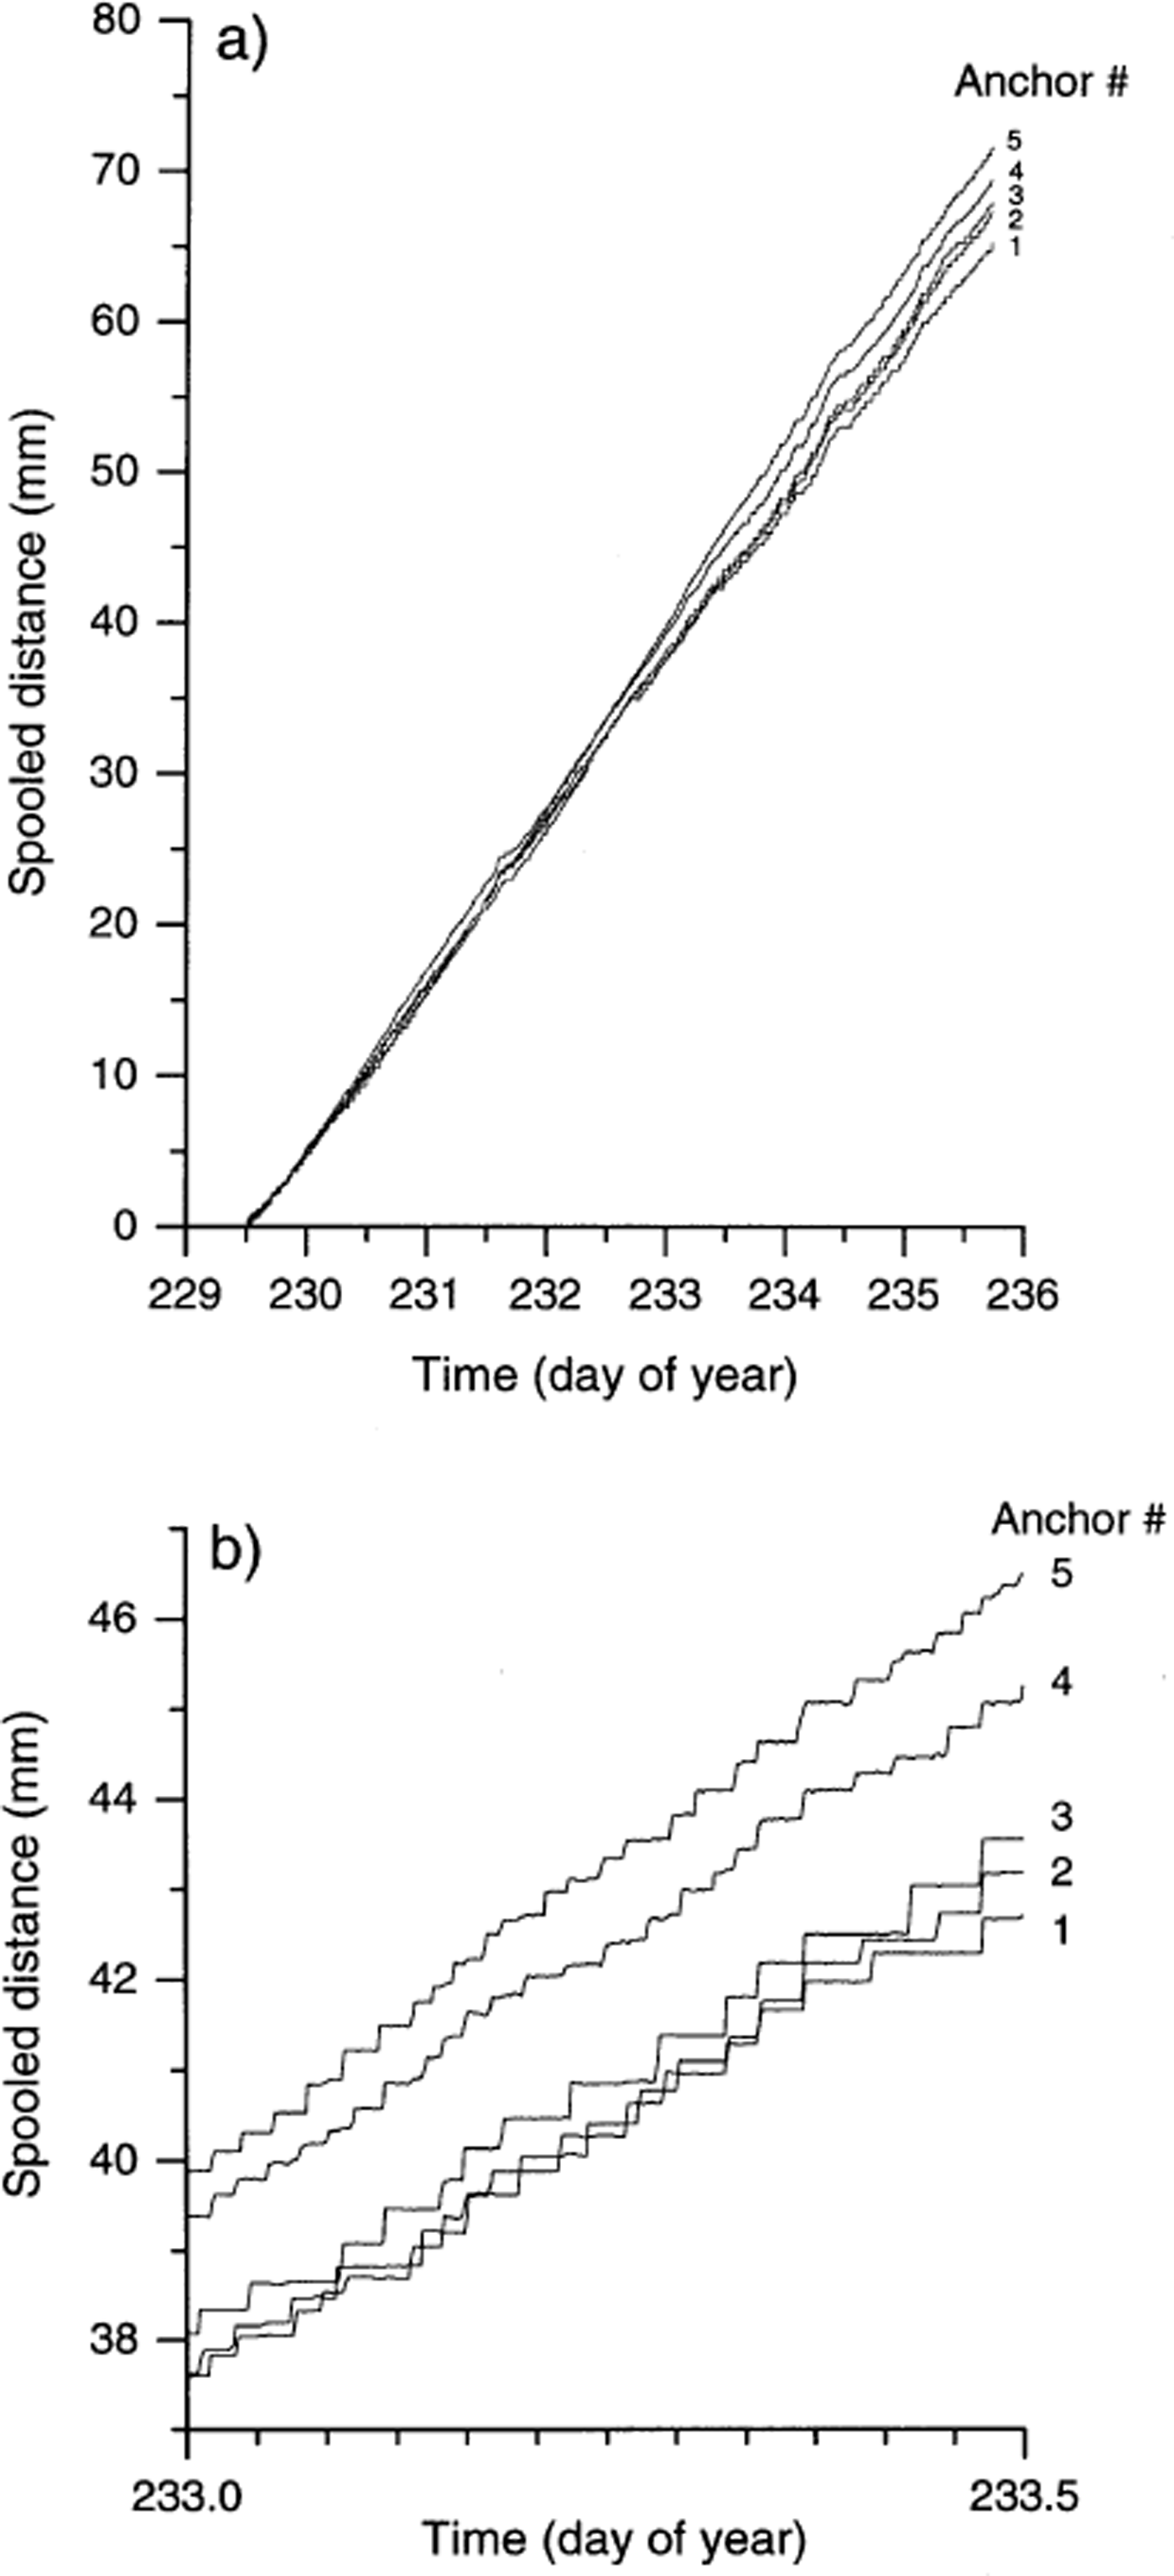
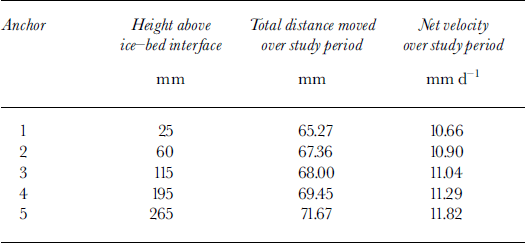
Potentiometer records indicate that each of the five anchors moved approximately 65–75 mm down-glacier over the ∼6 day survey period (Fig. 4). These data also reveal systematic differences in the distances moved by individual anchors, with the lowermost anchor (anchor 1) moving the shortest distance (65.3 mm), and the uppermost anchor (anchor 5) moving the longest distance (71.7 mm) (Table 1). These distances correspond to net anchor velocities of 10.66–11.82 mm d−1, respectively (Table 1), with the mean anchor velocity for the entire dataset being 10.93 mm d−1. Plotting the net velocity of each anchor against its distance from the ice–bed interface indicates an approximately linear increase in velocity between anchor 1, located ∼25 mm above the bed, and anchor 5, located ∼ 265 mm above the ice–bedrock interface. Extrapolating the best-fit straight line through these points (determined by least-squares linear regression) to the glacier bed indicates a velocity of 10.55 mm d−1 at a height of zero (Fig. 5).
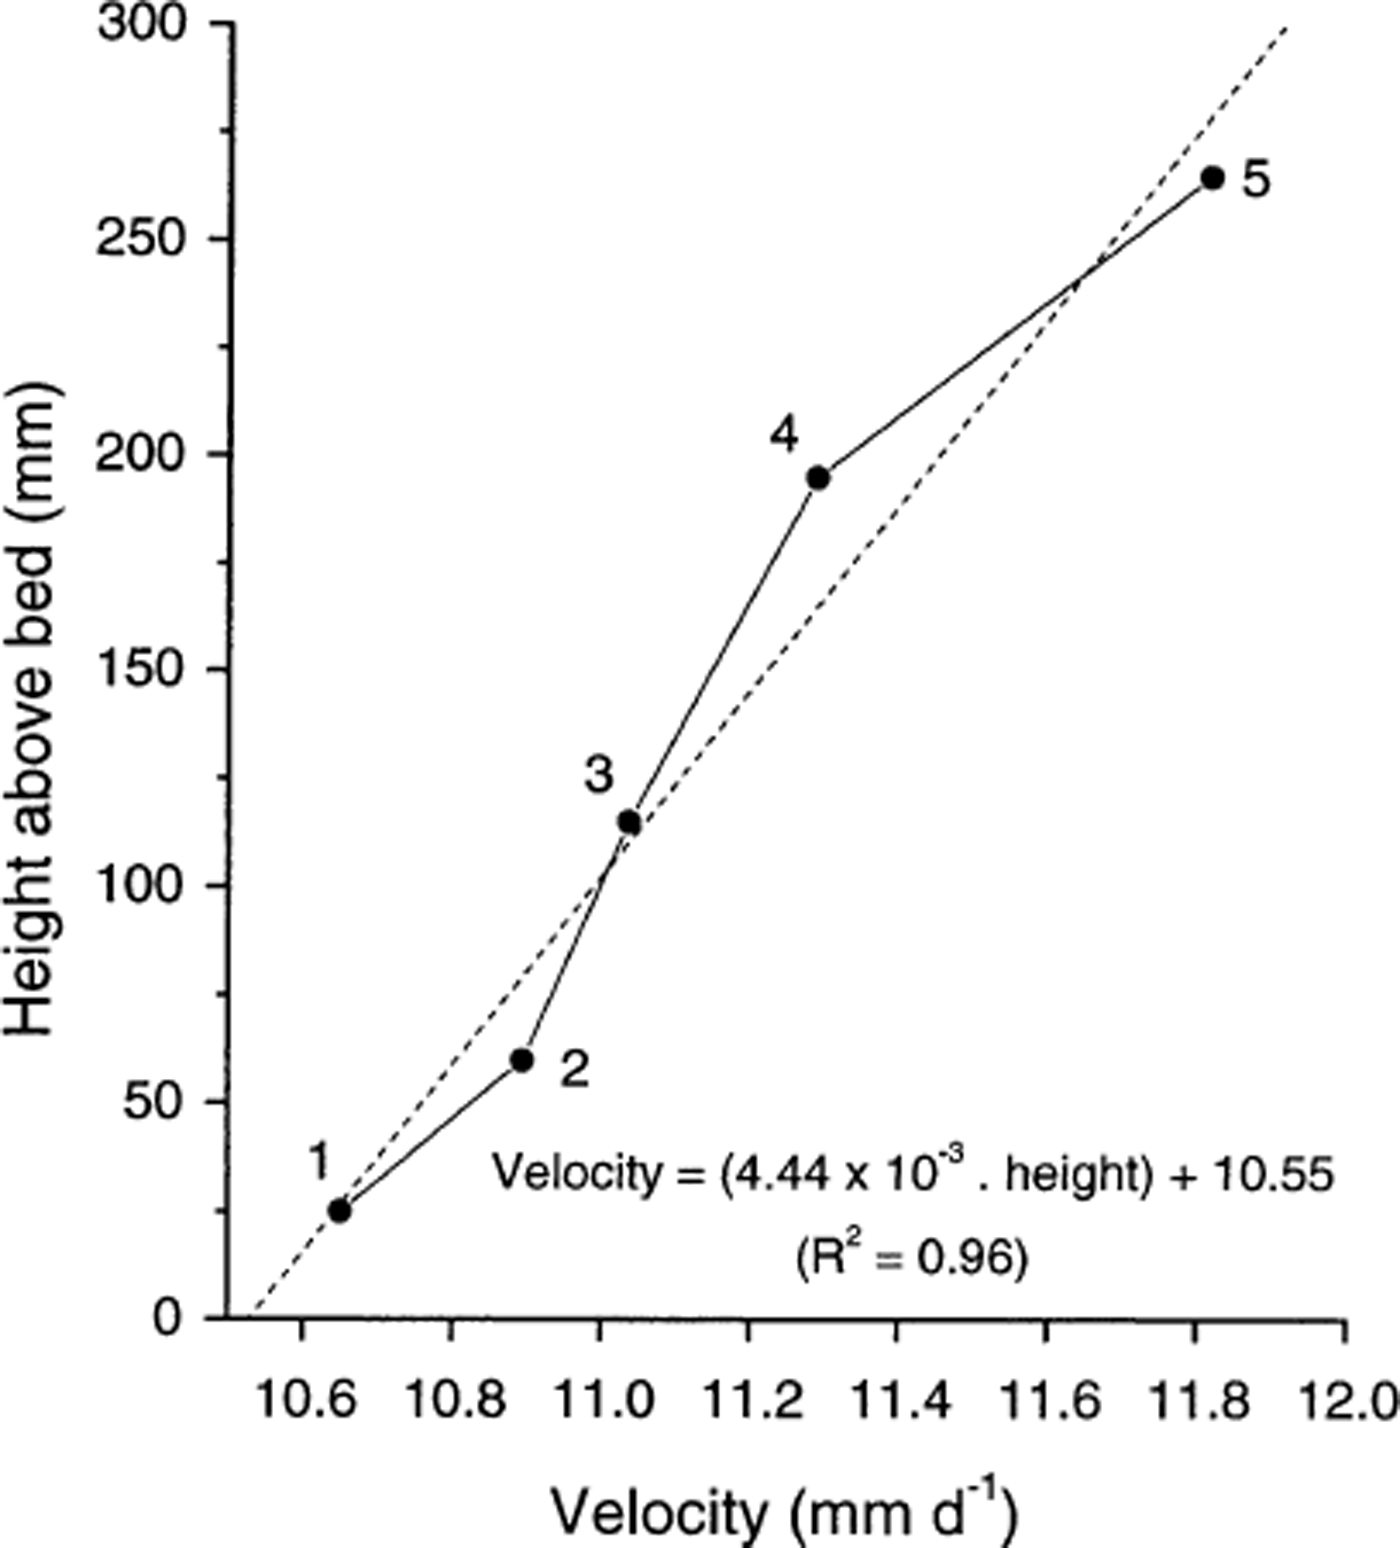
Fig. 5. Mean anchor velocity over the ∼6 day study period plotted as height above the ice-bed interface. The best-fit straight line illustrated is fit by least-squares linear regression.
Table 1. Anchor heights above the ice-bed contact, net anchor distance moved and net anchor speed over the ∼6 day period
Close investigation of the potentiometer data reveals marked differences in the movement records of each anchor. First, plots of the residuals from the best fit line of distance against time for each anchor (Fig. 5) are presented in Figure 6. Variations in these residuals indicate that none of the anchor velocity records is temporally constant, but that all records are characterized by distinct periods of relatively rapid motion and relatively slow motion (Fig. 6). For example, all five anchors experienced a dramatic velocity excursion (relative to their net, ∼6 day velocities) between 0400 and 1300 h on day 234: dramatically increased instantaneous velocities were recorded from ∼0400 to ∼1000 h (marked “speed-up” in Fig. 6), and dramatically decreased velocities were recorded between ∼1100 and ∼1300 h (marked “slow-down” in Fig. 6). Each of these hours-long velocity excursions was recorded consistently by all five anchors. Second, since distance data were recorded every 120 s, it is possible to calculate the velocity of each anchor over each 120 s period over the total ∼6 day survey period (Fig. 7). In this case, all five records reveal major variations in velocity, fluctuating for any given 120 s period between 0 and >400 mm d−1. Visual assessment of Figure 7 indicates that the nature of the velocity record involves relatively extended periods of zero motion punctuated by discrete, short-term velocity “events”. Detailed investigation of a representative short-term period of these velocity records (Fig. 8) indicates that, while many events are recorded simultaneously by all five anchors (marked A in Fig. 8), velocity peaks may also be recorded by any single anchor in apparent isolation from the remaining four anchors (marked B in Fig. 8). Visual assessment of Figure 8 indicates that approximately 50% of all large motion events are recorded by all five anchors, and that individual velocity events may last for more than one (120 s long) sampling period (marked C in Fig. 8). This pattern contrasts strongly with that of the single anchor established as a laboratory control, presented in Figure 9. Although both the laboratory and the field data are characterized by broadly similar spooling rates (cf. Fig. 9a with Fig. 4), individual velocity records contrast sharply over scales of both hours (cf. Fig. 9b with Fig. 7) and minutes (cf. Fig. 9c with Fig. 8). Although the laboratory record is variable and noisy, it is characterized by neither extended periods of apparently zero motion nor shorter periods of significantly higher velocities.
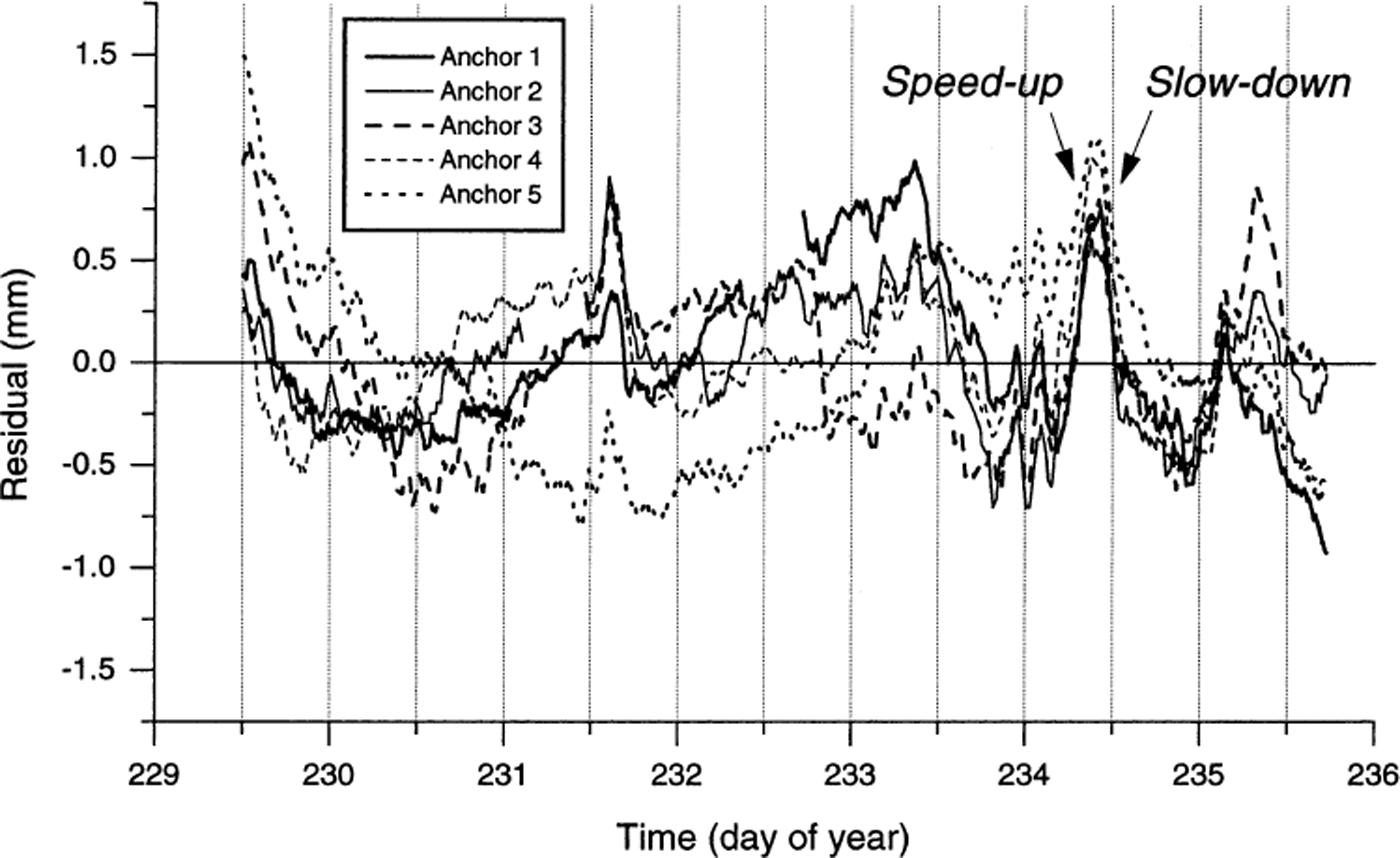
Fig. 6. Residual distance from the best-fit straight line presented in Figure 5. Illustrative periods when allfive anchors record rapid ice motion and slow ice motion relative to the ∼ 6 day average are labeled “speed-up”and “slow-down”, respectively.
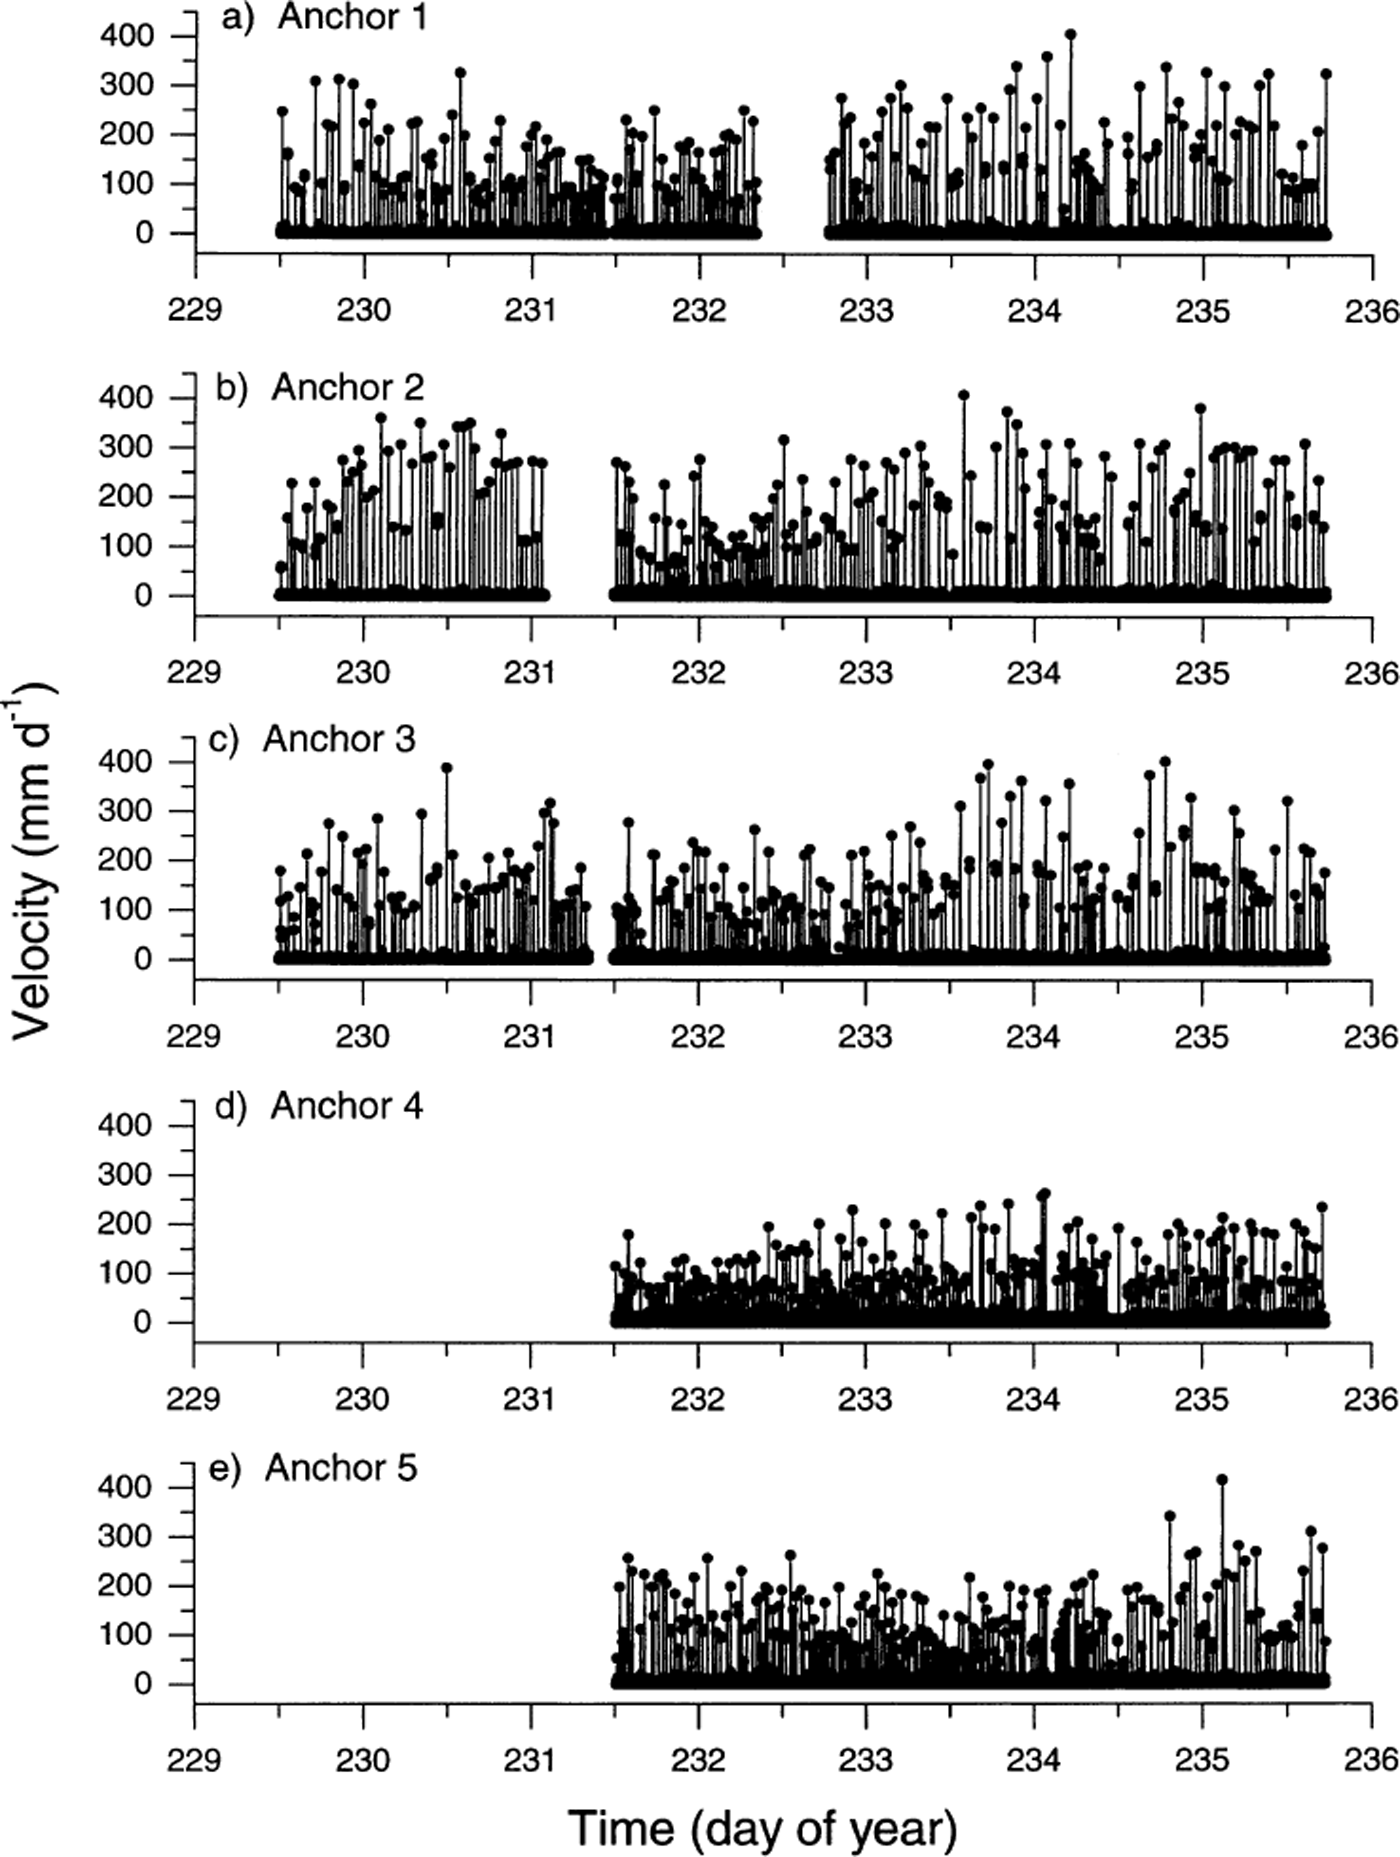
Fig. 7. Reconstructed velocities (expressed in mm d−1) for each 120 s logging period over the ∼6 day study: (a) anchor 1; (b) anchor 2; (c) anchor 3; (d) anchor 4; (e) anchor 5. Gaps in the records reflect either loss of sufficient resolution in the logged distance data to generate velocities or more general data-collection and transfer problems.
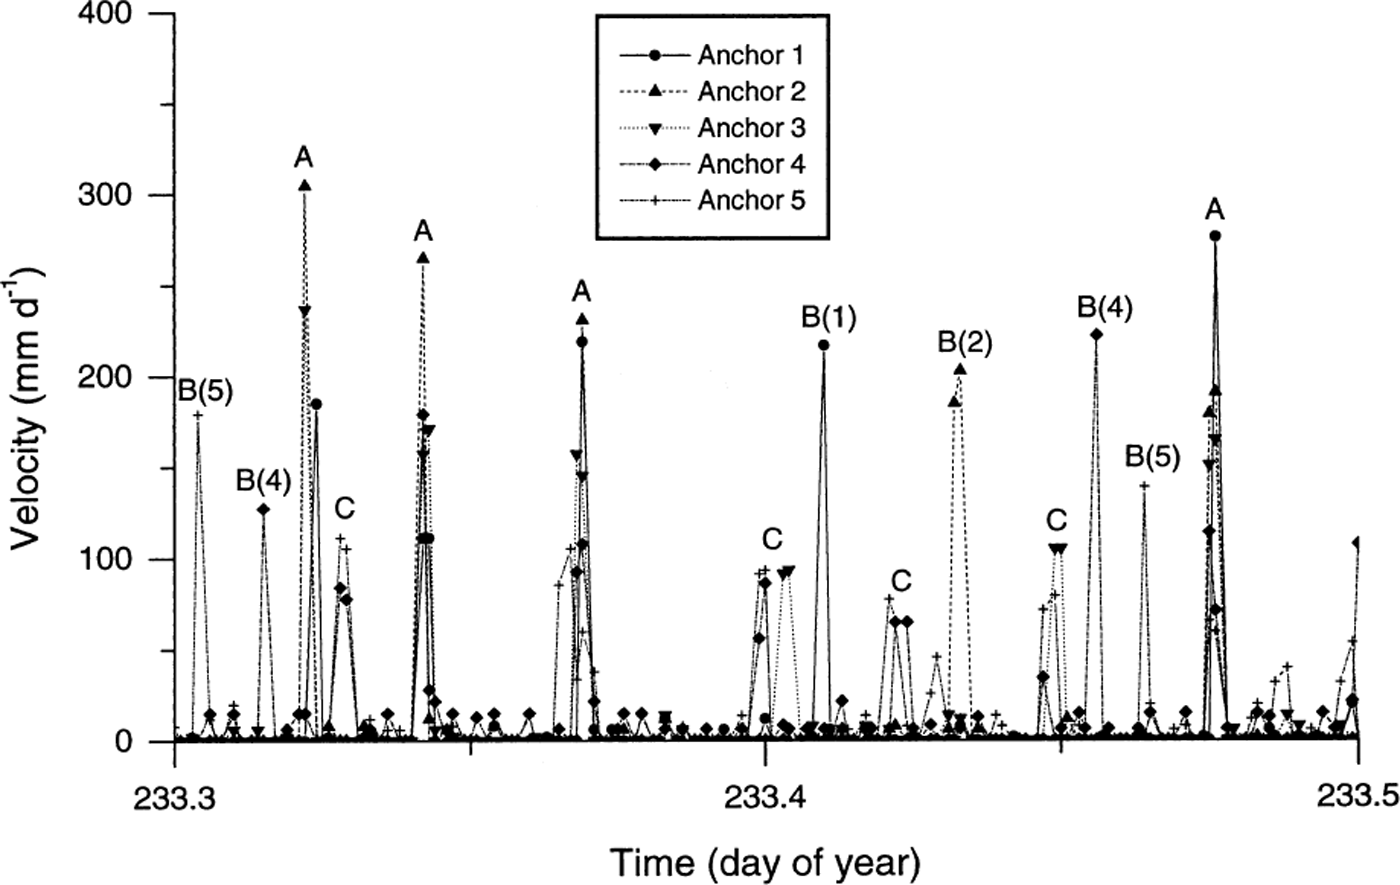
Fig. 8. Reconstructed velocities (expressed in mm d−1) for each 120 s logging period over a selected representative interval of 0. 2 day. Labels represent events that are registered by all of the anchors (A), events that are registered by only one of the anchors (B followed by anchor number in parentheses), and events that last for more than one logging interval (C).
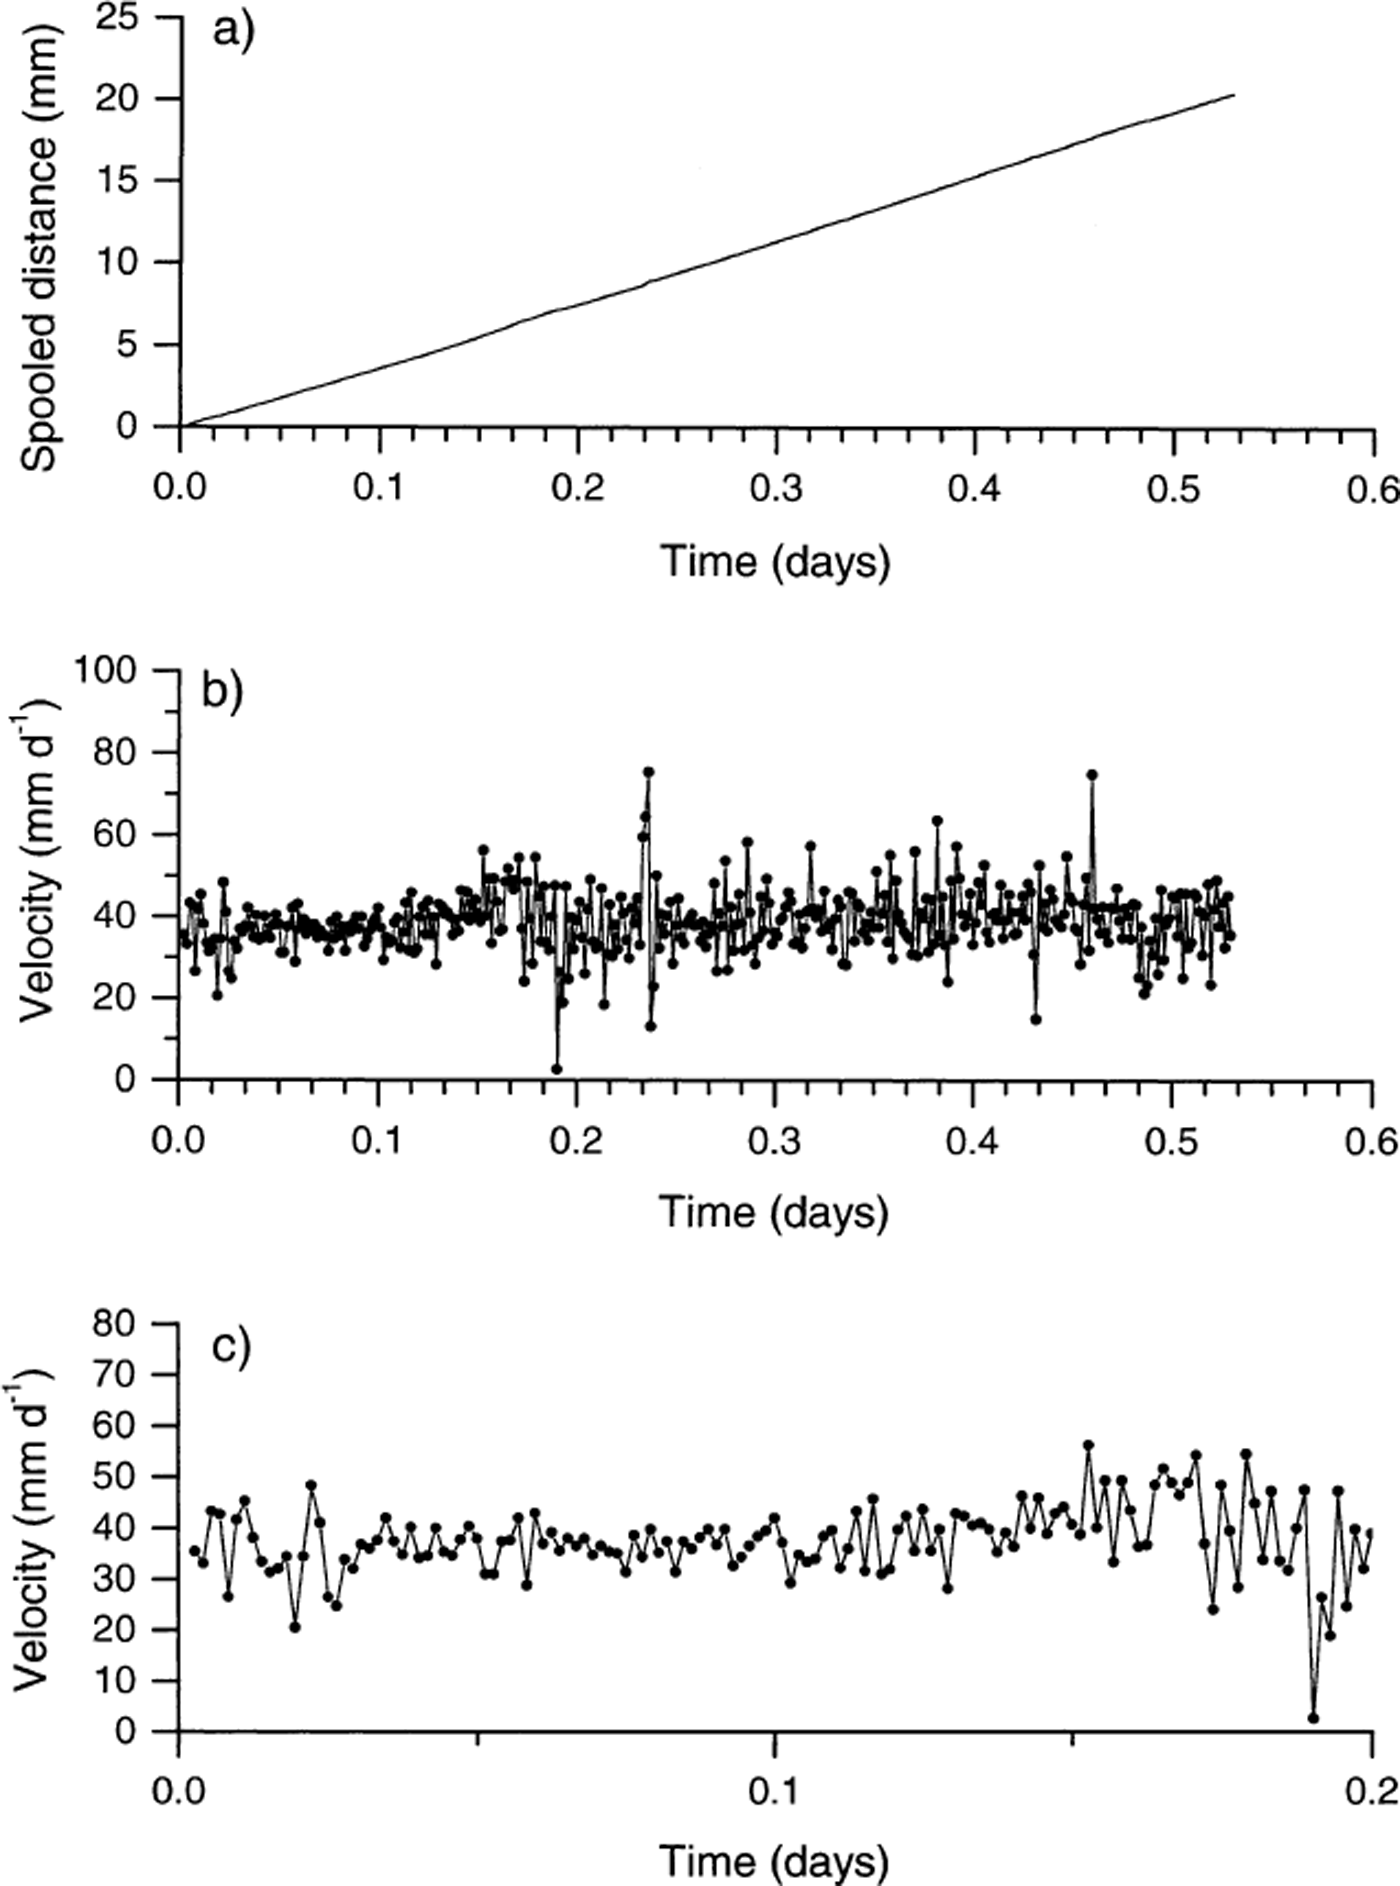
Fig. 9. Control record from a single potentiometer, spool and cord, logged at the same resolution as at Glacier de Tsanfleuron. The record comprises: (a) distance spooled over a 0.5 day period; (b) velocity over a 0.5 day period; and (c) detail of velocity over a 0.2 day period.
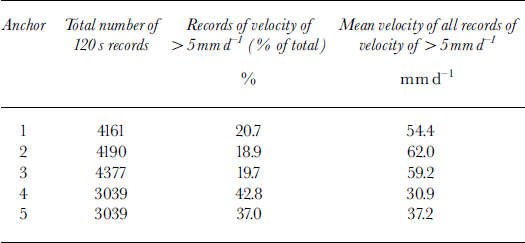
The discrete velocity events recorded at the glacier may be investigated further through histograms of their magnitude for each anchor (Fig. 10). A visual assessment of Figures 7 and 10 suggests that the nature of the velocity responses may be fundamentally different between certain of the anchors. In particular, anchors located closer to the glacier bed appear to be characterized by a lower frequency of higher-magnitude velocity events than anchors located further from the bed. This pattern is explored by calculating the number, and mean value, of individual velocity records of greater than the overall average velocity (10.93 mm d−1) for each anchor (i.e. only “events” of >10.93 mm d−1 are considered in the analysis). These data are summarized in Table 2, indicating that a markedly higher percentage of the total number of records register as velocity events for anchors 4 (22%) and 5 (17%) than for anchors 1 (10%), 2 (9%) and 3 (10%). As expected from consideration of these frequencies and the net sliding velocities over the ∼6 day measurement period, the mean magnitude of each of these events is correspondingly lower for anchors 4 (54 mm d−1) and 5 (75 mm d−1) than for anchors 1 (103 mm d−1), 2 (119 mm d−1) and 3 (107 mm d−1).

Fig. 10. Histogram of the magnitude of all individual motion events identified in the velocity records of each anchor: (a) anchor 1; (b) anchor 2; (c) anchor 3; (d) anchor 4; (e) anchor 5.
Table 2. Summary 120 s velocity data recorded over the ∼6 day period
Discussion
Several of the results presented above warrant further discussion. First, it is worth noting that the velocity of ∼10.55 mm d−1 calculated at the ice–bed interface is determined by extrapolating the quasi-linear velocity pattern measured between ∼25 and ∼265 mm above the bed linearly to the bed. Such extrapolation may not be justified, particularly if a rapid increase in ice velocity occurs below the lowermost anchor in the study (i.e. within the basal ∼25 mm). Enhanced velocities are possible in this interfacial zone in response to, for example, very high local stresses and regelation within the basal ice concerned (Reference LliboutryLliboutry, 1993). However, no marked non-linear increase in velocity was recorded towards the base of the existing anchor array (e.g. Fig. 5), suggesting that it is unlikely that all 10.55 mm of motion per day is accommodated in the basal ∼25 mm of ice. It is therefore considered likely that significant motion does occur as slip at the ice-bed interface in this marginal zone of Glacier de Tsanfleuron. This may be considered as a “true” sliding velocity at the study site.
The manner in which the net basal motion is achieved is non-uniform, varying both through time and with elevation above the glacier bed. High-resolution time series, recorded every 120 s for each anchor, indicate that this net velocity is achieved through discrete, short-term (less than one 120 s interval to a maximum of three measurement intervals) events separated by longer periods (lasting from tens of minutes to hours) of little or no motion. A number of factors indicate that these velocity patterns are not method-related artifacts, but reflect real velocity variations in this frontal area of the glacier. First, the electronic sensitivity of the system (comprising, amongst other things, the potentiometer sensitivity, the potentiometer spool diameter and the logger sensitivity) is markedly less than the speeds recorded. Second, controlled laboratory tests do not result in similar sporadic “events”, suggesting that the velocity events recorded in the field do not result from the accumulation and intermittent release of elasticity in the potentiometers, spools or cord used. The laboratory test, however, does not isolate the possibility that elasticity in the pin that attaches the anchor to the lateral ice wall or in the mast itself (the precise installation of neither of which could be recreated meaningfully in the laboratory) could be responsible for the non-steady record. Third, many of the discrete velocity events recorded at the glacier last for more than a single measurement time period, suggesting that the events do not reflect elastic recovery anywhere in the system, since such “snap-back” recovery would be expected to be completed more rapidly than >120 s. In the absence of any evidence to the contrary, the velocity patterns recorded for individual anchors at a 120 s time interval are therefore considered real. Significantly, these time-series data may be intimately linked to the observation that motion events recorded by anchors located closer to the glacier bed are generally larger and less frequent than those recorded by the anchors located further from the bed.
This apparently stick–slip motion (e.g. Reference Bahr and RundleBahr and Rundle, 1996; Reference Fischer and ClarkeFischer and Clarke, 1997) may reflect either corresponding temporal variability in the stresses acting on the ice or (more likely) a variable local response to more uniform stresses. The latter case seems likely considering the marginal location of the cavity investigated, and the high probability that much of the stress acting on the ice concerned was inherited from up-glacier. In such a situation, motion may be expected to occur as shear deformation within the ice or as slip at the ice–bed interface whenever and wherever the inherited stresses respectively exceed the local shear strength of the ice or the local basal shear traction. Indeed, each time such a strength threshold is breached, a discrete motion event would be expected, and those events would, in turn, feed back into the local stress field. Thus, in detail, a spectrum of stick–slip response patterns may be envisaged at the margin of Glacier de Tsanfleuron, depending on the magnitude of the local basal traction relative to the strength of the overlying ice. If basal tractional strength is low, the initial response may be for the ice to slip over the ice–bed interface, and for the overlying ice subsequently to be pulled along in response to that initial slip. In contrast, if the basal shear traction is relatively high, then the initial straining would be in the overlying ice. This ice deformation would increase the local basal shear stress until either all the inherited stress was accommodated by ice deformation or the local basal tractional strength was exceeded, and a discrete slip induced. According to this scheme, the observed pattern at Glacier de Tsanfleuron of fewer, larger motion events at the bed relative to within the overlying ice is consistent with a relatively high basal tractional strength. However, such an inference remains to be tested rigorously, since the 120 s temporal resolution of the data collected for the study currently precludes a detailed investigation of the timing of these motion events.
Summary and Conclusions
The first field application of an instrument designed to record basal ice deformation directly for a ∼6 day period at Glacier de Tsanfleuron has recorded basal ice moving at velocities that increase approximately linearly away from the ice–bed interface. These velocities increase from 10.65 mm d−1 25 mm above the ice–bed interface to 11.82 mm d−1 265 mm above the interface. Extrapolating this velocity pattern linearly to the bed suggests a true slip velocity of 10.55 mm d−1. Recorded velocities, however, are not uniform over time-scales of either hours or minutes. At the former time-scale, all five anchors record similar phases of rapid or slow motion relative to their average velocities for the ∼6 day time period. These patterns are not systematic and are perhaps related to meteorological or glaciological stimuli that were beyond the scope of the present study. At the time-scale of minutes, discrete velocity events may be recorded simultaneously by any number of anchors, although about 50% of such events involve the synchronous movement of all five anchors. The nature of these events indicates that much of the net basal motion is achieved by intermittent “slips” focused at the ice-bed interface that are damped with distance away from the interface, registering as more frequent, but smaller, events by 265 mm above the glacier bed.
The results and interpretations presented herein are based on a single (the first) field application, in an icemarginal location, of a hitherto untested instrument. Further study will focus on (1) obtaining higher-resolution data, (2) establishing the reproducibility of these specific patterns in a similarly accessible subglacial environment, and (3) evaluating the more general validity of these patterns in a wider range of subglacial environments.
Acknowledgements
The author wishes to thank S. Clemmens and S. Osborne for assistance in the field. The manuscript benefited greatly from comments by G. K. C. Clarke, U. H. Fischer and R. Naruse. The research was funded by a grant from the Research Fund of the University of Wales, Aberystwyth.


