Protein intake is associated with greater velocity of linear growth in childhood(Reference Hoppe, Molgaard, Thomsen, Juul and Michaelsen1) as well as with a more beneficial body composition(Reference van Vught, Heitmann, Nieuwenhuizen, Veldhorst, Brummer and Westerterp-Plantenga2–Reference Westerterp-Plantenga, Lejeune, Nijs, van Ooijen and Kovacs4). Some studies suggest that not only the amount of protein intake, but also the protein source have a regulatory effect on body growth; for instance, milk protein is strongly associated with growth in height when compared with meat or vegetable protein(Reference Hoppe, Udam, Lauritzen, Molgaard, Juul and Michaelsen5). Growth hormone (GH) and insulin-like growth factor-I (IGF-I) play a central role in the regulation of growth in height and width(Reference Hoppe, Udam, Lauritzen, Molgaard, Juul and Michaelsen5, Reference Rolland-Cachera6). Besides the important role of GH/IGF-I in regulating growth in height, it also regulates fat distribution and reduces fat mass (FM)(Reference Bengtsson, Brummer, Eden, Rosen and Sjostrom7). Studies show an increased lipolysis and decreased FM after GH administration(Reference Attallah, Friedlander and Hoffman8–Reference Snel, Brummer, Doerga, Zelissen, Bakker, Hendriks and Koppeschaar11). Dietary protein may be involved in secretion of GH and IGF-I, because protein restriction results in low IGF-I concentrations in healthy children, which returns to normal after refeeding with proteins(Reference Smith, Underwood and Clemmons12). This finding is confirmed by a study showing that milk protein, but not meat or vegetable protein, increases IGF-I concentrations and growth in height(Reference Hoppe, Udam, Lauritzen, Molgaard, Juul and Michaelsen5).
The effects of dietary protein on IGF-I concentrations and growth(Reference Hoppe, Molgaard, Thomsen, Juul and Michaelsen1, Reference Snel, Brummer, Doerga, Zelissen, Bakker, Hendriks and Koppeschaar11, Reference Hoppe, Molgaard, Juul and Michaelsen13, Reference Rabinowitz, Merimee, Maffezzoli and Burgess14) may be mediated by a direct GH-releasing effect of specific amino acids(Reference Chromiak and Antonio15–Reference van Vught, Nieuwenhuizen, Brummer and Westerterp-Plantenga21), in particular arginine (ARG) and lysine (LYS)(Reference Isidori, Lo Monaco and Cappa17, Reference Suminski, Robertson, Goss, Arslanian, Kang, DaSilva, Utter and Metz19, Reference van Vught, Nieuwenhuizen, Brummer and Westerterp-Plantenga21). Earlier studies suggest that the amino acid composition is crucial in understanding the mechanism through which protein may influence GH and IGF-I production with regard to growth and body composition, as specific proteins, such as gelatin protein (which is high in ARG), stimulate the GH release more potently than other protein sources(Reference van Vught, Nieuwenhuizen, Veldhorst, Brummer and Westerterp-Plantenga22). However, no earlier studies have been performed investigating the relationship between the intake of specific amino acids and the development of FM and fat-free mass (FFM) in prepubertal children.
In the present study, we investigated associations between the intakes of protein (PROT) and, more specifically, the amino acids ARG and LYS in the habitual diet, and subsequent changes in linear growth, body fat and FFM, among normal weight and overweight 6-year-old boys and girls. High intakes of PROT, and more specifically, a high intake of ARG, especially in combination with a high intake of LYS, was expected to increase linear growth and the fat-free mass index (FFMI) and decrease fat mass index (FMI).
Material and methods
Subjects
The data were derived from the Copenhagen School Child Intervention Study (CoSCIS). Children from forty-six preschool classes (6–7 years of age) in eighteen schools in two suburban communities in the Copenhagen area were invited to participate in the CoSCIS. In 2000, the community of Ballerup (ten schools, twenty-seven classes) increased the number of physical exercise lessons from two to four in a week, for the first 3 years of school. The community of Taarnby (eight schools, nineteen classes) was chosen as a control, as it resembles Ballerup regarding the sociodemographic characteristics. The reported data in the present study are from the controls of this study (only community of Taarnby)(Reference Hasselstrom, Karlsson, Hansen, Gronfeldt, Froberg and Andersen23, Reference Hasselstrom, Karlsson, Hansen, Gronfeldt, Froberg and Andersen24). A total of 706 children (69 % of those eligible) volunteered in the study, and written informed consent was obtained from the parents/guardians. Of these 706 children, 415 from Ballerup and 291 from Taarnby participated at baseline, 614 children were followed up at third grade. The ethics committee of Copenhagen County approved the study. The measurements were performed from December 2001 until June 2002 preschool, at the eighteen different schools and in the follow-up from September 2004 until May 2005 at third grade. All control children with complete information about food intake, physical activity (PA), socio-economic status (SES), height, weight and skinfold thickness at baseline as well as height, weight and skinfold thickness at follow-up were included. According to these inclusion criteria, ninety-four boys and 109 girls, respectively, were included.
Measurements
Dietary intake
Parents recorded the dietary intake of their child for seven consecutive days in supplied booklets with pre-coded fixed answer possibilities, supplemented with a possibility for open answers. Food portion sizes were estimated from household measures and a series of photographs. This booklet for dietary record has been developed and used in nationwide dietary surveys since 1995(Reference Lyhne, Christensen, Groth and Fagt25). The pre-printed diet records were delivered by the teachers in the schools in closed envelopes addressed to each child, who brought them home. The same logistic was used for return of the completed records.
Intakes of nutrients and foods were calculated using the General Intake Estimation System (Danish Institute for Food and Veterinary Research, 2005) based on the Danish food database(Reference Moller, Saxholt, Christensen and Hartkopp26). The researchers computed the dietary information in a database, by which it was possible to calculate nutrient information (i.e. energy content, protein content, amino acid content) of the individual food items or whole meals and diets. Corrections for losses in cooking were made when calculating nutrient contents.
Reporting of dietary intake of energy was evaluated by comparing reported energy intake (EI) with estimations of energy expenditure (based on basal metabolic rate (BMR; Harris & Benedict) and physical activity level (PAL)). The PAL in children varies between 1·3 and 1·9(Reference Hoos, Kuipers, Gerver and Westerterp27). Children who reported an EI below BMR × 1·3 or above BMR × 2·0 were excluded.
Anthropometry and other measurements
All measurements were carried out using standardised methods, which have been described in detail elsewhere(Reference Hasselstrom, Karlsson, Hansen, Gronfeldt, Froberg and Andersen23, Reference Hasselstrom, Karlsson, Hansen, Gronfeldt, Froberg and Andersen24).
Height was measured by a Harpenden stadiometer, to the nearest 1 mm. Body weight was measured to the nearest 0·1 kg using a SECA electronic scale. Both measurements were performed during school-time by experienced scientists. Bicipital, tricipital, subscapular and suprailiac skinfolds were measured with a Harpenden skinfold calliper to the nearest 1 mm. The dominant side of the body was determined by asking the child to take a pen and write his/her name. The data shown herein represent the mean of three measurements taken on the non-dominant side of the body. The sum of four skinfolds (SFS) was used to calculate body fat percentage. Children were divided into quintiles according to their BMI, adjusted for sex and age(Reference Cole, Bellizzi, Flegal and Dietz28). Analyses were first performed in the whole group of girls and boys and later the groups were divided in BMI quintiles 1–4 and BMI quintile 5.
Habitual PA was measured by the MTI 7164 activity monitor (Manufactory Technology Inc., Fort Walton Beach, FL, USA). This monitor has been validated in several studies and has shown both high mechanical reproducibility and good validity with regard to free living conditions in children(Reference Hasselstrom, Karlsson, Hansen, Gronfeldt, Froberg and Andersen24). To allow familiarisation, the children had to wear the MTI monitor one day before recording. It was secured directly to the skin at the lower back using an elastic belt. The children were instructed to wear the monitor continuously except during water-based activities or when sleeping. A mean count was calculated for each child(Reference Hasselstrom, Karlsson, Hansen, Gronfeldt, Froberg and Andersen24).
The classification of SES was based on information regarding the education of the mother in the household at the first measurement point, as recent studies suggest that the risk factors considered herein are more strongly associated with the SES of the mother rather than that of the father(Reference Gnavi, Spagnoli, Galotto, Pugliese, Carta and Cesari29–Reference Kristensen, Wedderkopp, Moller, Andersen, Bai and Froberg31). The education level of the mother was divided into seven categories: (1) <7 years education, (2) 7–8 years education, (3) 9–10 years completed elementary school, (4) 12 years high school, (5) short non-university programmes under 3 years, (6) college 3–4 years and (7) university degree over 4 years.
Calculation of fat-free mass and fat mass
The body fat percentage was estimated from the skinfold thickness using the equations from Weststrate(Reference Weststrate and Deurenberg32):
(i) girls aged 2–10 years: Fat % = ((562 − 1·1(age − 2))/D) − (525 − 1·4(age − 2)) and
(ii) girls aged 11–18 years: Fat % = ((533 − 7·3(age − 10))/D) − (514 − 8·0(age − 10)) and
(iii) boys aged 2–18 years: Fat % = ((562 − 4·2(age − 2))/D) − (525 − 4·7(age − 2))
where D = Total body density estimated from following equations: (i) girls aged 2–10 years: D = (1·1315 + 0·0004 × (age − 2)) − ((0·0719 − 0·0003 × (age − 2)) × log4skin) and (ii) girls aged 11–18 years: D = (1·1350 + 0·0031 × (age − 10)) − ((0·0719 − 0·0003 × (age − 2)) × log4skin) and (iii) boys aged 2–18 years: D = (1·1315 + 0·0018 × (age − 2)) − ((0·0719 − 0·0006 × (age − 2)) × log4skin) where Log4skin = log (Σ mean of the four skinfold thickness).
FM and the FFM were calculated from the body weight and the estimated body fat (%). FM and FFM were divided by squared height, to calculate FFMI and FMI, respectively(Reference Wells and Cole33). These indices have been proposed as indicator of nutritional status, and because FMI + FFMI = BMI, their use allows to asses the contribution of FM and FFM to BMI(Reference Wells and Cole33).
Statistical analysis
Each dietary and anthropometric variable was treated as a continuous variable. The relationship between change (Δ) in height, FMI or FFMI, and intake of PROT as well as the intake of ARG or LYS at 6 years of age was assessed by a multiple regression model including the covariates: baseline height, FMI or FFMI, age, EI, PA and SES. The interaction of ARG with LYS was estimated in a model with the same covariates as the model described above. This model was converted to the final regression model, by dividing LYS into low and high LYS intake. Low LYS intake was defined as LYS intake below median and high LYS intake as LYS intake above median. Since there was an interaction between the independent variables PROT, ARG, LYS and gender, data of boys and girls were analysed separately. After analysing data of boys and girls separately, they were divided in either the 1–4th quintile of BMI (leaner children) or in the 5th quintile of BMI (heavier children) to investigate if there is a difference in growth influenced by protein intake between the leaner children and the heavier children. To test the significance of the contribution of the variables, an F-test was used. The characteristics are expressed as mean (sd). All other values are expressed as mean (se). A P value <0·05 was considered as indicating statistical significance. All statistical analyses were performed using SPSS for Windows, version 14.0 (SPSS, Chicago, IL, USA).
Results
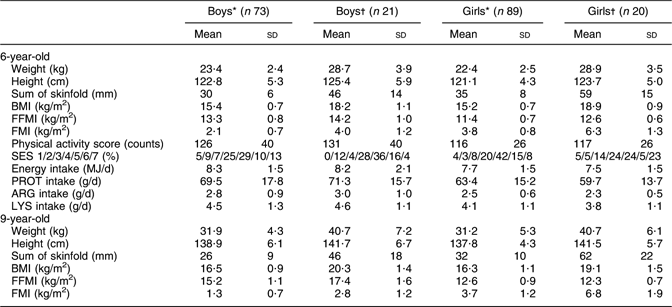
The characteristics of the children, grouped by study year, gender and quintile of BMI are shown in Table 1.
Table 1 Characteristics of boys and girls aged 6 years and 9 years according to BMI quintiles

FFMI, fat-free mass index; FMI, fat mass index; SES, socio-economic status; PROT, total protein; ARG, arginine; LYS, lysine.
*BMI-quintiles 1–4.
†BMI-quintile 5.
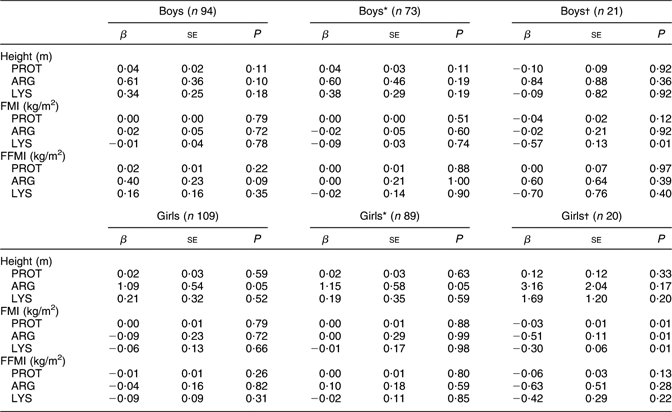
The results are summarised in Tables 2 and 3, with Δheight, ΔFMI and ΔFFMI as dependent variables and habitual intake of PROT as well as the specific amino acids ARG and LYS, and the interaction between them, as independent variables. Adjustments were made for the covariates: baseline height, FMI or FFMI, age, EI, PA and SES.
Table 2 Adjusted models showing the associations between both ARG and LYS (g/d) intakes and changes in height (m), FMI and FFMI (kg/m2)

ARG, arginine; LYS, lysine; FMI, fat mass index; FFMI, fat-free mass index; PROT, total protein.
*BMI-quintiles 1–4.
†BMI-quintile 5.
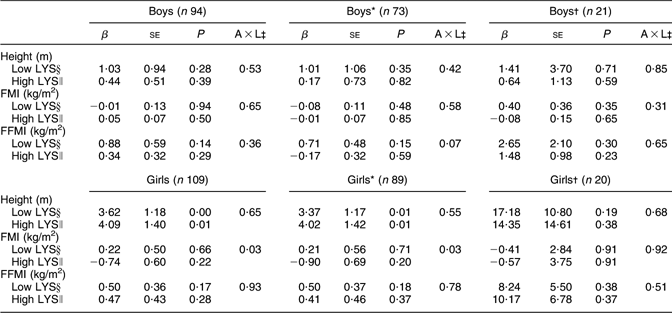
Table 3 Final models between the interaction of ARG and LYS (g/d) and height (m), FMI and FFMI (kg/m2)

ARG, arginine; LYS, lysine; FMI, fat mass index; FFMI, fat-free mass index.
*BMI-quintiles 1–4.
†BMI-quintile 5.
‡Arginine × Lysine interactions.
§LYS < 4·25 g/d.
∥LYS > 4·25 g/d.
Association between change in height and habitual intake of protein, and specifically arginine and lysine intake
Among girls, growth in height was associated with a high intake of ARG (β = 1·09 (se 0·54), P < 0·05), but intake of PROT or LYS was not associated with changes in linear growth (Table 2). Among boys, this association did not reach significance.
Association between change in FMI and habitual intake of protein, and specifically arginine and lysine intake
Significant associations were found between changes in FMI and habitual intakes of PROT as well as for the specific amino acids ARG or LYS separately, or combined (β = −0·03 (se 0·01), P = 0·01; β = −0·51 (se 0·11), P = 0·01; β = −0·30 (se 0·06), P = 0·01; respectively), among girls with a BMI in the 5th percentile, but not among the girls with a BMI in the 1–4th quintile (Tables 2 and 3). Among boys, no associations were found between ΔFMI and the intake of PROT; significant associations however were found between ΔFMI and the intake of the specific amino acid LYS, among boys with a BMI in the 5th quintile (β = −0·57 (se 0·13), P = 0·01) (Table 2).
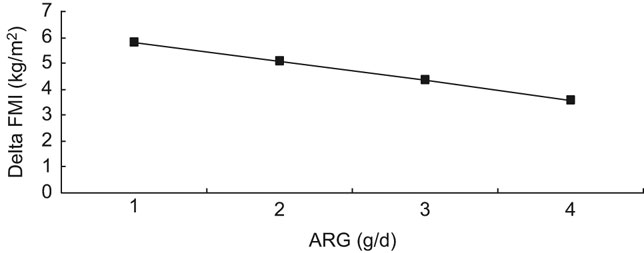
Further analyses showed that ARG and LYS were not independently related to changes in ΔFMI (P = 0·03) (Table 3). The interaction analysis showed that among girls with a BMI in the 1–4th quintile, a stronger inverse correlation was found between ΔFMI and ARG intake if LYS intake was high, than if LYS intake was low (P = 0·03; Fig. 1).

Fig. 1 Interaction of ARG and LYS (g/d) and FMI (kg/m2) among girls (–▪– high LYS; ARG, arginine; LYS, lysine; FMI, fat mass index)
Association between change in FFMI and habitual intake of protein, and specifically arginine and lysine intake
No associations were found between change in FFMI and habitual intake of PROT, ARG or LYS (Table 2).
Discussion
The present study shows that linear growth as well as the development of body composition may be influenced by habitual dietary intake of the amino acids ARG and LYS, among prepubertal girls.
The association between linear growth and the intake of ARG may be explained by the stimulation of the somatotropic axis by ARG, as ARG is a potent stimulator of GH secretion(Reference Collier, Casey and Kanaley16) and GH plays an important role in linear growth(Reference Hoppe, Udam, Lauritzen, Molgaard, Juul and Michaelsen5, Reference Veldhuis, Roemmich, Richmond, Rogol, Lovejoy, Sheffield-Moore, Mauras and Bowers34). This association reached significance only in girls (P < 0·05), but the association had the same direction and magnitude in boys also (P = 0·10). For the intake of PROT in general, or LYS, the association with linear growth was weaker, indicating that, in particular, ARG is an important dietary determinant of linear growth. We could, however, not confirm the involvement of the somatotropic axis within the present study, as plasma IGF-I concentrations were not available in this cohort. Earlier studies investigating the effects of dietary protein source on growth in height showed increased IGF-I concentrations as well as growth in height after intake of milk protein, but not after intake of animal or vegetable protein, which suggests an influence of specific amino acid concentrations or combinations influencing IGF-I concentrations and growth in height(Reference Hoppe, Udam, Lauritzen, Molgaard, Juul and Michaelsen5, Reference Hoppe, Molgaard, Juul and Michaelsen13).
Besides the association between ARG and linear growth, high intake of ARG, combined with high intake of LYS, is associated with a relative decrease in FMI. This may also be explained by the stimulating effects of these amino acids on GH secretion(Reference Collier, Casey and Kanaley16, Reference Isidori, Lo Monaco and Cappa17), as GH is known to decrease body FMI(Reference Fu, Haynes, Kohli, Hu, Shi, Spencer, Carroll, Meininger and Wu35). The subgroup analyses were based on small numbers that may have prevented the finding of significant associations between protein intake and FMI for the boys. All associations, however, were in the same direction for boys and girls, which suggest that protein was of importance for growth.
The interactions between the amino acids suggest that the effect of proteins is depending on the available amount and combination of specific amino acids, such as ARG and LYS, as demonstrated in the present study. The somatotropic regulation of growth and body composition could thus be modulated by privileged amino acids and proteins(Reference Hoppe, Molgaard, Thomsen, Juul and Michaelsen1). In a recent study, we found remarkable differences in the potency of various dietary proteins to stimulate the somatotropic activity, with gelatin (high in ARG) showing the largest increase on GH secretion among other proteins(Reference van Vught, Nieuwenhuizen, Veldhorst, Brummer and Westerterp-Plantenga22).
In the present study, the mean intake of PROT per day was 66 (sd 16) g/d (2·6 g/kg/d), which is considerably above the requirement of 0·95 g/kg/d (Third National Health and Nutrition Examination Survey, NHANES III). However, the same protein intake was also seen in other studies among Danish children(Reference Hoppe, Molgaard, Thomsen, Juul and Michaelsen1, Reference van Vught, Nieuwenhuizen, Brummer and Westerterp-Plantenga21). The mean intake of ARG per day was 2·6 (sd 0·8) g/d and for LYS 4·3 (sd 1·2) g/d, which is in accordance with the requirements for adults (NHANES III). For children, no accepted requirement values are published (WHO report, 2007). ARG is present in large amounts in products like nuts, seeds, fish and meat, and particularly high concentrations are present in walnuts, sesame seeds and shellfish. LYS is present in meat and milk products and is found in particularly high amounts in beef and cheese.
It should be noted that information on dietary intakes was obtained using a 7 d food record, and that measurement error may have occurred, as also indicated by the lower total EI among the children in the 5th BMI quintile compared with the lean children. However, all dietary instruments used to assess habitual diet intake have random as well as specific errors(Reference Westerterp and Goris36). On the other hand, studies have shown that although EI is frequently under-reported, protein reporting is more accurate(Reference Heitmann and Lissner37). Therefore, we believe that the present data, especially with regard to protein intake, indeed largely reflect true intake levels. Moreover, in order to be able to take EI into account as covariate, we excluded clear under-reporters and over-reporters. Misreporters consisted of a few under-reporters; they were clearly inaccurate reporters. Over-reporting occurred more often, as parents/caretakers reported on children(Reference Livingstone and Robson38, Reference Warren, Henry, Livingstone, Lightowler, Bradshaw and Perwaiz39). The ability of the parents to quantify portion sizes causes errors in quantification; for instance, parents report what they believe their child should eat, rather than what they actually do eat(Reference Livingstone and Robson38).
The results of the present study suggest that a physiological role of habitual PROT intake on growth in height and the regulation of body composition in later life may depend on the amount and the combination of specific amino acids, and may add to our understanding of how to perform future dietary intervention among prepubertal children. This has to be further investigated by experimental designs.
In conclusion, in prepubertal girls, linear growth may be influenced by habitual ARG intake and body fat gain may be relatively prevented over time by a high intake of the combination of the amino acids ARG and LYS.
Acknowledgements
The authors would like to acknowledge the members of the Copenhagen School Child Intervention Study for making their data available. The authors wish to acknowledge the helpful assistance from statistician Michael Gamborg in analysing data. This research received no specific grant from any funding agency in the public, commercial or not-for-profit sectors. List of author contributions: A.J.A.H.V.V., B.L.H., A.G.N., R.-J.M.B. and M.S.W.-P. designed the study. L.B.A. and H.H. collected the data. A.J.A.H.V.V. and B.L.H. analysed the data and wrote the manuscript, and A.G.N., L.B.A., H.H., M.A.B.V., R.-J.M.B. and M.S.W.-P. contributed to interpretation of the data and reviewed the manuscript. The study was executed under the supervision of B.L.H., A.G.N., R.-J.M.B. and M.S.W.-P. None of the authors have any conflict of interests to declare.


