Representing one of the most important lifestyle factors, diet can strongly influence the incidence and onset of CVD(Reference Graf, Milbury and Blumberg1), and thus a healthy diet is an essential factor for healthy ageing(Reference Arts and Hollman2). A number of dietary intervention studies in human subjects and animals, in particular those using Vitis vinifera (grape), Camellia sinensis (tea) and Theobroma cacao (cocoa) have demonstrated beneficial effects on vascular function(Reference Fisher, Hughes, Gerhard-Herman and Hollenberg3Reference Heiss, Dejam, Kleinbongard, Schewe, Sies and Kelm4Reference Taubert, Berkels, Roesen and Klaus5. While such foods and beverages differ greatly in chemical composition and macro- and micronutrient content, they have in common that they are amongst the major dietary sources of flavanols. The in vivo effects of flavanols will be dependent on the absorption and metabolism of flavanols in the gastrointestinal tract. Studies have indicated that flavanols are subject to extensive metabolism by phase I and II enzymes to yield O-methylated, sulfated and glucuronidated forms during transfer from the small-intestinal lumen to the portal bloodReference Kuhnle, Spencer, Schroeter, Shenoy, Debnam, Srai, Rice-Evans and Hahn(6). However, significant amounts of ingested ( − )-epicatechin, (+)-catechin, and their structurally related oligomeric forms (procyanidins), escape absorption in the small intestine, instead reaching the large intestine, where they encounter the resident colonic microflora(Reference Spencer7).
The human large intestine is an extremely active fermentation site and is inhabited by over 400 different bacterial species which number about 10Reference Gibson, Probert, Van Loo, Rastall and Roberfroid14 colony-forming units in total(Reference Gibson, Beatty, Wang and Cummings8). The balance among these bacterial species has been linked to both beneficial and detrimental effects in the large intestine. For example, the progression of colorectal cancer and inflammatory bowel disease is associated with deleterious bacterial species, such as certain members of the Clostridium group, whilst others, such as Bifidobacterium and Lactobacillus spp., are known to exert beneficial effects in the colon">(Reference Onoue, Kado, Sakaitani, Uchida and Morotomi9Reference Rastall10Reference O'Mahony, McCarthy and Kelly11Reference Saggioro12 and have been utilised in the development of probiotic functional foodsReference Gibson, Beatty, Wang and Cummings(8, Reference Marteau13). In addition, there has been much recent interest in the development of ‘prebiotics’, defined as non-digestible food ingredients that have a beneficial effect on the host by selectively stimulating the growth of a limited number of specific bacterial strains in the large intestine(Reference Gibson, Probert, Van Loo, Rastall and Roberfroid14). For a nutrient to be classified as a prebiotic it has to fulfil three criteria: (a) it must undergo a low level of hydrolysis or absorption in the stomach and/or small intestine; (b) it must be selective for beneficial commensal bacteria in the colon by encouraging the growth and metabolism of these organisms; (c) it must alter the microflora to a healthy composition by inducing beneficial luminal or systemic effects within the host(Reference Gibson and Fuller15). Presently, the most widely used prebiotics are fructo-oligosaccharides (FOS) and galacto-oligosaccharides and studies have indicated the bifidogenic and anti-cancer potential of these carbohydrates(Reference Kleessen, Hartmann and Blaut16Reference Wijnands, Appel, Hollanders and Woutersen17Reference Gibson, Beatty, Wang and Cummings18. However, whilst soyabean isoflavones have been shown to possess prebiotic potential in vivo Reference Clavel, Fallani and Lepage(19), there is limited information regarding the potential prebiotic potential of other classes of flavonoids, including the flavanols.
Previous in vitro investigations have indicated that flavanols, including procyanidins, are catabolised by the colonic microflora to low-molecular-weight compounds such as phenylacetic, phenylpropionic and phenylvaleric acids, which are mono-hydroxylated primarily in the meta or para position(Reference Deprez, Brezillon, Rabot, Philippe, Mila, Lapierre and Scalbert20). Furthermore, ( − )-epigallocatechin and ( − )-epicatechin have been shown to be metabolised to 5-(3′,4′,5′-trihydroxyphenyl)-γ-valerolactone and 5-(3′,4′-dihydroxyphenyl)-γ-valerolactone by the intestinal microflora(Reference Li, Lee and Sheng21). A recent in vitro study indicated that the fermentation of the tea polyphenols, catechin, epicatechin, 3′-O-methyl gallic acid, gallic acid and caffeic acid, by various pure isolates of pathogenic and commensal intestinal bacterial species leads to the generation of a variety of aromatic metabolites. Incubation of these polyphenols with the pure bacterial isolates significantly inhibited the growth of certain pathogenic bacterial species compared with other commensal anaerobes(Reference Lee, Jenner, Low and Lee22). The aim of the present study was to investigate the potential of the flavanol monomers, ( − )-epicatechin and (+)-catechin, to influence the growth of specific bacterial groups in a pH-controlled, stirred, batch-culture fermentation system that is reflective of the environmental conditions located in the distal region of the human large intestine. We detail the differential metabolism of flavanols in this competitive bacterial environment and show that they are capable of inducing positive changes in the balance of bacterial groups.
Materials and methods
Materials
Unless otherwise stated, all chemicals and reagents were obtained from Sigma-Aldrich Co. Ltd (Poole, Dorset, UK) or Fisher (Loughborough, Leics, UK). Bacteriological growth media supplements were obtained from Oxoid Ltd (Basingstoke, Hants, UK). (+)-Catechin (> 99 % pure) and ( − )-epicatechin (> 90 % pure) were purchased from Sigma-Aldrich. (+)-Epicatechin was obtained from Mars, Inc. (Hackettstown, NJ, USA). Raftilose P95 FOS was purchased from Orafti (Tienen, Belgium). HPLC columns were purchased from Waters Co. (Watford, Herts, UK) and Sumika Chemical Analysis Service (Singapore). Isopore (0·2 μm) membrane filters were obtained from Millipore Corp. (Watford, Herts, UK). All the oligonucleotide probes used for fluorescent in situ hybridisation (FISH) were commercially synthesised and labelled with the fluorescent dye Cy3 by MWG-Biotech Ltd (Milton Keynes, Bucks, UK). Sterilisation of media and instruments was achieved by autoclaving at 121°C for 15 min.
Faecal sample preparation
Faecal samples were collected from three separate individuals. All volunteers were in good health and had not ingested antibiotics for at least 6 months before the study. Samples were collected, on site, on the day of the experiment and were used immediately. The samples were diluted 1:10 (w/v) with anaerobic phosphate buffer (0·1 m; pH 7·4) and homogenised in a stomacher for 2 min. Resulting faecal slurries from each individual (i.e. faecal samples were not pooled) were used to inoculate the batch-culture vessels.
Batch-culture fermentation
Batch-culture fermentation vessels (300 ml volume; one vessel per treatment group) were sterilised and filled with 135 ml basal nutrient medium (peptone water (2 g/l), yeast extract (2 g/l), NaCl (0·1 g/l), K2HPO4 (0·04 g/l), KH2PO4 (0·04 g/l), NaHCO3 (2 g/l), MgSO4.7H2O (0·01 g/l), CaCl2.6H2O (0·01 g/l), Tween 80 (2 ml/l), haemin (50 mg/l), vitamin K1 (10 μl/l), l-cysteine (0·5 g/l), bile salts (0·5 g/l), resazurin (1 mg/l) and distilled water). The pH of the basal medium was adjusted to 7·0 and autoclaved before dispensing it to the vessels. Medium was then gassed overnight with O2-free N2. Before the addition of faecal slurry samples, the temperature of the basal nutrient medium was set to 37°C by using a circulating water-bath and the pH was maintained at 6·8, using an Electrolab pH controller, in order to mimic conditions located in the distal region of the human large intestine (anaerobic; 37°C; pH about 6·8). Vessels were inoculated with 15 ml faecal slurry (1:10, w/v) and batch cultures were run under anaerobic conditions for a period of 48 h during which samples (3 ml) were collected at seven time points (0, 4, 8, 10, 17, 24 and 48 h) for FISH, flavanol metabolism analysis by HPLC and assessment of the total antioxidant capacity (ferric-reducing antioxidant power (FRAP) assay). Before FISH analysis, duplicate samples were fixed overnight at 4°C with 4 % (w/v) paraformaldehyde. The remaining sample was centrifuged for 5 min at 1500 g and the supernatant fraction was removed and stored in sterile Eppendorf tubes (1·5 ml) at − 20°C to be analysed later by HPLC and in the FRAP assay.
Inoculation of substrate in the batch culture
(+)-Catechin and ( − )-epicatechin (150 mg/l and 1000 mg/l) were inoculated in stirring batch-culture vessels (one per treatment) containing faecal slurry (1:10, w/v). These amounts were estimated to reflect lower and upper levels of flavanol monomer intake. We also investigated the metabolism of compounds (1000 mg/l) in the presence of sucrose (1 %, w/v) and in the presence of a known prebiotic compound, FOS (1 %, w/v). Control experiments incubating flavanol monomers in medium without faecal slurry inoculation were also run under anaerobic conditions.
Bacterial enumeration
In order to access the differences in bacterial population, FISH was used with oligonucleotide probes designed to target specific diagnostic regions of 16S rRNA. The probes were commercially synthesised and labelled with the fluorescent dye Cy3. The bacterial groups studied for enumeration were Bifidobacterium spp., Bacteroides spp., Lactobacillus/Enterococcus spp., Clostridium coccoides–Eubacterium rectale group, C. histolyticum group and Escherichia coli using the specific probes Bif164, Bac303, Lab158, Erec482, His150 and Ec1531 respectively. For total bacterial count 4,6-diamidino-2-phenylindole nucleic acid stain was utilised. Samples fixed in 4 % paraformaldehyde overnight at 4°C were then centrifuged at 1500 g for 5 min, washed twice with PBS (0·1 m; pH 7·0), re-suspended in a mixture of PBS–99 % ethanol (1:1, v/v) and stored at − 20°C for at least 1 h. This process was used for all samples except those where the Lab158 probe was used. Samples probed with Lab 158 were subjected to an additional enzyme step (25 mm-tri(hydroxymethyl)-aminomethane-HCl, 10 mm-EDTA, 585 mm-sucrose, 5 mm-CaCl2, sodium taurocholate (0·3 mg/ml), lysozyme (2 mg/ml), lipase (0·1 mg/ml)) for 60 min at 37°C in order to increase cell permeability.
Cell suspensions were then added to the filtered sterilised hybridisation mixture (30 mm-tri(hydroxymethyl)-aminomethane-HCl, 1·36 m-NaCl, 0·15 % SDS, pH 7·2) and were left overnight to hybridise at the appropriate temperature for each probe. Hybridised mixtures were vacuum filtered using 0·2 (m pore-size isopore membrane filters (Millipore Corporation, Watford, Herts, UK) and filters were placed onto labelled glass slides. A drop of Slowfade (Molecular Probes, Eugene, OR, USA) was added to each and a cover slip was placed on top of each filter and slides were stored in the dark at 4°C. Slides were examined after 60 min using a fluorescent microscope (Nikon Eclipse E400). 4,6-Diamidino-2-phenylindole-stained cells were examined under UV light and a DM510 light filter was used to count micro-organisms hybridised with the probes. For each slide, fifteen different fields of view were counted. In order to determine the changes in the bacterial population we used an ‘index of specific bacteria’ (ISB). The ISB was calculated using the following equation: ISB = (Ns (T1) – Ns (T0)) – (Nc (T1) – Nc (T0)), where Ns is the number log10 of specific bacteria in a specific test sample (i.e. treated with flavanol), Nc is the number log10 of specific bacteria in the control (no addition of flavanol), T1 is a specific time point and T0 is the 0 h time point. The control vessel contained only basal medium and faecal slurry (1:10, w/v) without any addition of flavanols.
High-performance liquid chromatography analysis
Analysis of flavanols and metabolites in the batch-culture vessels was assessed using a Hewlett-Packard 1100 series chromatograph (Hewlett-Packard, Palo Alto, CA, USA) equipped with a diode array detector and linked to the HP Chemstation Software system. Batch-culture supernatant fraction samples were diluted 1:5 in Milli-Q water before analysis using a reversed-phase C18 Nova-Pak column (4·6 × 250 mm) (Waters Co.) with 4 μm particle size. The mobile phase consisted of: (A) aqueous methanol (5 %) in 5 m-hydrochloric acid (0·1 %) and (B) acetonitrile–methanol (1:1) and was pumped through the column at 0·7 ml/min. The following gradient system was used, where the percentage of solvent B was increased at the following times (min/% B): 0/0, 5/5, 40/50, 60/5 for detection of all compounds; the total run time was 60 min. The eluant was monitored by photodiode array detection at 280 nm and spectra of products obtained over the 220–600 nm range. Calibration curves of catechin and epicatechin were constructed using authentic standards (0–100 μm) and in each case were found to be linear with correlation coefficients of > 0·995.
Chromatographic chiral analyses were performed on HP 1100 Series HPLC (Hewlett-Packard) coupled to a fluorescence detector. Separations were carried out using a 4·6 × 250 mm; 5 μm Sumichiral OA-7000 column (Sumika Chemical Analysis Service Ltd, Singapore) with a 10 μl injection volume. The binary mobile phase consisted of (A) 0·1 % acetic acid in water and (B) 0·1 % acetic acid in acetonitrile, with the isocratic separation carried out using 15 % solvent B. The flow rate of 0·250 ml/min was used throughout the run, which lasted 100 min. Standards and samples were detected using a fluorescence detector with an excitation wavelength of 276 nm and emission wavelength of 316 nm. Confirmation of the structure of (+)-epicatechin and ( − )-epicatechin was confirmed by retention time, spectral mapping and by spiking with authentic standards.
Measurement of antioxidant potential of batch-culture mixtures
The FRAP assay was used as a direct measurement of the total antioxidant potential of each sample. The assay was performed as previously described(Reference Benzie and Strain23) with minor modifications. Briefly, sodium acetate trihydrate (300 mm), 2,4,6-tripyridyl-s-triazine (10 mm) in HCl (40 mm) and FeCl3.6H2O (20 mm) were combined in a 10:1:1 ratio to obtain the FRAP reagent. Sample analysis was preformed on a ninety-six-well plate where 40 μl of appropriately diluted sample were added to 300 μl FRAP reagent in each well. Samples were analysed in triplicate. Plates were analysed using a GENios pro (Tecan, Theale, Berks, UK) spectrophotometer linked to the Magellan software program. The change of absorbance at 593 nm over 4 min is proportional to the combined (total antioxidant) FRAP value of the antioxidants in the sample. Untreated faecal supernatant fractions from the batch cultures were used as control and ascorbic acid was used as the positive control.
Statistical analysis
Each flavanol monomer was tested at two concentrations (150 mg/l or 1000 mg/l) in batch cultures inoculated with faecal samples collected from three individual donors. Experiments were performed in duplicate (i.e. each donor donated a faecal sample on two separate occasions). For bacterial enumeration work, changes in bacterial groups, calculated using the ‘index of specific bacteria’ (see Bacterial enumeration section), were expressed as mean values and standard deviations. A paired Student's t test was used to test for significant differences at 10 h for flavanols (150 ml/l) and 17 h for flavanols (1000 mg/l) between the control vessel and flavanol-containing vessels. The rationale for the selection of these time points is discussed in the Results section. For the antioxidant potential work (FRAP assay) the results were expressed as mean values and standard deviations and significance was analysed using paired Student's t tests. Significant differences in batch-culture flavanol levels were assessed using an unpaired t test with Welsh's correction.
Results
Metabolism of flavanols by human faecal bacteria
We applied a pH-controlled, stirred, batch-culture fermentation system inoculated with a faecal slurry (1:10, w/v) to determine the metabolism of ( − )-epicatechin and (+)-catechin in a competitive microbial environment that mimics the distal large intestine. Fermentation suspensions were treated with ( − )-epicatechin or (+)-catechin, and samples were collected as a function of time and analysed by HPLC for characterisation and quantification of intact flavanols and derived bacterial metabolites. Fig. 1 shows representative HPLC chromatograms and related spectral peak information for the metabolism of ( − )-epicatechin by the microflora. ( − )-Epicatechin was degraded progressively over a 24 h period but was not fully degraded in this time frame. Three major metabolites with similar spectral characteristics were observed at retention times of 18·4 (A1), 19·8 (A2) and 24·3 (A3) min, suggesting that they are more polar than epicatechin itself (Fig. 1 (A)). The metabolite at 18·4 min (A1) was identified as 5-(3′,4′-dihydroxyphenyl)-γ-valerolactone by MS, with analysis indicating that its amount increased as a function of exposure time (Fig. 1 (B)). Metabolite A2 was characterised by LC–MS/MS to be phenylpropionic acid (m/z 151; [M+H+]+) whilst A3 was determined to be 5-phenyl-γ-valerolactone (m/z 191; [M+H+]+).
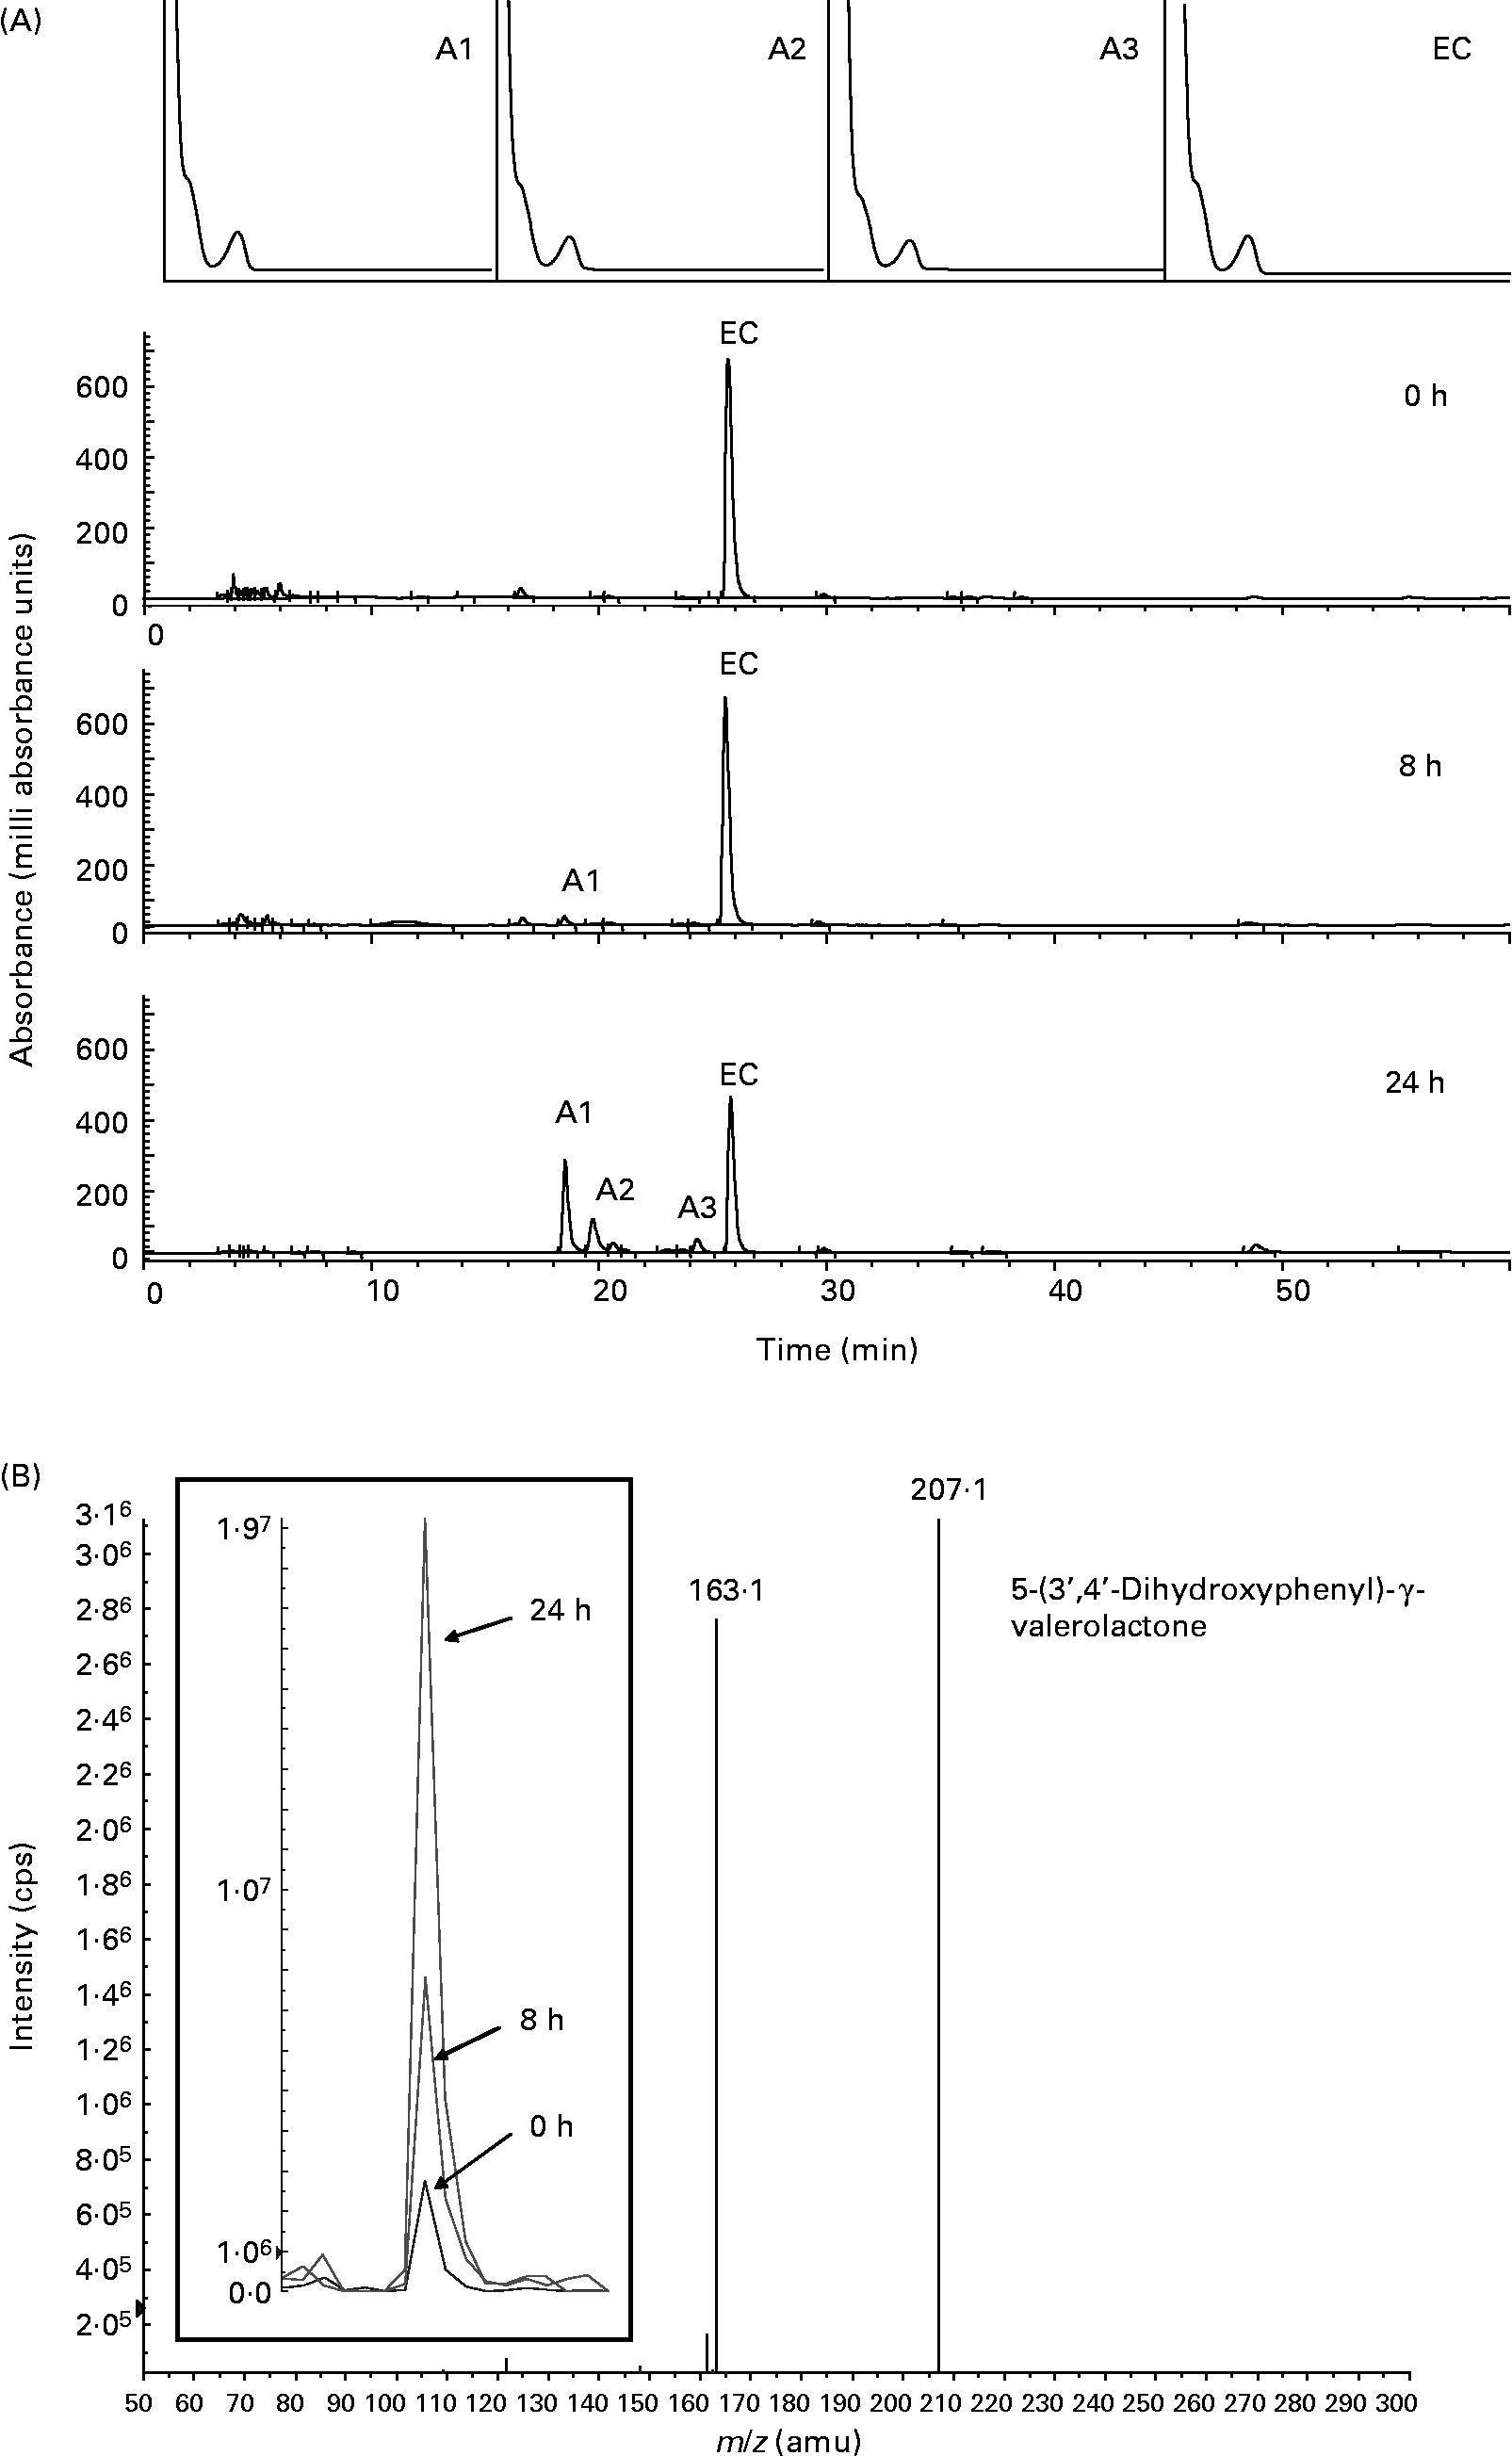
Fig. 1 Bacterial-dependent metabolism of ( − )-epicatechin (EC). (A) Typical HPLC chromatogram with photodiode array spectra (200–600 nm) of faecal supernatant fraction derived from the batch culture with EC at 1000 mg/l concentration after 0, 8 and 24 h of incubation with human colonic bacteria. EC and three new compounds (A1–A3) were detected. (B) LC-MS/MS analysis of peak A1 confirming the presence of 5-(3′,4′-dihydroxyphenyl)-γ-valerolactone [n-H+]+m/z 207. Inset panel shows the relative signal for [n-H+]+m/z 207 in 0, 8 and 24 h batch-culture samples. cps, Counts per s; amu, atomic mass units.
When (+)-catechin was incubated under the same conditions, the formation of four major, more polar, metabolites was observed at 11·3 (B2), 19·4 (B1), 24·0 (B3) and 25·6 (B4) min retention times (Fig. 2 (B)) over the course of 24 h. The major metabolite formed at 10 h (B4) was determined to be either (+)-epicatechin or ( − )-epicatechin by comparison with authentic standards and LC–MS/MS analysis (Fig. 2 (B)). Chiral separation of this sample by HPLC further identified this peak as (+)-epicatechin (Fig. 3). Metabolite B1, which also appeared after 10 h of incubation, eluted at a similar retention time to A1 and had similar spectral characteristics. Mass spectral analysis of B1 confirmed that this metabolite was also 5-(3′,4′-dihydroxyphenyl)-γ-valerolactone (molecular weight of 207 detected in negative ion mode) and B3 was 5-phenyl-γ-valerolactone (m/z 191; [M+H+]+). The rate of (+)-catechin metabolism by the microflora was significantly greater than that observed for ( − )-epicatechin, with levels of (+)-catechin significantly lower at 4 h (P < 0·01) and 8 h (P < 0·001) at the 150 mg/l exposure Fig. 4 (A) and at 8 h (P < 0·01), 10 h and 17 h (P < 0·001) at the 1000 mg/l exposure (Fig. 4 (B)). This appeared to be due in part to the conversion of (+)-catechin to (+)-epicatechin during catechin fermentation experiments (Fig. 3). Degradation of both flavanols was influenced by individual variation in the composition of the faecal microflora, yielding relatively large inter-individual variation (Fig. 4). However, although the time course for different donors varied slightly, all donors yielded the same metabolites for ( − )-epicatechin and (+)-catechin. No epimerisation of ( − )-epicatechin or (+)-catechin was observed when flavanols were added to batch-culture systems without faecal inoculum (data not shown). In control experiments, no degradation of either (+)-catechin or ( − )-epicatechin was observed when flavanols (1000 mg/l) were incubated in anaerobic batch-culture vessels for 24 h without faecal inoculation.
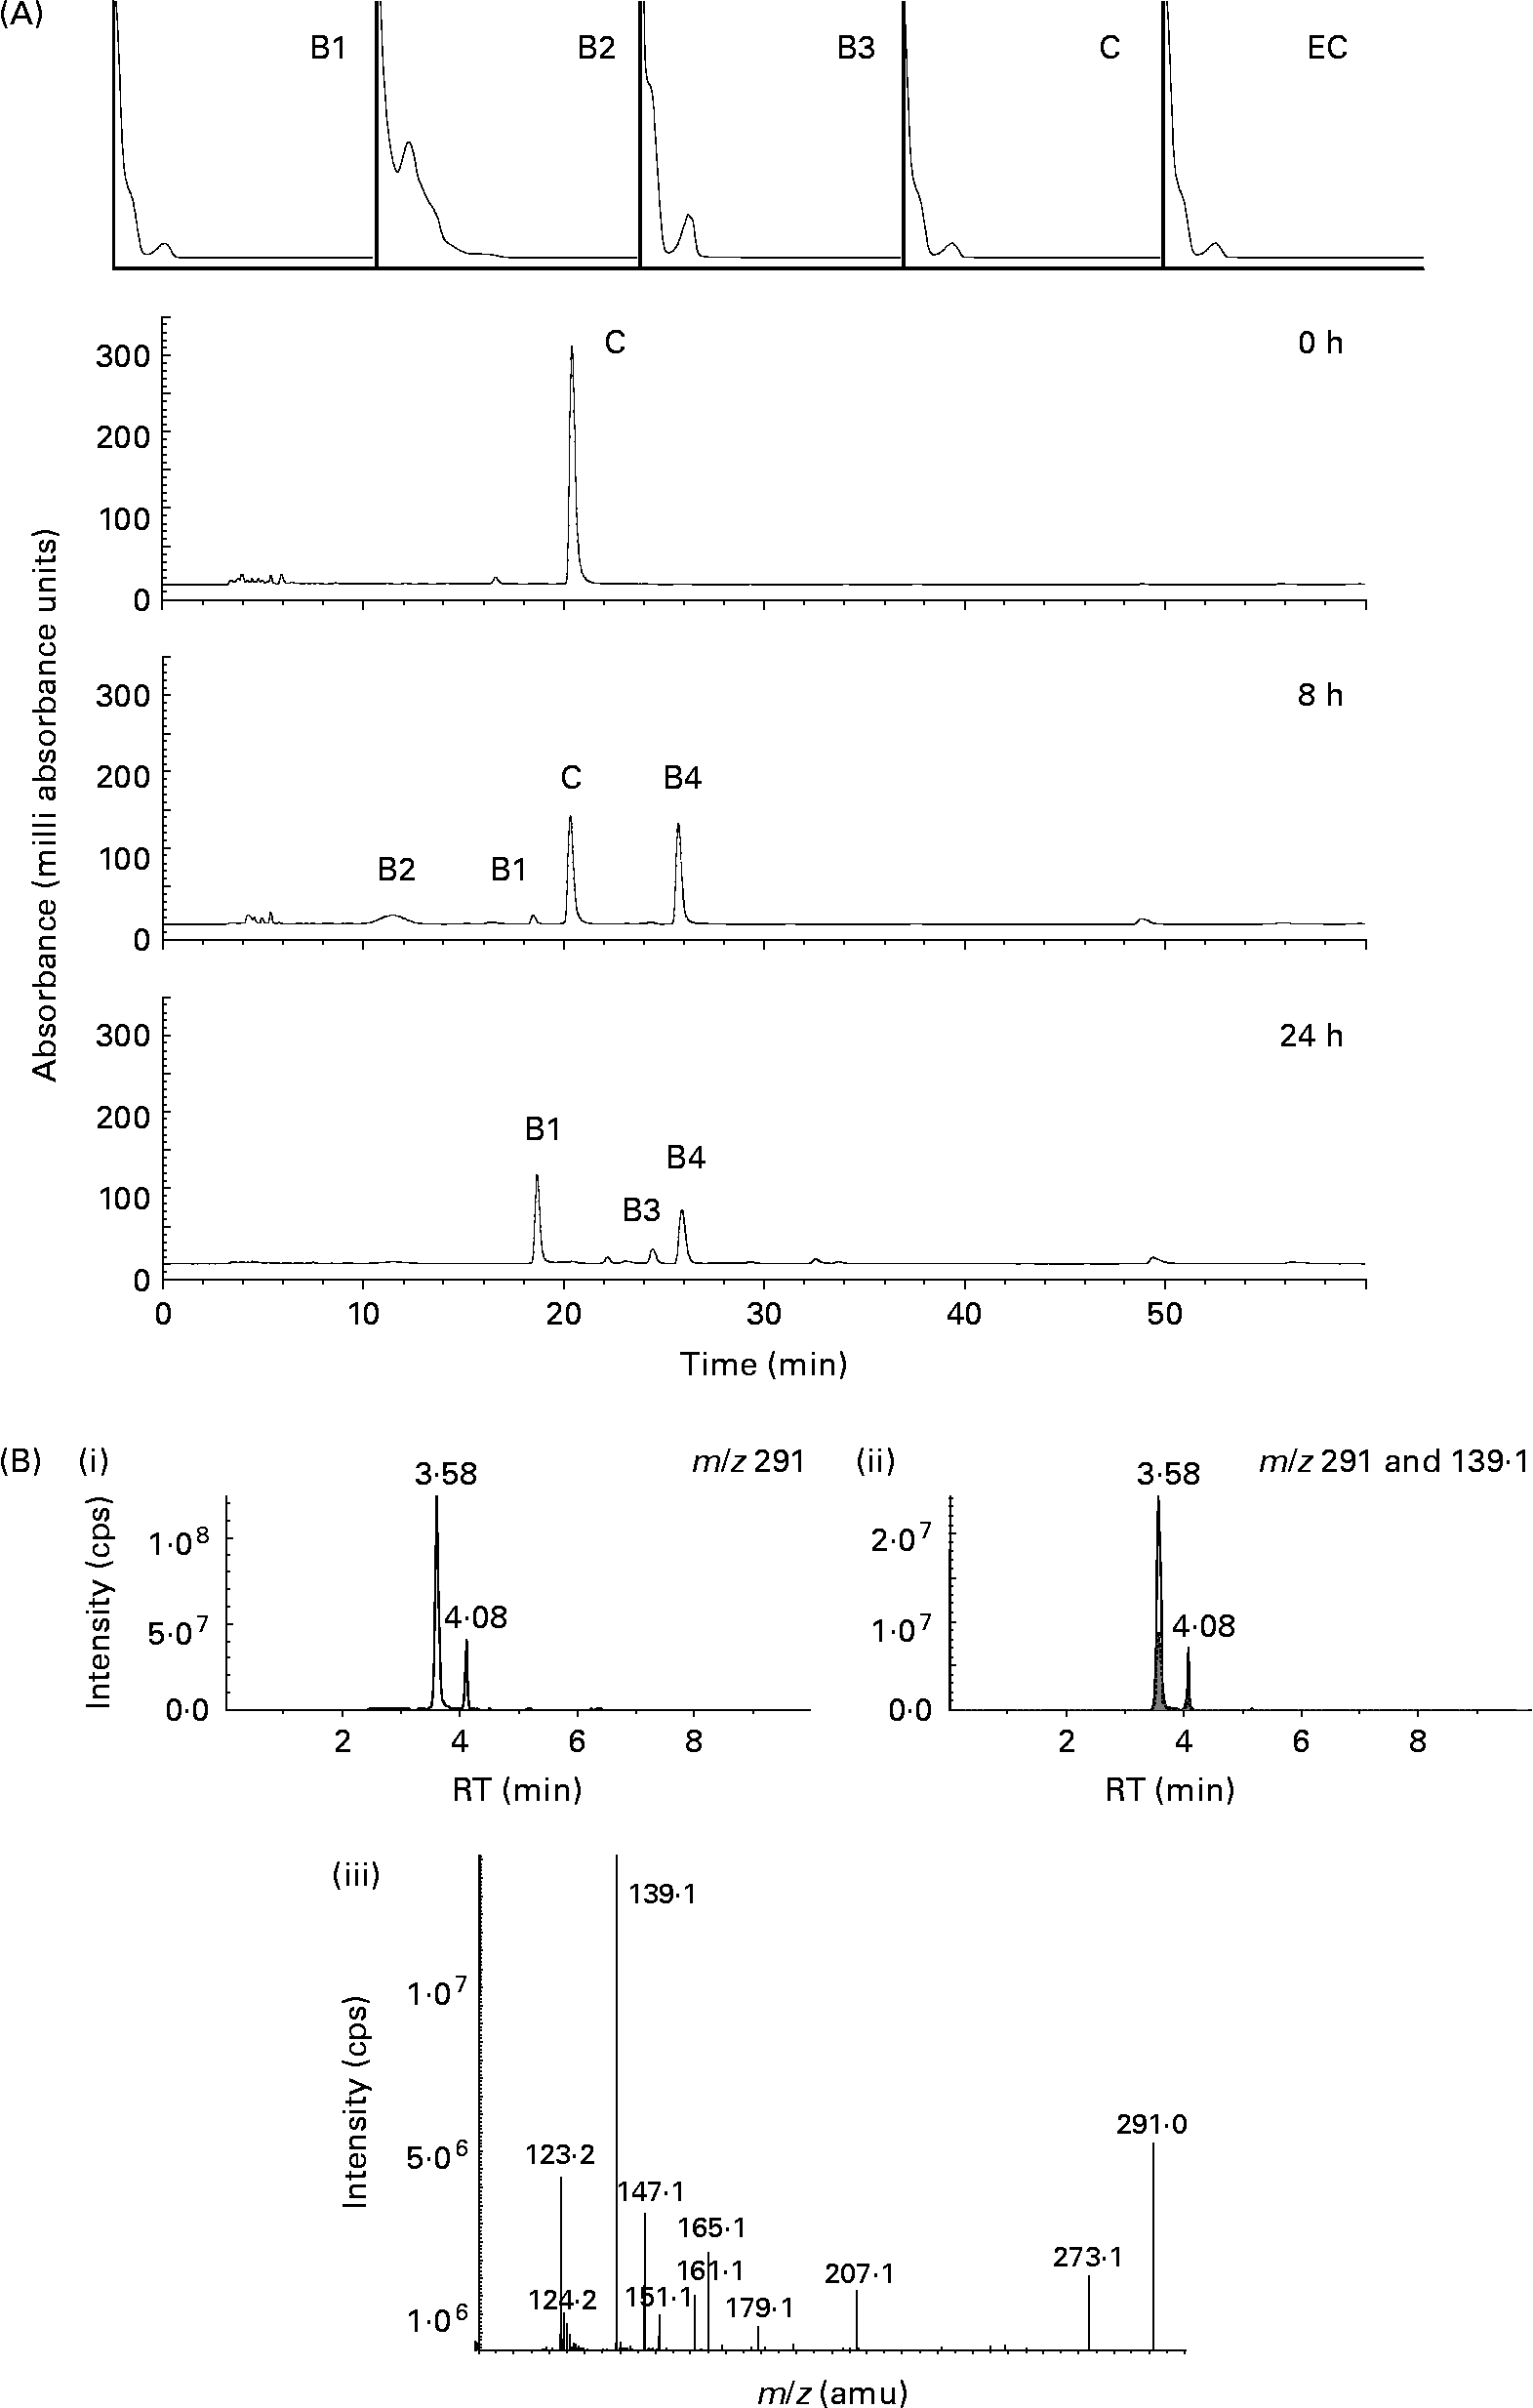
Fig. 2 Bacterial-dependent metabolism of (+)-catechin. (A) Typical HPLC chromatogram with photodiode array spectra (200–600 nm) of faecal supernatant fraction derived from the batch culture with (+)-catechin at 1000 mg/l concentration after 0, 8 and 24 h of incubation with human colonic bacteria. (+)-Catechin (C) and four new compounds (B1–B4) were detected. (B) LC-MS/MS analysis of the same sample indicating the presence of a compound with m/z 291 at two retention times. (i) Selected ion scan of [n-H+]+m/z 291; (ii) selected ion scan [n-H+]+m/z 291 overlaid with [n-H+]+m/z 139 (▒); (iii) fragment ion spectrum of epicatechin showing the abundant signal at m/z 139 representing the retro Diels–Alder product deriving from the A-ring. cps, Counts per s; RT, retention time; amu, atomic mass units.
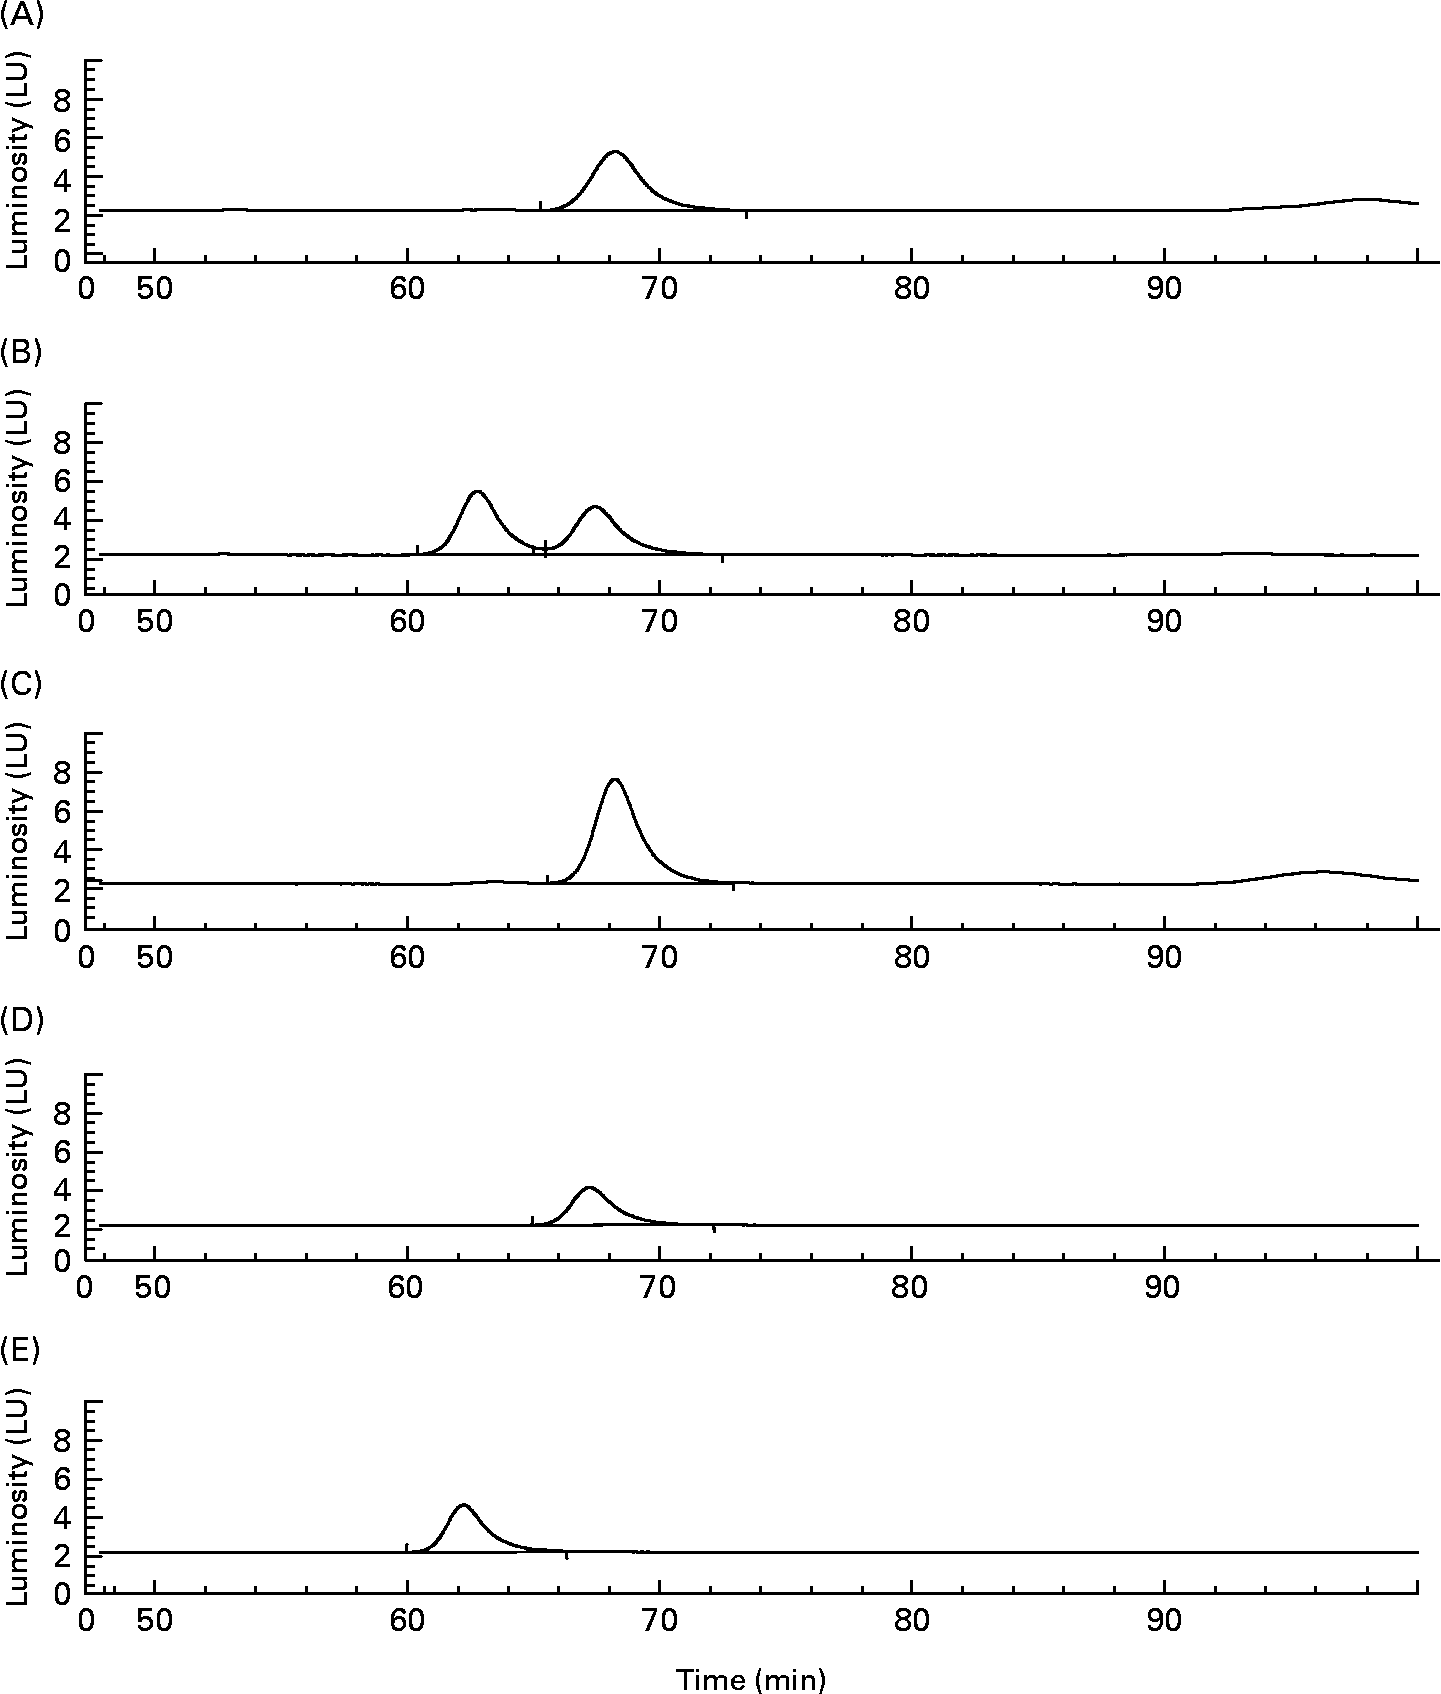
Fig. 3 Chiral separation of peak B4 derived from the batch culture with (+)-catechin following 10 h fermentation. Indication that metabolite B4 (see Fig. 2) relates to (+)-epicatechin. Detection was by fluorescence (excitation 276 nm and emission 316 nm). The sample containing peak B4 (A) was spiked with authentic ( − )-epicatechin (B) or (+)-epicatechin (C). (D) (+)-Epicatechin standard; (E) ( − )-epicatechin standard. LU, luminosity units.
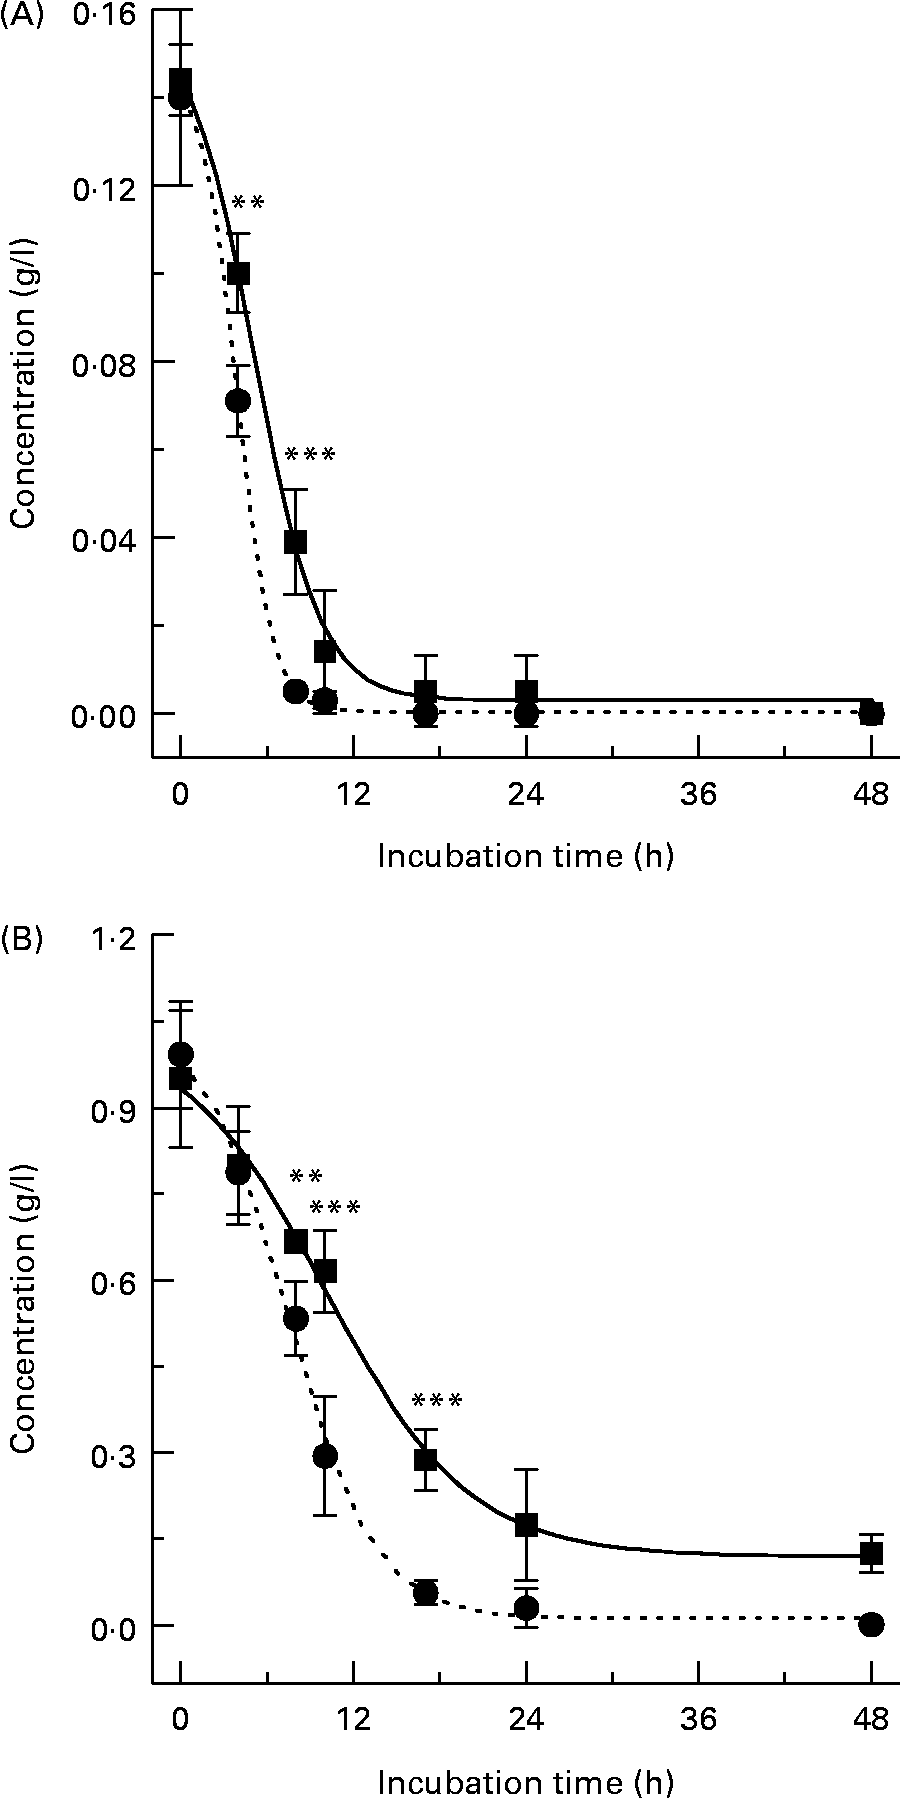
Fig. 4 Metabolism profiles of (+)-catechin (●) and ( − )-epicatechin (■) from three individual donors performed in duplicate. (A) Flavanol (150 mg/l); (B) flavanol (1000 mg/l). Results are expressed as amount (g/l) in batch-culture medium. Values are means (n 6), with standard deviations represented by vertical bars. Significant difference between (+)-catechin and ( − )-epicatechin concentrations in batch-culture vessels: **P < 0·01, ***P < 0·001.
Microflora-induced metabolism of both ( − )-epicatechin and (+)-catechin was also observed in the presence of the favourable bacterial carbon sources, sucrose and the known prebiotic, FOS (Fig. 5), indicating bacterial metabolism of flavanols occurs even in the presence of preferential energy sources. Previous investigations have indicated that flavonoids may be metabolised by the gut microflora, although this is the first time their metabolism has been observed in the presence of alternate energy sources, a model which is more reflective of in vivo conditions. The extent of ( − )-epicatechin metabolism by bacteria was significantly greater at both 8 h and 10 h (P < 0·01) in the presence of both sucrose and FOS, with the combination of ( − )-epicatechin +1 % FOS resulting in the greatest reduction in flavanol relative to ( − )-epicatechin alone (Fig. 5 (A)). This was also apparent with (+)-catechin metabolism, with both sucrose and FOS significantly increasing the extent of bacterial (+)-catechin metabolism at 4 h (P < 0·01), 8 h and 10 h (P < 0·001) (Fig. 5 (B)). There were no significant differences between the flavanol + sucrose treatments and flavanol + FOS treatments (P>0·05).
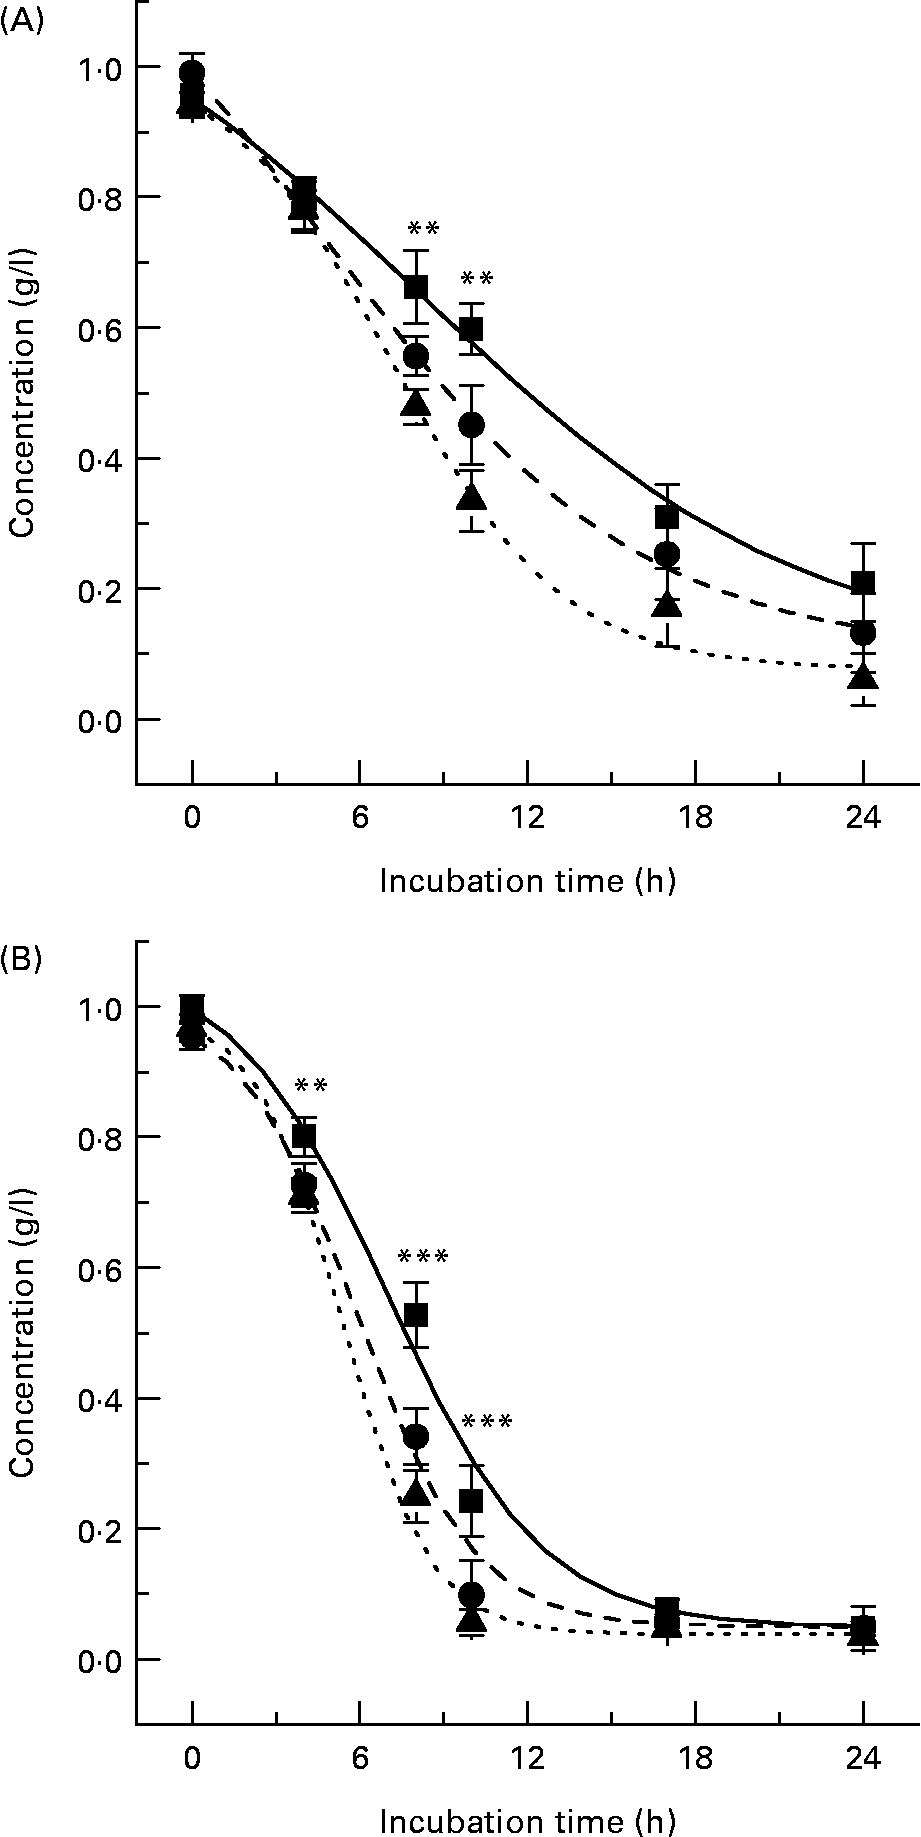
Fig. 5 Flavanol metabolism in the presence of carbohydrates. ( − )-Epicatechin (A) and (+)-catechin (B) assimilation profiles in pH-controlled batch cultures in the presence of 1 % fructo-oligosacchrides (FOS) or 1 % sucrose. (A): (■), ( − )-Epicatechin; (●), ( − )-epicatechin +1 % sucrose; (▲), ( − )-epicatechin +1 % FOS. (B): (■), (+)-Catechin; (●), (+)-catechin +1 % sucrose; (▲), (+)-catechin +1 % FOS. Results are expressed as concentration (g/l) in batch-culture medium. Values are means (n 6), with standard deviations represented by vertical bars. Mean values of flavanol only and flavanol + FOS/sucrose were significantly different: **P < 0·01, ***P < 0·001.
Changes in antioxidant potential
The metabolism of both flavanols over the 24 h batch-culture incubation period was paralleled by decreases in the total antioxidant capacity of the batch-culture mixtures. Batch cultures containing ( − )-epicatechin (150 mg/l) showed a time-dependent reduction in antioxidant capacity, which achieved significance at 17 and 24 h of incubation with the microflora. Similarly, there was a decrease in antioxidant activity in batch cultures exposed to (+)-catechin (Fig. 6). However, vessels treated with either (+)-catechin or ( − )-epicatechin had increased antioxidant activity compared with untreated vessels at all time points with the exception of 24 h (Fig. 6).
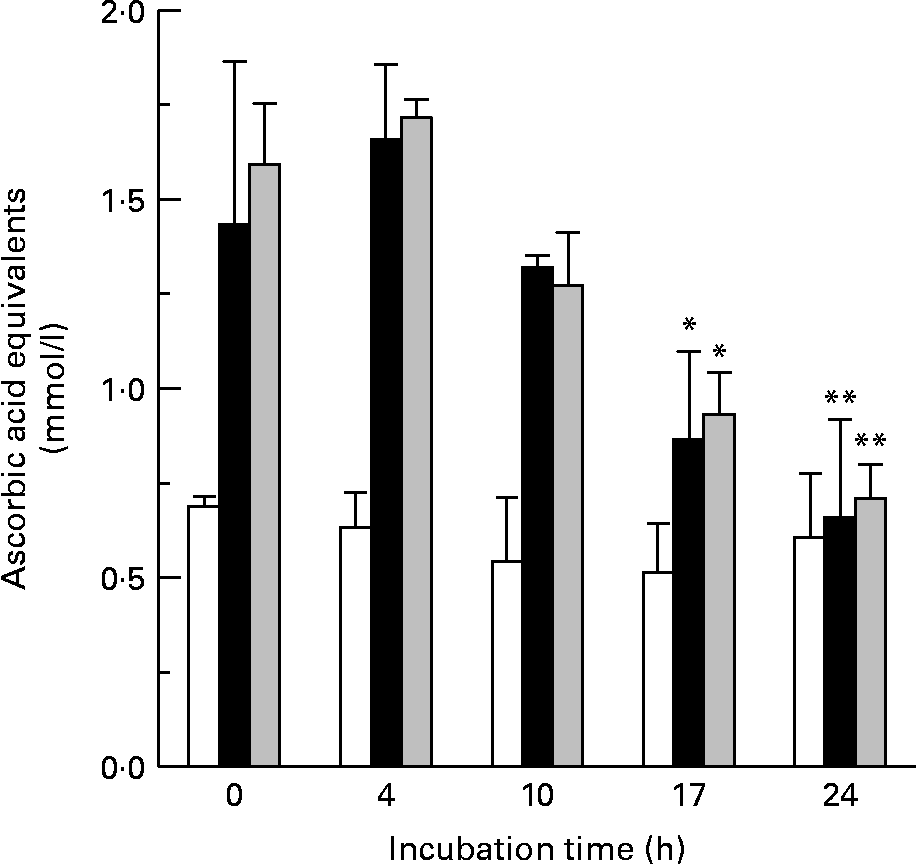
Fig. 6 The effect of bacterial metabolism on antioxidant potential. Changes in the antioxidant potential of batch-culture mixtures over time following incubation with basal medium only (□), ( − )-epicatechin (150 mg/l) (■) and catechin (150 mg/l) (![]() ) were determined by the ferric-reducing antioxidant power assay. The antioxidant activity is expressed as ascorbic acid equivalents (μmol/l). Values are means (n 6), with standard deviations represented by vertical bars. Mean antioxidant capacity was significantly decreased compared with that at time 0: *P < 0·05, **P < 0·01.
) were determined by the ferric-reducing antioxidant power assay. The antioxidant activity is expressed as ascorbic acid equivalents (μmol/l). Values are means (n 6), with standard deviations represented by vertical bars. Mean antioxidant capacity was significantly decreased compared with that at time 0: *P < 0·05, **P < 0·01.
Flavanol-induced changes in specific bacterial groups
In order to assess the changes in bacterial populations in response to ( − )-epicatechin or (+)-catechin exposure, we utilised FISH analysis. Previous in vitro and in vivo studies designed to assess potential prebiotic effects of different substrates have successfully utilised FISH analysis to enumerate different bacterial groups found in the human faecal microflora and their changes over time(Reference Olano-Martin, Gibson and Rastall24, Reference Tuohy, Kolida, Lustenberger and Gibson25). FISH analysis was performed at time points where more than 50 % of flavanol had been metabolised by the faecal microflora in the mixed batch culture. This was revealed by HPLC analysis to be 10 h for experiments with (+)-catechin and ( − )-epicatechin at 150 mg/l and 17 h at 1000 mg/l (Fig. 4). ( − )-Epicatechin (150 mg/l) caused a significant increase in the growth of the beneficial bacterial group, Eubacterium rectale–C. coccoides (Fig. 7 (A)), as revealed by an increase in the number of this bacterial group in vessels containing ( − )-epicatechin, compared with the number found in control vessels, at the same time point (index of specific bacteria). However, ( − )-epicatechin did not induce any other significant changes in the microflora either at the 150 or 1000 mg/l concentration. The significant increase in Eubacterium rectale–C. coccoides was only observed at the lower concentration of ( − )-epicatechin (Fig. 7 (A)). There was no significant difference between the low flavanol (150 mg/l) treatment and the high flavanol (1000 mg/l) treatment (P>0·05).
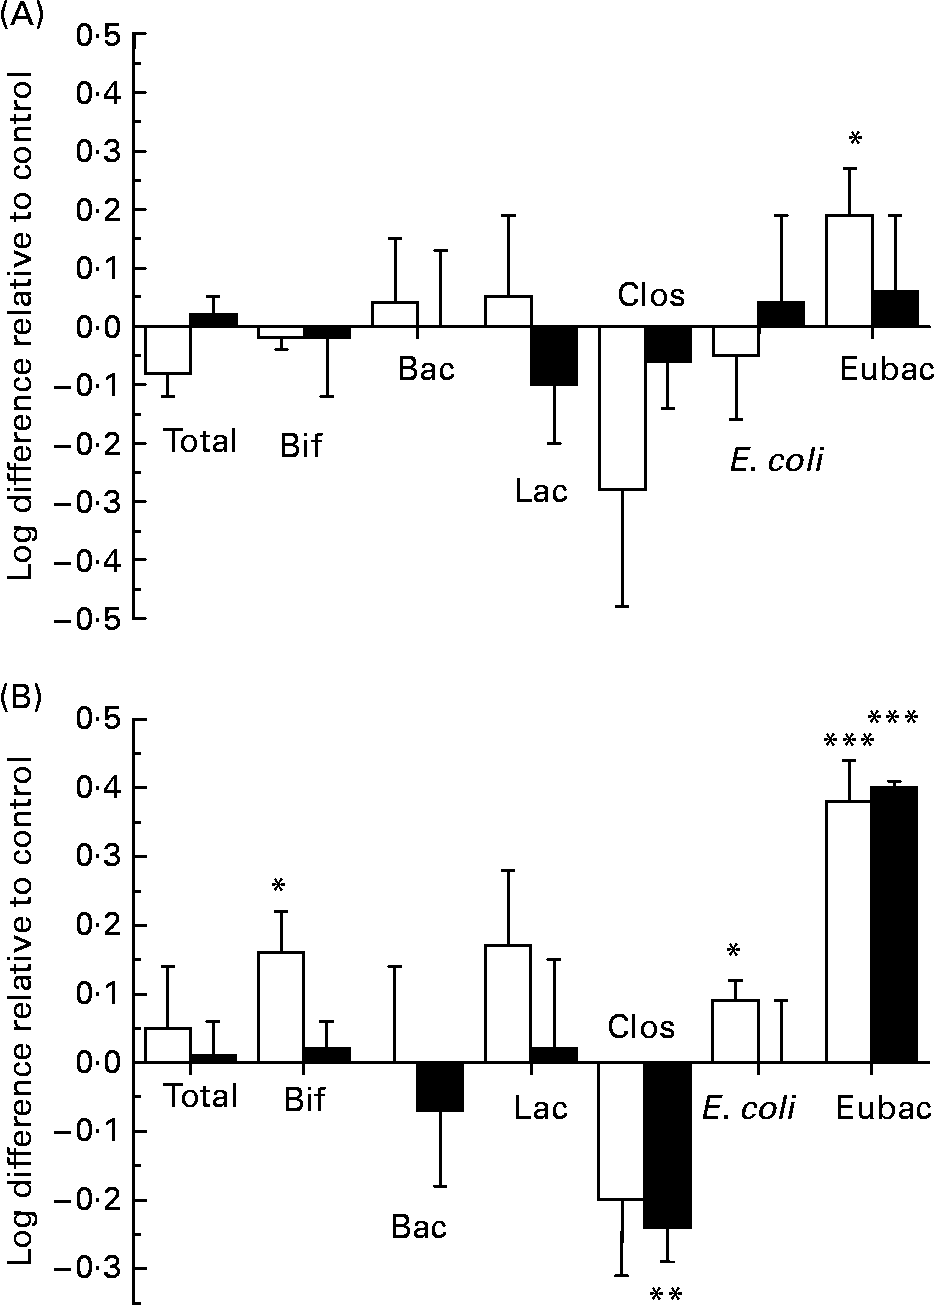
Fig. 7 Influence of flavanol monomers on the colonic microflora. Changes in the bacterial populations during the fermentation of ( − )-epicatechin (A) and (+)-catechin (B) in a pH-controlled faecal batch culture. Samples were taken at 10 and 17 h for 150 mg/l (□) and 1000 mg/l (■) concentrations, respectively and analysed by fluorescent in situ hybridisation. Bif, Bifidobacterium spp.; Bac, Bacteroides spp.; Lac, Lactobacillus/Enterococcus spp.; Clos, Clostridium histolyticum group; E. coli, Escherichia coli; Eubac, C. coccoides–Eubacterium rectale group. Bacterial changes, calculated using the ‘index of specific bacteria’, are expressed as log10 cells/ml. Changes in bacterial growth were calculated by comparing the number of a specific bacterial group in the treatment group with the number found in a control group, at the same time point. Values are means (n 6), with standard deviations represented by vertical bars. Mean value was significantly different from that of the control: *P < 0·05, ***P < 0·001.
In contrast, (+)-catechin exposure resulted in a greater modification in the growth of the bacterial groups compared with that seen with ( − )-epicatechin (Fig. 7 (B)). There was a significant decrease in the growth of the C. histolyticum group at the 1000 mg/l concentration, relative to control, and a marked increase in the growth of the beneficial bacterial group of C. coccoides–Eubacterium rectale at both the 150 mg/l and 1000 mg/l exposure concentrations. Furthermore, there were increases in both Lactobacillus spp. and Bifidobacterium spp. following (+)-catechin (150 mg/l exposure), which achieved significance for the latter. There were also small, but significant increases, in the growth of E. coli in response to catechin (150 mg/l) incubation with the bacterial culture. There was no significant difference in the total number of microbes measured in vessels containing either flavanol (150 or 1000 mg/l), compared with the total number measured in the control vessels.
Discussion
In recent years there has been much interest in the development of nutritional products that are based on a prebiotic principle. Prebiotics are non-digestible food ingredients that beneficially affect the host by selectively stimulating the growth and/or activity of one, or a limited number of, beneficial bacteria in the colon(Reference Gibson, Beatty, Wang and Cummings8). Although the effects of many carbohydrates have been investigated as potential prebiotics, for example inulin and FOS, few studies have considered the prebiotic potential of other dietary components. Flavonoids are potential prebiotic candidates as they are known to undergo limited absorption and metabolism in the upper gastrointestinal tract (stomach, duodenum and jejunum), with the majority reaching the large intestine intact(Reference Spencer, Schroeter, Rechner and Rice-Evans26) where approximately 200 g of material (water, bacteria, food particles and mucus) are present at any given time(Reference Frayn and Frayn27). Green tea contains up to 8·5 mg ( − )-epicatechin/100 ml and 2·8 mg (+)-catechin/100 ml(Reference Manach, Scalbert, Morand, Remesy and Jimenez28), 100 g dark chocolate contains, on average, 42 mg ( − )-epicatechin and 12 mg (+)-catechin. In the present study we show that the metabolism of the flavanol monomers, ( − )-epicatechin and (+)-catechin, by a human bacterial population representative of the distal part of the human large intestine leads to changes in the growth of specific bacterial populations. Specifically, (+)-catechin, and to a lesser extent ( − )-epicatechin, had a positive effect on the growth of C. coccoides–Eubacterium rectale, a bacterial group which has been associated with beneficial effects at the cellular and systemic level due to their ability to generate SCFA by saccharolytic metabolism(Reference Gibson29). The flavanol-induced increases in this bacterial group seen in our investigations may result in an increased potential for saccharolytic metabolism in the large intestine, an event believed to be beneficial primarily due to the production of the SCFA acetate, propionate and butyrate. The generation of such SCFA in the large intestine is considered positive for gut health as they have been linked to an inhibition of pre-neoplastic proliferation and an acceleration of the conversion of cholesterol into bile acids(Reference Wilson30).
(+)-Catechin exposure also resulted in the small, but significant, increase in the growth of bifidobacteria, a group which has been strongly associated with positive effects in the large intestine(Reference Gibson, Beatty, Wang and Cummings8), through their ability to inhibit the growth of pathogenic micro-organisms. (+)-Catechin-induced changes in bifidobacteria may stimulate the generation of organic acids, such as acetic and lactic acid in the colon(Reference Li, Lee and Sheng21) and may inhibit the ability of potential pathogenic species to colonise the gut epithelial lair(Reference Gibson and Fuller15). Furthermore, (+)-catechin-induced decreases in the C. histolyticum group, a group of mostly proteolytic bacteria, may be particularly relevant in the distal large intestine where proteolytic metabolism has been proposed to contribute to the progression of colonic cancer and the onset of inflammatory bowel disease(Reference Hughes, Magee and Bingham31). Bacterial groups, such as Bacteroides and Clostridium favour proteolytic fermentation, which results in the production of ammonia, thiols, amines and indoles, endproducts that have been connected with neoplastic growth and cancer(Reference Matsui, Matsukawa, Sakai, Nakamura, Aoike and Kawai32, Reference Gibson, McFarlan, Hay and Macfarlane33). It is more difficult to interpret the small E. coli increases observed in response to (+)-catechin exposure, as the probe used in our investigations enumerates both commensal and pathogenic strains of E. coli. Further investigation is required to identify the specific strains affected in our system. However E. coli is one of the most common bacteria inhabiting the intestinal tract of humans, and thus the observed increase is unlikely to represent a change in the small number of strains responsible for diarrhoeal diseases(Reference Stenutz, Weintraub and Widmalm34).
The significant changes in bacterial composition in response to (+)-catechin were accompanied by its rapid conversion to (+)-epicatechin. Recently, Lee et al. reported similar conversions of catechin to epicatechin upon bacterial incubation, although in their study they did not confirm the specific isomeric form as was done in the present investigation(Reference Lee, Jenner, Low and Lee22). In contrast to the present study, we only observed the conversion of (+)-catechin to (+)-epicatechin in the presence of bacteria, suggesting that it is the microflora that mediate this conversion. Moreover, our data indicate that the reduction in flavanol monomer concentration in batch-culture vessels is entirely due to specific bacterial-dependent metabolism, rather than unspecific bacterial-independent degradation, as we did not observe degradation of either flavanol, for example by their oxidation, in our anaerobic batch-culture environment. As there were no major differences in the other metabolites produced from either (+)-catechin and ( − )-epicatechin, with both yielding 5-(3′,4′-dihydroxyphenyl)-γ-valerolactone, 5-phenyl-γ-valerolactone and phenylpropionic acid following incubation with the microflora, the greater influence of (+)-catechin on the growth of specific microflora may be the result of the bacterial-driven formation of (+)-epicatechin from (+)-catechin.
The formation of valerolactone species from flavanols in the large intestine has previously been reported(Reference Deprez, Brezillon, Rabot, Philippe, Mila, Lapierre and Scalbert20, Reference Li, Lee and Sheng21, Reference Li, Meng, Winnik, Lee, Lu, Sheng, Buckley and Yang35, Reference Meselhy, Nakamura and Hattori36) and such metabolic products may represent potential bioactive metabolites of flavanols in vivo following their absorption into the circulation via the gut wall. This generation of metabolites was also marked by a general reduction in the antioxidant potential of the batch-culture mixture, suggesting that species such as valerolactones possess lower antioxidant potential compared with native flavanols. However, despite this significant reduction in antioxidant activity, regular flavanol-rich food consumption is likely to result in a general increase in the antioxidant capacity in the large intestine. This may be relevant in reducing oxidative stress in the large intestine that occurs as a result of inflammatory events experienced during inflammatory bowel disease(Reference Garsetti, Pellegrini, Baggio and Brighenti37). Previous studies have shown that dietary-derived antioxidants may exert a beneficial effect on large-intestinal disorders, such as inflammatory bowel diseases, where they act to reduce the levels of certain cytokines and scavenge oxidation products derived from other dietary factors or from bacterial oxidative metabolism(Reference Pearson, Jourd'heuil and Meddings38, Reference Reimund, Allison, Muller, Dumont, Kenney, Baumann, Duclos and Poindron39).
The generation of metabolic products following incubation with the bacteria suggests that flavanols may be potential nutrient sources for the bacteria. Indeed, both flavanols were metabolised by the human colonic bacteria even in the presence of carbohydrate energy sources, notably sucrose and the pre-biotic FOS, suggesting that the metabolism of flavanols may occur even in the presence of more favourable carbon sources. These observations suggest that these flavanol monomers may be capable of influencing the large-intestinal bacterial population even in the presence of other nutrients, such as carbohydrates and proteins. Our data indicate that flavanols have an ability to influence the growth of specific large-intestinal bacteria and that this ability may be linked to specific metabolic transformations, such as the bacterial conversion of (+)-catechin to (+)-epicatechin. However, we acknowledge that this is an in vitro investigation using a batch-culture model and it may not necessarily explain with certainty the effects of flavanols in humans. Future human intervention studies will provide further insight into the potential of flavanol monomers to act as prebiotics in the human large intestine in vivo.
Acknowledgements
The present study was supported by Mars Incorporated and a Reading University Endowment Trust Fund Studentship.


