


1. Introduction
Applications for medicine cover a broad spectrum of tools, procedures, and technology with the goal of enhancing human health and welfare. These applications use developments in medicine, science, and engineering to identify, manage, track, and avoid a range of medical issues [Reference Li, Song, Lin, Wang, Guo and Chen1]. The fast evolution of medical applications is still being pushed by continuing research and technology developments. These developments have the power to change the way healthcare is provided, boost patient outcomes, and improve wellbeing in general.
Diabetes is a fatal disease that can impair the kidneys, nervous system, eyes, and neurological system, among other vital organs. Diabetes frequently leads to diabetic retinopathy (DR) because of the deteriorating changes in the blood vessels supplying the retina [Reference Zhang, Wu, Wang, Wu, Hu, Jia and Sun2–Reference Bunge, Dalal, Gray, Culler, Brown, Quaggin, Srivastava and Gill4]. There are five different types of DR: none, mild non-proliferative (NPDR), moderate non-proliferative (moderate NPDR), severe non-proliferative (severe NPDR), and proliferative. In the fundus retinal picture, lesions seem to be bleeding blood and fluids. After DR diagnosis, red and bright lesions are the kind of lesions that are typically discovered. The bright lesions are created by soft and hard exudates (EX), whilst the red lesions are caused by microaneurysms (MA) and hemorrhage (HM). The larger spots are referred to as HM, while the smaller dark red specks are referred to as MA. Soft EX appears as fluffy yellowish-white flecks when nerve fibers are injured, whereas hard EX appears as recognizable yellow areas [Reference Garifullin, Lensu and Uusitalo5–Reference Zhao, Ren, Zhang, Cao, Wang, Meng, Wu, Zhang, Zou, Xu, Li, Zhang, Cooper, Tong and Liu6]. A person’s vision could be completely lost in the DR’s most severe stage. Therefore, preventing the patient’s vision loss requires the early detection of DR.
Although electroretinography may play a significant role in the first diagnosis of DR, fundus examination remains the mainstay of early diagnosis in clinical settings for detecting the retinal blood flow and retinal blood vessel caliber. Fundus photography (a rapid, noninvasive, well-tolerated, and widely available imaging technique) is one of the most used methods for determining the level of DR [Reference Islam, Yang, Poly, Jian and (Jack) Li7–Reference AbdelMaksoud, Barakat and Elmogy8]. Fundus images are used by ophthalmologists to grade the severity of DR and diagnose retinal lesions at a high resolution. However, manually detecting DR from fundus images requires a high level of expertise and labor from a licensed ophthalmologist, particularly in densely populated or remote areas like India and Africa, where the proportion of people with diabetes and DR is expected to rise dramatically in the coming years [Reference Araujo, Aresta, Mendonça, Penas, Maia, Carneiro, Mendonça and Campilho9], but the number of ophthalmologists is disproportionately low.
To manually diagnose this medical image, takes a lot of time and requires specialists with an in-depth understanding of detecting this eye condition from medical imaging and other criteria. The diagnosis also becomes expensive when made by specialists in medicine [Reference Tsiknakis, Theodoropoulos, Manikis, Ktistakis, Boutsora, Berto, Scarpa, Scarpa, Fotiadis and Marias10]. Due to human limitations, only a specific number of patients can be treated at once. The method is also susceptible to human error, which might happen frequently during the numerous medical diagnosis procedures carried out by doctors. Therefore, the need to receive a different viewpoint is frequently highlighted for persons who have received a serious medical diagnosis. Due to all of these drawbacks, the automation process is necessary and will save costs, decrease diagnostic mistakes, and accelerate the procedure so that lots of patients may be handled continuously [Reference Yue, Li, Zhou, Zhou, Liu and Wang11, Reference Saha, Xiao, Bhuiyan, Wong and Kanagasingam12]. This has motivated the scientific community to develop computer-aided diagnosis techniques that would reduce the expense, time, and effort necessary for a medical practitioner to diagnose DR.
Numerous strategies, including a unique unsupervised technique, have been looked into, to build a system with high accuracy. The opportunity to develop deep learning (DL) [Reference Gayathri, Gopi and Palanisamy13, Reference Ruamviboonsuk, Tiwari, Sayres, Nganthavee, Hemarat, Kongprayoon, Raman, Levinstein, Liu, Schaekermann, Lee, Virmani, Widner, Chambers, Hersch, Peng and Webster14] applications for precise DR detection and classification, as well as for the detection and segmentation of the fovea in the retinal image and pixel-level exudate detection, has also been created because of the latest developments in artificial intelligence and the increase in computational resources and capabilities. A deep neural network with multiple layers of neurons is known as a CNN and is used in deep learning. The neurons in the layer above one another are all linked together. CNN has a variety of applications in the field of picture categorization. DL is quickly advancing, which can be good for the fields of computer vision and medical image processing, but there are worries about DL-based medical diagnosis due to the DL classifier’s lack of interpretability and requirement for a large amount of training data [Reference Katada, Ozawa, Masayoshi, Ofuji, Tsubota and Kurihara15, Reference Hsieh, Chuang, Jiang, Chang, Yang, Yang, Chan, Kao, Chen, Lin, Tsai and Chen16]. As a result, a novel original concept is needed in the segmentation and classification phases to qualify the work on earlier DR detection from fundus images, which made precise detection with high accuracy.
The literature review for the proposed model is given as follows, Das et al. [Reference Das, Kharbanda, M, Raman and D17] presented a pre-processed fundus scans by extracting branching blood veins using the maximal primary curvature method based on the highest eigenvalues of the Hessian matrix. However, the CNN bottleneck increased memory and space requirements, elevating computational and temporal complexities. Mohammadpoory et al. [Reference Mohammadpoory, Nasrolahzadeh, Mahmoodian and Haddadnia18] introduced an automated method utilizing visibility graph and Radon transform for distinguishing between grades 0 to 3 of diabetic retinopathy (DR) from fundus photographs. However, it was not suitable for all image modalities or applications, and performance varied between different picture types. Phridviraj et al. [Reference Phridviraj, Bhukya, Madugula, Manjula, Vodithala and Waseem19] introduced a deep learning approach for diagnosing DR at different stages of the diagnostic pipeline, utilizing fundus images. However, the development of various machine learning and deep learning algorithms for recognizing and diagnosing DR has not received enough attention in this research. Kumar et al. [Reference Kumar, Adarsh, Kumar and Singh20] proposed a method for DR detection in fundus images. But further research is needed for diagnosing proliferative DR, considering cotton wool and abnormal blood vessels. Islam et al. [Reference Islam, Abdulrazak, Nahiduzzaman, Goni, Anower, Ahsan, Haider and Kowalski21] employed the “APTOS 2019 Blindness Detection” and “Messidor-2” datasets to detect and classify DR severity stages using the SCL methodology. Future work involves lesion localization and validation with larger batch sizes. Melo et al. [Reference Melo, Mendonça and Campilho22] introduced a sliding band filter for initial microaneurysm (MA) candidate generation, followed by ensemble classification using filter responses, color, contrast, and shape information. Further enhancements, specifically integrating confidence scores with other image properties, are sought for developing a comprehensive computer-aided diagnosis system to distinguish between R0 and R1 photographs. Sungheetha et al. [Reference Sungheetha23], in this study, CNN was employed to extract features using deep networks. Deep learning algorithms are expected to be pivotal in incorporating extensive archives in future applications. Mayya et al. [Reference Mayya, Kamath and Kulkarni24] introduced an automated method utilizing retinal fundus images to identify and categorize non-proliferative DR. Evaluation against similar systems showed the proposed method’s effectiveness, but its performance relies on the input image quality. Shankar et al. [Reference Shankar, Sait, Gupta, Lakshmanaprabu, Khanna and Pandey25] proposed an automated deep learning model for DR detection and classification. Despite these advancements, there is a recognized need to enhance image quality through improved filtering techniques. Daanouni et al. [Reference Daanouni, Cherradi and Tmiri26] proposed a lightweight custom CNN for diagnosing DR using optical coherence tomography images, targeting IoT applications. But, to obtain high prediction accuracy, the MobileNet model needs to be combined with a shallow neural network and a pre-trained feature map.
The main contribution of the paper is as follows:
-
To address the existing issues and effectively predict the earlier stage of DR from fundus images, a novel earlier smart prediction of diabetic retinopathy from fundus images under the innovative ResNet Optimization Maneuver is introduced.
-
To effectively extract the unique features a Fractional Radon Transform with a Visibility Graph is introduced, in which the fine-scale texture information of the image is captured using a Generalized Cosine Fractional Radon Transform, and the observable spatial relationship between the pixel pairs in the image is analyzed using a Horizontal Weighted Visibility Graph.
-
For segmentation and classification, Morphological Black Hat Transform with Optimized ResNet Algorithm is implemented. Here, segmentation is done by using an Enriched Black Hat Transform-based Morphological operation which aids in enhancing and identifying fine dark regions among the pixels. For classification, ResNet-driven S-GOA is employed, which accurately predicts the various stages of DR.
The work that is being supplied consists of four chapters, the first of which is the introduction, a summary of the gap analysis, and literature review. The proposed work methodology is described in Section 2. Additionally, it covers the various research techniques used. Section 3 deals with the performance and comparison analysis. The work’s conclusion is discussed in section 4 which follows.
2. Earlier smart prediction of DR from fundus image under innovative ResNet optimization maneuver
In the early identification of DR, microaneurysms and hemorrhages are the most visible lesions. Fundus scans are frequently used to diagnose DR. A tiny, round red dot in the fundus, or microaneurysm is the first detectable symptom of DR. Currently, an experienced ophthalmologist manually assesses the fundus image to identify the DR because early DR prediction is still difficult. Hence, a novel earlier smart prediction of DR from fundus image under Innovative ResNet Optimization Maneuver is introduced to detect the earliest stage of the DR stage. Preprocessing, Feature Extraction, Segmentation, and Classification are the steps in DR detection. The fundus image is scaled during preprocessing and converted into a grayscale format. It is necessary to have an automated DR screening system that can recognize the condition quickly and accurately. The majority of the existing works focus on vessel features, optic disc characteristics, and color histograms. The existing works on DR prediction are limited because novel features like the number of microaneurysms in the retina, the number of dot and blot hemorrhages and their distribution in the retina, statistical measures like homogeneity, contrast, entropy, and energy, and changes in the thickness of the ganglion cell layer or the inner plexiform layer of the retina have not been taken into consideration. For better feature extraction a novel, Fractional Radon Transform with Visibility Graph is utilized to extract this grayscale image for processing. Which extracts novel features like the number of microaneurysms in the retina, the number of dot and blot hemorrhages in the retina, and their distribution, and also statistical measures like homogeneity, contrast, entropy, and energy, as well as retinal layer thickness, which is required for further processing in the prediction of DR. By using fractional angles and cosine transforms, the Generalized Cosine Fractional Radon Transform is used to effectively capture statistical measures in this image’s fine-scale texture information, while the Horizontal Weighted Visibility Graph is created based on the horizontal visibility correlation among data points, which in turn analyses the visible spatial relation between the pixel pairs in the image.
After extracting the features, a Gaussian filter is used to reduce the induced noise, which smoothes the image before segmentation and classification. Moreover, Segmentation is the very crucial phase in predicting the DR, where noise reduction, image smoothening, and the removal of gaps between the pixels are necessary for the exact segmentation output. The Hessian matrix and the morphological opening were both utilized in the previous works to determine the maximum main curvature. They however short fall in showing the tiny, finely detailed dark areas that were left out of the morphological opening process yet were still visible in the original fundus image. Hence, a novel groundbreaking algorithm named Morphological Black Hat Transform with Optimized ResNet Algorithm is introduced for segmentation and classification. Here, the segmentation is done by using an Enriched Black Hat Transform-based Morphological operation, in which the morphological operation is used to process the image based on the structure and shape contained within them, and the Enriched Black Hat Transformation is then applied to improve the dark, fine structures or features within a brighter background, which aids in enhancing and identifying fine dark regions among the pixels inside the eye samples. After segmentation, the image undergoes classification using a novel technique called ResNet-driven S-GOA (Socio Grasshopper Optimization Algorithm). This technique combines ResNet, which captures higher-level fine-segmented complex features and hierarchical patterns, with GOA, which predicts the stages of DR from fundus images. ResNet-driven S-GOA overcomes the existing problems in two-module work, providing better data flow and gradients for efficient learning and optimization resulting in greater performance.
The above Fig. 1 shows the architecture of the proposed model. In this, fundus image is taken as an input image. First, the fundus image is enlarged to the proper size and is transformed into a grayscale format, which streamlines the rest of the processing. Then, using the Fractional Radon Transform with a Visibility Graph, the features are recovered. This method extracts unique characteristics including the number of microaneurysms in the retina, the number and distribution of dot and blotting hemorrhages in the retina, statistical measurements, and retinal layer thickness. The extracted features are initially filtered using a Gaussian filter to attenuate the introduced noise before moving on to segmentation and classification. Enriched Black Hat Transform-based Morphological operation is used for segmentation, where the image is processed according to the shape and structure contained within them using the morphological operation, and then the Enriched Black Hat Transformation is performed to improve the dark fine structures. S-GOA powered by ResNet is then used for classification, which accurately predicts the DR stage.
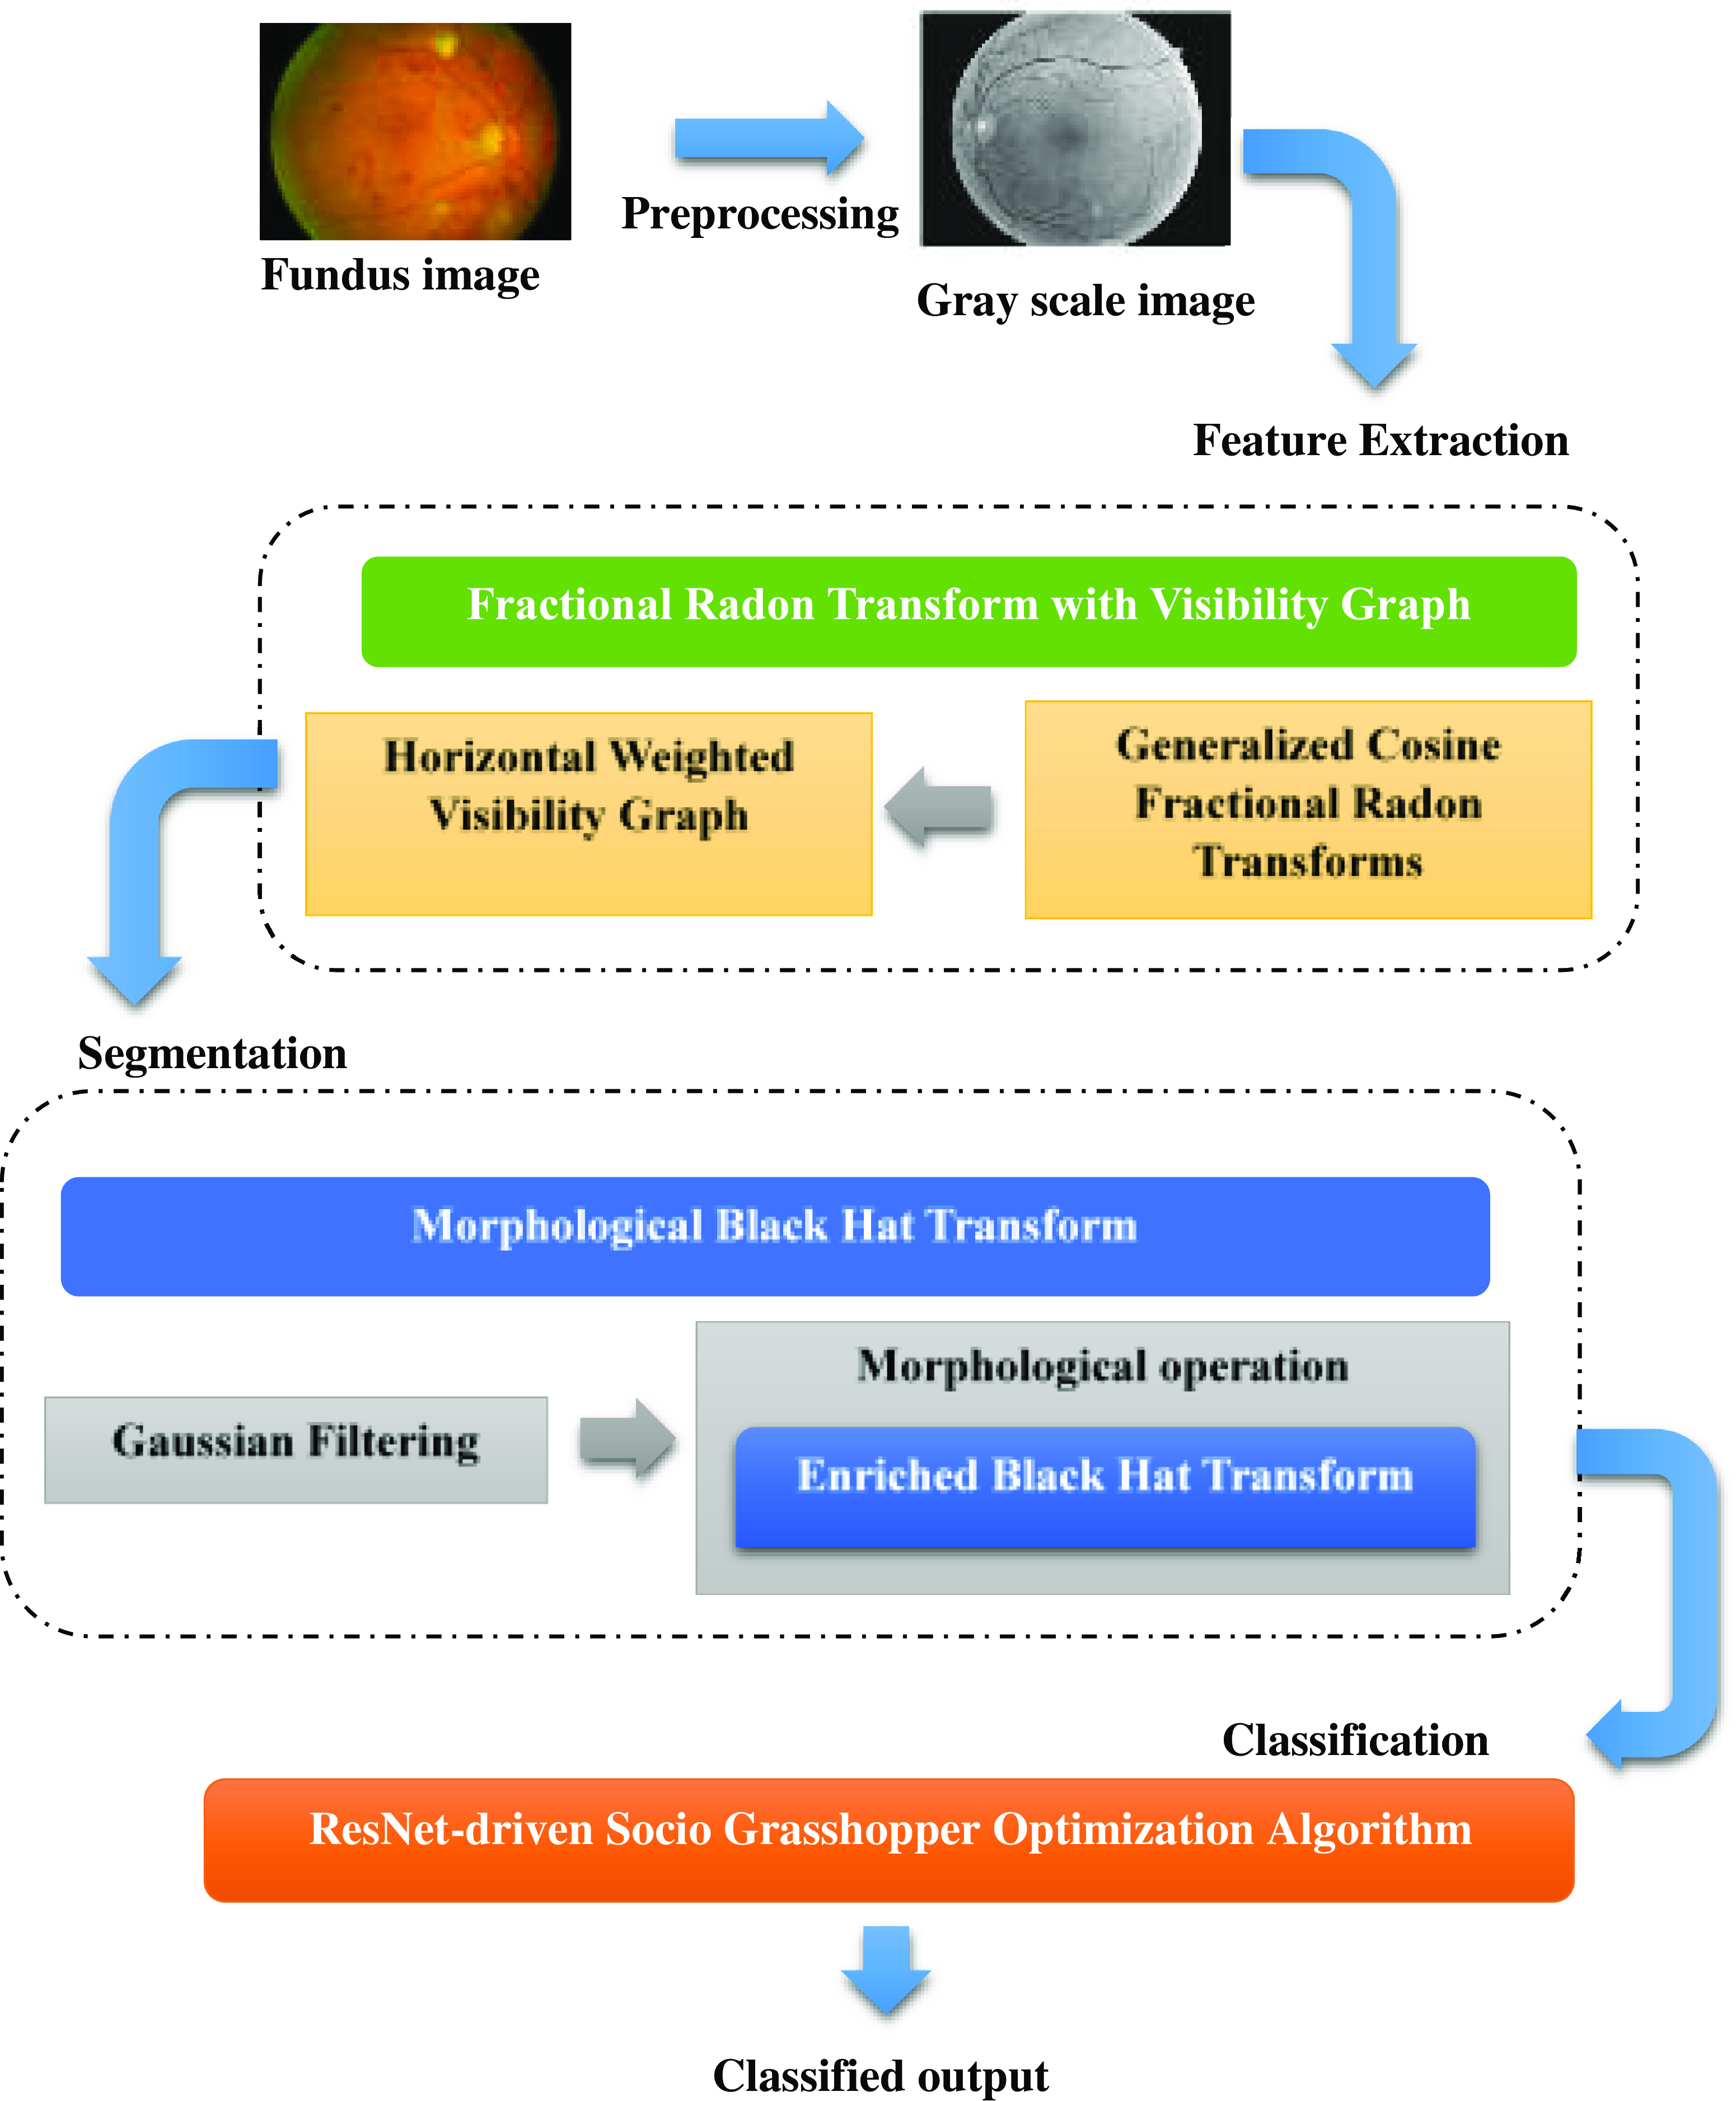
Figure 1. Architecture of the proposed model.
2.1. Fractional radon transform with visibility graph
To extract the novel feature from the image a Fractional Radon Transform with Visibility Graph has been introduced. Initially, the fundus image is resized and converted into a grayscale format. The majority of the undesired black pixels are eliminated from all of the fundus images in the proposed dataset without removing the region of interest. Therefore, using the bilinear interpolation method [Reference Mohammadpoory, Nasrolahzadeh, Mahmoodian and Haddadnia27], the clipped image is resized to 256 × 256 in order to reduce the network’s training time. One color pixel in an image is made up of three colors, red, green, and blue (RGB), with a total bit size of 24. These three colors are represented by three arrays. Grayscale images take up less space than RGB images because the gray pixel in a grayscale image is represented by just one dimension with an 8-bit bit size. Grayscale images enable the data more computationally effective by reducing its dimensionality. Additionally, they improve the visibility of key aspects of the image that are often connected to DR.
Then, to extract the features from the grayscale image Fractional Radon Transform with a Visibility Graph is proposed. In this, Generalized Cosine Fractional Radon Transform is used for capturing the image’s fine-scale texture information. Obtaining the picture’s projection along a given set of angles is intended when the fractional random transform is applied to an image with coordinates
 $\mathrm{g}(\mathrm{x},\mathrm{y})$
. The intensities of the pixels in each direction are added to create the projection. In the Radon domain, the picture lines are transformed into points. An equation for line is expressed in the following equation (1)
$\mathrm{g}(\mathrm{x},\mathrm{y})$
. The intensities of the pixels in each direction are added to create the projection. In the Radon domain, the picture lines are transformed into points. An equation for line is expressed in the following equation (1)
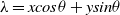 \begin{equation}\lambda =\textit{xcos}\theta +\textit{ysin}\theta\end{equation}
where
 $\lambda$
is the shortest path from the coordinate system’s origin and
$\lambda$
is the shortest path from the coordinate system’s origin and
 $\theta$
is the fractional angle. Fractional random transform [Reference Tavakoli28] is expressed in the following equation (2)
$\theta$
is the fractional angle. Fractional random transform [Reference Tavakoli28] is expressed in the following equation (2)
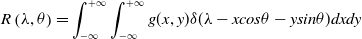 \begin{equation}R\left(\lambda,\theta \right)=\int _{-\infty }^{+\infty }\int _{-\infty }^{+\infty }g(x,y)\delta (\lambda -\textit{xcos}\theta -\textit{ysin}\theta )dxdy\end{equation}
Two-dimensional data are transformed into single-dimensional parallel and vertical projections at fractional angles
 $\theta$
using the fractional radon transform. By permitting non-integer projection angles, the Fractional Radon Transform expands the Radon transform. In addition to the conventional horizontal and vertical projections, this makes it possible to analyze image features in other orientations.
$\theta$
using the fractional radon transform. By permitting non-integer projection angles, the Fractional Radon Transform expands the Radon transform. In addition to the conventional horizontal and vertical projections, this makes it possible to analyze image features in other orientations.
Cosine transform [Reference Yuan, Liu, Zhang and Su29] of any two-dimensional signal
 $s(n_{1},n_{2})$
is expressed in the following equation (3)
$s(n_{1},n_{2})$
is expressed in the following equation (3)
 \begin{equation}S\left(k_{1},k_{2}\right)=\sqrt{\frac{4}{N^{2}}}C(k_{1})C(k_{2})\sum\nolimits_{n_{1}=0}^{N-1}\sum\nolimits_{n_{2}=0}^{N-1}\left[s(n_{1},n_{2})\cos \left(\frac{\pi \left(2n_{1}+k_{1}\right)}{2N}\right)\cos \left(\frac{\pi \left(2n_{2}+k_{2}\right)}{2N}\right)\right]\end{equation}
In both the horizontal (
 $n_{1}$
) and vertical (
$n_{1}$
) and vertical (
 $n_{2}$
) axes, the letter
$n_{2}$
) axes, the letter
 $N$
indicates how dimensional the input signal array is. As a result, the frequency domain array
$N$
indicates how dimensional the input signal array is. As a result, the frequency domain array
 $S(k_{1},k_{2})$
has dimensions N x N and is represented in terms of the same indices,
$S(k_{1},k_{2})$
has dimensions N x N and is represented in terms of the same indices,
 $k_{1}$
and
$k_{1}$
and
 $k_{2}$
. where
$k_{2}$
. where
 $k_{1},k_{2}, n_{1},n_{2}=0,1,\ldots \ldots .,(N-1)$
and
$k_{1},k_{2}, n_{1},n_{2}=0,1,\ldots \ldots .,(N-1)$
and
 $C(k)$
is expressed in the following equation (4)
$C(k)$
is expressed in the following equation (4)
 \begin{equation}C\left(k\right)=\begin{cases} \frac{1}{\sqrt{2}}, \qquad \qquad for\, k=0\\ 1, \qquad \qquad \textit{otherwise} \end{cases}\end{equation}
The size of the spatial domain array
 $s(n_{1},n_{2})$
and the frequency domain array
$s(n_{1},n_{2})$
and the frequency domain array
 $S(k_{1},k_{2})$
are identical. It is stated in equations (5) and (6).
$S(k_{1},k_{2})$
are identical. It is stated in equations (5) and (6).
 \begin{equation}S=B_{c}s\end{equation}
 \begin{equation}s=B_{c}^{-1}S\end{equation}
The image data are processed via cosine transformations. These transforms can extract amplitude and frequency data from the image. The transform efficiently extracts statistical measurements and textural information by using cosine transforms. The Generalized Cosine Fractional Radon Transform enables the analysis of statistical measures that characterize the fine-scale texture information in the image through the use of fractional angles and cosine transforms. These measurements include features that are essential for locating and counting microaneurysms and hemorrhages, such as local contrast, texture patterns, and others.
Then, the Horizontal Weighted Visibility Graph [Reference Gao, Yu and Wang30] is a framework designed to analyze spatial relationships among pixel pairs in an image by considering their gray-level values and the extent to which they are visible to each other along a horizontal axis. The definition of the horizontal visibility algorithm is described as follows. Let
 $\{Y(i)\}_{i=1,\ldots ., N}$
be the time series with
$\{Y(i)\}_{i=1,\ldots ., N}$
be the time series with
 $N$
values that can be any real number, the time series with
$N$
values that can be any real number, the time series with
 $N$
values are able to be adapted to a horizontal visibility network with
$N$
values are able to be adapted to a horizontal visibility network with
 $N$
vertices by using the horizontal visibility algorithm, which sequentially assigns each value of the time series to each
$N$
vertices by using the horizontal visibility algorithm, which sequentially assigns each value of the time series to each
 $N$
vertex of the graph. The horizontal visibility graph is going to include an undirected connection between vertices
$N$
vertex of the graph. The horizontal visibility graph is going to include an undirected connection between vertices
 $v_{i}$
and
$v_{i}$
and
 $v_{j}$
if the following geometric standard is met in the time series. Which is expressed in the following equation (7)
$v_{j}$
if the following geometric standard is met in the time series. Which is expressed in the following equation (7)
 \begin{equation}y\left(i\right),y(j)\gt y\left(n\right),\forall n|i\lt n\lt j\end{equation}
where
 $y_{i}$
and
$y_{i}$
and
 $y_{j}$
are any two different values of the time series, and
$y_{j}$
are any two different values of the time series, and
 $y(n)$
are all the values between them. The weighted horizontal visibility graph is symbolized as
$y(n)$
are all the values between them. The weighted horizontal visibility graph is symbolized as
 $G=\{V,E,W\}$
, where
$G=\{V,E,W\}$
, where
 $V=\{v_{1},\ldots \ldots, v_{N}\}$
represents a finite set of vertices, W is the weighted graph adjacency matrix, and E is a set of edges connecting the edges of the graph. If vertex
$V=\{v_{1},\ldots \ldots, v_{N}\}$
represents a finite set of vertices, W is the weighted graph adjacency matrix, and E is a set of edges connecting the edges of the graph. If vertex
 $v_{i}$
and vertex
$v_{i}$
and vertex
 $v_{j}$
are joined by a single undirected edge, then
$v_{j}$
are joined by a single undirected edge, then
 $w_{ij} = w_{ji}$
representing the weight of the edge is nonzero, and otherwise,
$w_{ij} = w_{ji}$
representing the weight of the edge is nonzero, and otherwise,
 $w_{ij}= w_{ji}=0$
. This is the element of W at the
$w_{ij}= w_{ji}=0$
. This is the element of W at the
 $i^{th}$
row and
$i^{th}$
row and
 $j^{th}$
column.
$j^{th}$
column.
 $w_{ii}$
is set to 0 to eliminate the vertices’ self-loop. Equation (8) defines the nonzero
$w_{ii}$
is set to 0 to eliminate the vertices’ self-loop. Equation (8) defines the nonzero
 $w_{ij}$
in order to more accurately portray the difference between vertices.
$w_{ij}$
in order to more accurately portray the difference between vertices.
 \begin{equation}w_{ij}=\left\| x\left(i\right)-x(j)\right\| ^{2}\end{equation}
where
 $x(i)$
and
$x(i)$
and
 $x(j)$
refer to the signal values that are, respectively, indexed by vertex
$x(j)$
refer to the signal values that are, respectively, indexed by vertex
 $v_{i}$
and vertex
$v_{i}$
and vertex
 $v_{j}$
. The graph adjacency matrix
$v_{j}$
. The graph adjacency matrix
 $W$
and degree diagonal matrix
$W$
and degree diagonal matrix
 $D$
, whose
$D$
, whose
 $i^{th}$
diagonal element is
$i^{th}$
diagonal element is
 $d_{i}=\sum\nolimits_{j\neq i}w_{ij}$
, are used to generate the graph Laplacian matrix
$d_{i}=\sum\nolimits_{j\neq i}w_{ij}$
, are used to generate the graph Laplacian matrix
 $L$
and their definition is provided as in the following equation (9)
$L$
and their definition is provided as in the following equation (9)
 \begin{equation}\mathcal{L}=\mathcal{D}-\mathcal{W}\end{equation}
The graph Laplacian matrix, which incorporates both the connection and degree information of vertices, is able to better represent the topological characteristics of a graph structure than the graph adjacency matrix and degree diagonal matrix. Realizing that the graph Laplacian matrix is a real symmetric matrix, it has a full set of orthonormal eigenvectors
 $\{{u_{1}}\}_{l=0,1,\ldots, N-1}$
and eigenvalues as well as a set of real and non-negative eigenvalues
$\{{u_{1}}\}_{l=0,1,\ldots, N-1}$
and eigenvalues as well as a set of real and non-negative eigenvalues
 $\{\lambda _{1}\}_{l=0,1,\ldots, N-1}$
. The systematic matrix is expressed in the equation (10)
$\{\lambda _{1}\}_{l=0,1,\ldots, N-1}$
. The systematic matrix is expressed in the equation (10)
 \begin{equation}\mathcal{L}u_{1}=\lambda _{1}u_{1}\end{equation}
This Horizontal Weighted Visibility Graph is utilized to analyze the visible spatial relation among the pixel pairs in the image on the basis of their gray-level values of the image. The combination of Fractional Radon Transform and Visibility Graph is used to extract various novel features from retinal images. It extracts the features of statistical measures like homogeneity, contrast, entropy, energy, and retinal layer thickness. This statistic defines the local gray-level homogeneity. When every component of an image is the same, it has the highest value, suggesting that the image is extremely homogeneous. Homogeneity is calculated by using the following equation (11) [Reference Madhumalini and Devi31]
 \begin{equation}\textit{Homogeneity}=\sum\nolimits_{i,j=0}^{N-1}\frac{G_{i,j}}{1+(i-j)^{2}}\end{equation}
The difference between a pixel’s highest and lowest values that is referred to as the contrast of an image. This attribute shows how much local variation there is in the image. The formula for calculating the contrast of the image is expressed in the following equation (12)
 \begin{equation}\textit{contrast}=\sum\nolimits_{i,j=0}^{N-1}G_{i,j}(i-j)^{2}\end{equation}
where N number of gray levels make up the segmented gray level-image,
 $G_{i,j}$
is the element of the matrix
$G_{i,j}$
is the element of the matrix
 $(i,j)$
. Entropy is a metric for the degree of unpredictability in an image’s distribution of intensity levels. The texture of an image is able to be understood using this statistic. Entropy is found by using the following equation (13)
$(i,j)$
. Entropy is a metric for the degree of unpredictability in an image’s distribution of intensity levels. The texture of an image is able to be understood using this statistic. Entropy is found by using the following equation (13)
 \begin{equation}\textit{Entropy}=\sum\nolimits_{i,j=0}^{N-1}G_{i,j}\ln G_{i,j}\end{equation}
Statistics are used to quantify texture uniformity using energy. High energy is provided by an image with consistent gray levels or a regular pattern. Equation (14) explains energy.
 \begin{equation}\textit{energy}=\sum\nolimits_{i,j=0}^{N-1}{G_{i,j}}^{2}\end{equation}
Thus, this proposed novel technique extracts novel features like the Retinal layer thickness, which is required for further processing in the prediction of DR, as well as the number of Microaneurysms in the retina, the number of Dot and Blot Hemorrhages in the retina, and their distribution in the retina. Moreover, segmentation and classification process are necessary which is done using Morphological Black Hat Transform with Optimized ResNet Algorithm, which is explained in the next section.
2.2. Morphological Black Hat Transform with Optimized ResNet Algorithm
This segmentation and classification are carried out using a groundbreaking algorithm called Morphological Black Hat Transform with Optimized ResNet Algorithm, in which the segmentation is carried out by employing an Enriched Black Hat Transform-based Morphological operation and the classification is carried out using ResNet-driven S-GOA.
The above Fig. 2 shows the Morphological Black Hat Transform with Optimized ResNet Algorithm. Gaussian filter is used to suppress the induced noise. The structure and shape of objects in an image are processed and altered using morphological operations. An operation known as “Enriched Black Hat Transform” is used in this instance to highlight dark structures or features against a lighter background. ResNet is particularly good at identifying features at various levels of abstraction. When working with intricate images like fundus images, where DR-related features could be present at multiple scales and complexities, this is critical. To cooperate and exchange knowledge about their positions and the caliber of their answers, S-GOA uses social interactions between its agents. This social interaction aids in the optimization process’ efficient exploration and exploitation of the solution space.
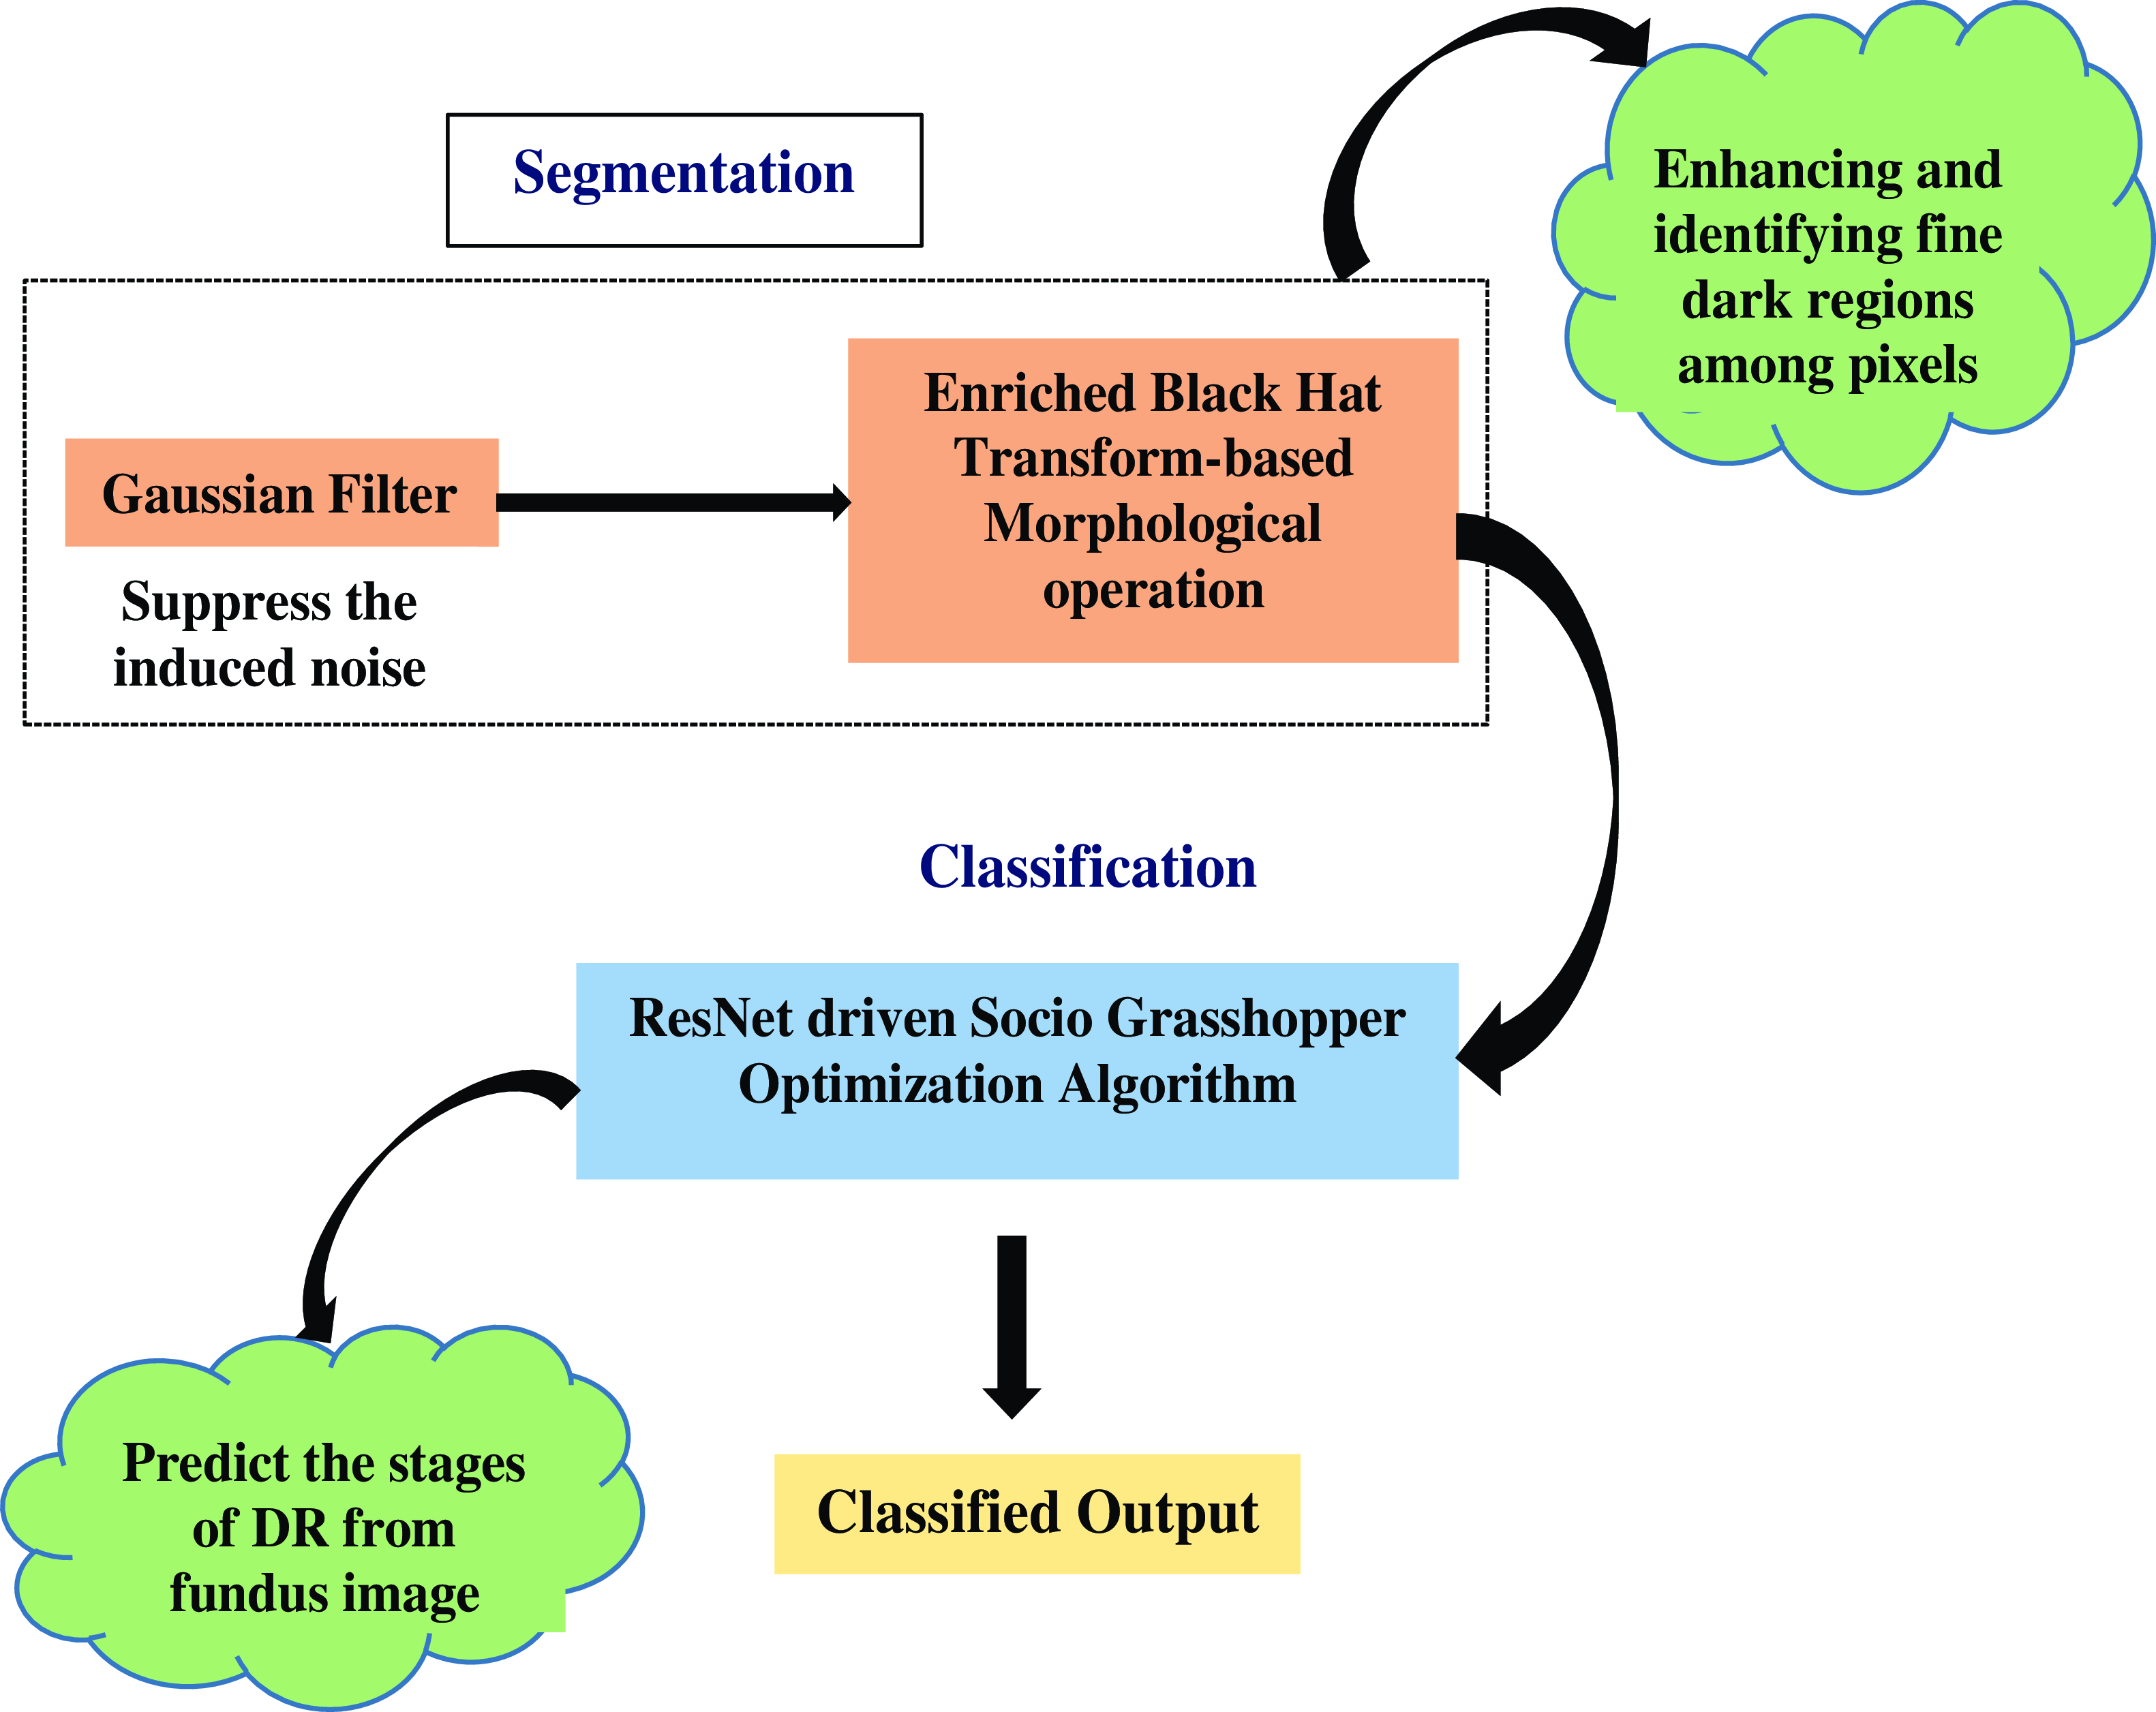
Figure 2. Flow graph of morphological black hat transform with optimized ResNet algorithm.
In the first step of this method, the image is smoothed after the extracted features are initially filtered with a Gaussian filter to reduce the induced noise. A Gaussian filtering process for an image with value
 $I(p)$
at pixel
$I(p)$
at pixel
 $p$
is defined as in the following equation (15)
$p$
is defined as in the following equation (15)
 \begin{equation}G_{{\sigma _{x}},{\sigma _{y}}}I\left(p\right)=\mathrm{I}(\mathrm{p})+\eta \frac{1}{N_{p}}\sum\nolimits_{q\in p}g_{{\sigma _{x}}}\left(\left\| q-p\right\| \right)g_{{\sigma _{y}}}\left(I\left(q\right)-I\left(p\right)\right)\cdot (I\left(q\right)-I\left(p\right))\end{equation}
where
 \begin{equation}g_{\sigma }\left(t\right)=\exp \left(-\frac{t^{2}}{2\sigma ^{2}}\right)\end{equation}
 \begin{equation}N_{p}=\sum\nolimits_{q\in p}g_{{\sigma _{x}}}\left(\left\| q-p\right\| \right)g_{{\sigma _{y}}}\left(I\left(q\right)-I\left(p\right)\right)\end{equation}
where
 $\sigma _{x}$
and
$\sigma _{x}$
and
 $\sigma _{y}$
are smoothing parameters measuring the width of
$\sigma _{y}$
are smoothing parameters measuring the width of
 $g_{{\sigma _{x}}}$
and
$g_{{\sigma _{x}}}$
and
 $g_{{\sigma _{y}}},$
respectively. The neighborhood of pixel
$g_{{\sigma _{y}}},$
respectively. The neighborhood of pixel
 $p$
is covered by the notation
$p$
is covered by the notation
 $P$
, and
$P$
, and
 $\eta$
the choice ensures the approximation’s numerical stability. A weighted average of the entire image is used in the process of Gaussian filtering. Each pixel’s value is determined by taking the weighted average of that pixel’s value and the values of the neighboring pixels. The specific process of a Gaussian filter is to use a convolution or mask to scan every pixel in the image and replace the value of the central pixel with the weighted average gray value of the pixels in the design’s neighborhood. In terms of the average standard deviation of the population
$\eta$
the choice ensures the approximation’s numerical stability. A weighted average of the entire image is used in the process of Gaussian filtering. Each pixel’s value is determined by taking the weighted average of that pixel’s value and the values of the neighboring pixels. The specific process of a Gaussian filter is to use a convolution or mask to scan every pixel in the image and replace the value of the central pixel with the weighted average gray value of the pixels in the design’s neighborhood. In terms of the average standard deviation of the population
 $\sigma _{p,q}$
and the smoothing value
$\sigma _{p,q}$
and the smoothing value
 $\sigma _{y}$
above, each pair of adjacent pixels
$\sigma _{y}$
above, each pair of adjacent pixels
 $p\, and\, q$
is expressed as follows in equation (18)
$p\, and\, q$
is expressed as follows in equation (18)
 \begin{equation}\sigma _{{y_{p,q}}}=\omega \cdot \sigma _{p,q}=\omega \cdot \sqrt{\sigma _{p}^{2}+\sigma _{q}^{2}}\end{equation}
where the normalization weight of the filtering is
 $\omega$
, and
$\omega$
, and
 $\sigma _{p}\, and\, \sigma _{q}$
are the standard deviation of the pixel
$\sigma _{p}\, and\, \sigma _{q}$
are the standard deviation of the pixel
 $p\, and\, q$
. This Gaussian filter has the effect of smoothing out irregularities and reducing the noise.
$p\, and\, q$
. This Gaussian filter has the effect of smoothing out irregularities and reducing the noise.
After that segmentation takes place using the Enriched Black Hat Transform-based Morphological operation [Reference Deng, Zhang, Xu and Zhu32]. This proposed morphological operation is used to process the image based on the internal structure and shape of the objects. The input to morphological operators, which are nonlinear, consists of two sets of data. The input image is set as
 $c(m, n)$
, and the structural element is set as
$c(m, n)$
, and the structural element is set as
 $d(m, n)$
. The gray value of the pixel with the coordinates
$d(m, n)$
. The gray value of the pixel with the coordinates
 $(m, n)$
determines the functions
$(m, n)$
determines the functions
 $c$
and
$c$
and
 $d$
. The following gives the mathematical formulation of set
$d$
. The following gives the mathematical formulation of set
 $C$
to the gray expansion of set
$C$
to the gray expansion of set
 $D$
in equation (19).
$D$
in equation (19).
 \begin{equation}C\oplus D=\max \left\{c\left(s-m,t-n\right)+d\left(m,n\right)|c\left(s-m,t-n\right)\in C;\,d\left(m,n\right)\in D\right\}\end{equation}
where
 $b$
stands for the morphological processing’s structural component, often considered a sub-image function. The domain of function an includes the displacement parameters represented by
$b$
stands for the morphological processing’s structural component, often considered a sub-image function. The domain of function an includes the displacement parameters represented by
 $(s-m)$
and
$(s-m)$
and
 $(t-n)$
. Equation (20) provides the formula relating set
$(t-n)$
. Equation (20) provides the formula relating set
 $D$
to the gray erosion of set
$D$
to the gray erosion of set
 $C$
.
$C$
.
 \begin{equation}C \Theta \mathrm{D}=\min \{\mathrm{c}\left(\mathrm{s}=\mathrm{m},\mathrm{t}+\mathrm{n}\right)-\mathrm{d}(\mathrm{m},\mathrm{n})|\mathrm{c}\left(\mathrm{s}=\mathrm{m},\mathrm{t}+\mathrm{n}\right)\in C;\,d(m,n)\in D\}\end{equation}
where
 $(s+m)$
and
$(s+m)$
and
 $(t+n)$
stand for translation parameters, which are a part of the function
$(t+n)$
stand for translation parameters, which are a part of the function
 $c$
’s domain. The target area is often narrowed by a circle by using the erosion of the binary image to remove some pixels from the target’s edge. The binary image’s target edge is going to have some pixels added as part of the expansion, creating a circle within the target area. The structural elements’ size and shape dictate the target region’s size that needs to be thinned or extended. The principles of erosion and expansion for binary pictures also apply to grayscale images. The structural element’s center point is moved as part of the grayscale image expansion, and each time it happens, the structural element’s gray value is added to the initial gray pixel. The pixel’s gray value is then determined by taking the area’s maximum value.
$c$
’s domain. The target area is often narrowed by a circle by using the erosion of the binary image to remove some pixels from the target’s edge. The binary image’s target edge is going to have some pixels added as part of the expansion, creating a circle within the target area. The structural elements’ size and shape dictate the target region’s size that needs to be thinned or extended. The principles of erosion and expansion for binary pictures also apply to grayscale images. The structural element’s center point is moved as part of the grayscale image expansion, and each time it happens, the structural element’s gray value is added to the initial gray pixel. The pixel’s gray value is then determined by taking the area’s maximum value.
The most complex morphological processing methods are morphological opening operation and morphological shutting operation. The target edge is smoothed by the morphological opening operation, which removes the target’s small protruding components and disconnects its narrow connecting sections. The morphological closing operation achieves the goal of smoothing the target edge by filling the small gaps inside the target and linking the target’s narrow connecting component. The expressions for the morphological opening operation and closing operation are shown in Equations (21) and (22), respectively, using the
 $C$
to
$C$
to
 $D$
transformed set
$D$
transformed set
 $C$
and the structural element
$C$
and the structural element
 $D$
as examples.
$D$
as examples.
 \begin{equation}C\circ D=C\Theta D\oplus D\end{equation}
 \begin{equation}C\cdot \mathrm{D}=C\oplus D\Theta D\end{equation}
The closure operator plugs cracks while the opening operator eliminates weak connections between items and minute details. Finally, the proposed Enriched Black Hat Transformation is applied to enhance the dark fine structures or features inside of a brighter background. The EBHT technique that is being proposed allows for the image’s troughs to be highlighted. In this, the extracted structures’ sizes are less substantial than the structuring elements and are also used to extract the darker or blacker parts of the image. The portions of the eye samples image that are black between adjacent scales
 $i\, and\, i+1$
, which is expressed in the equation (23)
$i\, and\, i+1$
, which is expressed in the equation (23)
 \begin{equation}BHT_{i(i+1)}=BHT_{i+1}-BHT_{i}\end{equation}
As a result, the extracted black feature image regions are combined with the extracted black image regions in order to effectively enhance images. The following improvements are possibly made to image
 $f$
using the final black image regions that are retrieved using the enriched black hat transform shown in equation (24)
$f$
using the final black image regions that are retrieved using the enriched black hat transform shown in equation (24)
 \begin{equation}f_{EBHT}=f\left(x\right)=\left\{f+(max_{0\leq i\leq n}\left\{BHT_{i}\right\}+max_{0\leq i\leq n}\{BHT_{i\left(i+1\right)}\}\right.)-min_{0\leq i\leq n}\{BHT_{i\left(i+1\right)}\}\end{equation}
This proposed Enriched Black Hat Transform boosts the dark fine structures or characteristics inside a brighter background. After segmentation, the image moves on to classification, where a valuable proposed method called ResNet-driven Socio Grasshopper Optimization Algorithm (S-GOA) [Reference Kamel and Yaghoubzadeh33] is used for classification.
In the proposed model, ResNet [Reference Athira and Nair34] is used to extract high-level and fine-grained features from the segmented fundus image. These features may include complex patterns, textures, and structures that are essential for identifying and classifying DR-related characteristics. The proposed ResNets model has an advantage over other architectural models in that performance does not suffer as the design becomes more complex. Additionally, it is now possible to train networks more effectively, and computing calculations are made lighter. By excluding connections on two to three levels that contain ReLU and batch normalization between the architectures, the ResNet model is implemented. This proposed ResNet incorporates with Social Interaction of the Grasshopper Optimization Algorithm.
Social interactions are included in the Grasshopper Optimization Algorithm by employing the unique optimization approach known as S-GOA. In order to discover the best clarifications, the GOA optimization algorithm imitates the swarming behavior of grasshoppers. Based on the ResNet characteristics that have been retrieved, GOA is employed in the present scenario to optimize and predict the phases of DR. The following mathematical formula simulates the grasshopper’s behavior in groups, which is expressed in the following equation (25)
 \begin{equation}GR_{i}=So_{i}+G_{i}+A_{i}\end{equation}
where
 $GR_{i}$
denotes the location of the
$GR_{i}$
denotes the location of the
 $i$
grasshopper,
$i$
grasshopper,
 $So_{i}$
is the social interaction
$So_{i}$
is the social interaction
 $G_{i}$
the grasshopper experiences gravitational pull, and
$G_{i}$
the grasshopper experiences gravitational pull, and
 $A_{i}$
is the wind’s horizontal motion. To create a random behavior, the equation (26) is written as follows
$A_{i}$
is the wind’s horizontal motion. To create a random behavior, the equation (26) is written as follows
 \begin{equation}GR_{i}={r_{1}}So_{i}+r_{2}G_{i}+r_{3}A_{i}\end{equation}
where
 $r_{1}$
,
$r_{1}$
,
 $r_{2},\, and\, r_{3}$
are random numbers in the range [0,1]. The social forces
$r_{2},\, and\, r_{3}$
are random numbers in the range [0,1]. The social forces
 $So$
is defined in the following equation (27)
$So$
is defined in the following equation (27)
 \begin{equation}So_{i}=\sum\nolimits_{j}^{N}=So\left(d_{i,j}\right)\hat{d}_{i,j}, j\neq i\end{equation}
The distance between grasshoppers
 $i$
and
$i$
and
 $j$
, denoted by the symbol
$j$
, denoted by the symbol
 $d_{i,j}$
, is determined as
$d_{i,j}$
, is determined as
 $d_{i,j}=|GR_{j}-GR_{i}|$
, power of the social force is defined as in the function
$d_{i,j}=|GR_{j}-GR_{i}|$
, power of the social force is defined as in the function
 $So$
. And
$So$
. And
 $d_{i,j}=\frac{{GR_{j}}-GR_{i}}{d_{i,j}}$
is a single vector of grasshopper
$d_{i,j}=\frac{{GR_{j}}-GR_{i}}{d_{i,j}}$
is a single vector of grasshopper
 $i$
and grasshopper
$i$
and grasshopper
 $j$
. The following equation (28) is used to calculate the function
$j$
. The following equation (28) is used to calculate the function
 $So$
, which defines ResNet incorporated with S-GOA :
$So$
, which defines ResNet incorporated with S-GOA :
 \begin{equation}So\left(r\right)=F(e^{-r},fe^{\frac{-r}{l}}+e^{-r})\end{equation}
where
 $l$
stands for the adsorption length scale and
$l$
stands for the adsorption length scale and
 $f$
for the adsorption intensity. As the mathematical model of the Socio Grasshopper Optimization Algorithm is further improved, which is expressed in the following equation (29)
$f$
for the adsorption intensity. As the mathematical model of the Socio Grasshopper Optimization Algorithm is further improved, which is expressed in the following equation (29)
 \begin{equation}{GR_{i}}^{d}=\beta (\sum\nolimits_{j=1,j\neq i}^{N}\beta \times \frac{ub_{d}-lb_{d}}{2}\times s\left(\left| {GR_{j}}^{d}-{GR_{i}}^{d}\right| \right)\times \frac{{GR_{j}}-GR_{i}}{d_{i,j}}+\overline{T}_{d}\end{equation}
where
 $ub_{d}$
and
$ub_{d}$
and
 $lb_{d}$
is the upper and lower bound in the
$lb_{d}$
is the upper and lower bound in the
 $d^{th}$
dimension aims the complexity of the process.
$d^{th}$
dimension aims the complexity of the process.
 $\beta$
is the reduction factor used to reduce both the neutral and gravity-repulsion zones.
$\beta$
is the reduction factor used to reduce both the neutral and gravity-repulsion zones.
 $\overline{T}_{d}$
is at present the best prediction. As the iterations are improved,
$\overline{T}_{d}$
is at present the best prediction. As the iterations are improved,
 $\beta _{1}$
is used to limit the area of search, and
$\beta _{1}$
is used to limit the area of search, and
 $\beta _{2}$
is used to mitigate the effect of attraction and repulsion on all agents. The following equation (30) is the maximization function for the variable
$\beta _{2}$
is used to mitigate the effect of attraction and repulsion on all agents. The following equation (30) is the maximization function for the variable
 $\beta _{i}(i=1,2)$
.
$\beta _{i}(i=1,2)$
.
 \begin{equation}\beta _{i}=\beta _{max}-\frac{l\left(\beta _{max}-\beta _{min}\right)}{L}\end{equation}
Where
 $\beta _{max}$
and
$\beta _{max}$
and
 $\beta _{min }$
are the maximum and minimum value of
$\beta _{min }$
are the maximum and minimum value of
 $\beta _{1}\,and\, \beta _{2}$
. The parameters are assigned according to distinct measures,
$\beta _{1}\,and\, \beta _{2}$
. The parameters are assigned according to distinct measures,
 $L$
is a recent iteration and exhibits a high iteration
$L$
is a recent iteration and exhibits a high iteration
 $i$
. With improved data flow and gradients for efficient learning and optimization, this proposed ResNet-driven S-GOA effectively addresses the issues in two modules of work and achieves higher performance.
$i$
. With improved data flow and gradients for efficient learning and optimization, this proposed ResNet-driven S-GOA effectively addresses the issues in two modules of work and achieves higher performance.
The overall problem that will be resolved is feature extraction, where the valuable novel features are extracted and undergo segmentation, where even the small fine regions in DR are segmented precisely and classified by applying an innovative concept, thus performing a precise detection of DR from fundus images at an early stage.
3. Result and discussion
This section includes a thorough analysis of the performance of the proposed earlier smart prediction of DR from fundus image, and a comparison section to make sure the proposed model is efficient in medical application.
3.1. Data set description
In this proposed DR early prediction DR 224x224 (2019 Data) set is used from which 4000 images are taken for testing and training. Images are retina scan images used to identify DR. APTOS 2019 Blindness Detection has the original dataset. The images have been scaled to 224x224 pixels in order to be utilized with several pre-trained deep learning models. Using the train, all of the images are already stored in their relevant folders based on the severity/stage of DR. There are five folders containing the images such as No DR, Mild, Moderate, Severe, and Proliferate DR [35].
3.2. Experimental setup
The simulation results are discussed below. This work has been implemented in the MATLAB working platform using the following system specifications.
Software : MATLAB
OS : Windows 10 (64-bit)
Processor : Intel i5
RAM : 8 GB RAM
3.3. performance analysis of the proposed model
The performance of the proposed model for the detection of DR has been evaluated in this subsection to show its effectiveness in medical image processing.
The above Fig. 3 shows the DR lession images. These images are taken from 400 patients suffering from diabetes in the ratio 9:1 for testing and training from which 20 images are provided for the results. The existence and nature of these lesions on retinal images are crucial in the diagnosis and staging of DR. These lesions are likely to involve microaneurysms, hemorrhages (bleeding inside the retina), exudates (small blood vessel outpouchings), and other structural alterations. A few little, spherical red dots are sometimes seen on the retinal scans. These tiny formations are made up of retinal blood vessels, which are probably the early signs of DR. Blot hemorrhages, which are bigger, irregularly shaped bleeding patches, or dot hemorrhages, which are smaller, spherical bleeding regions.
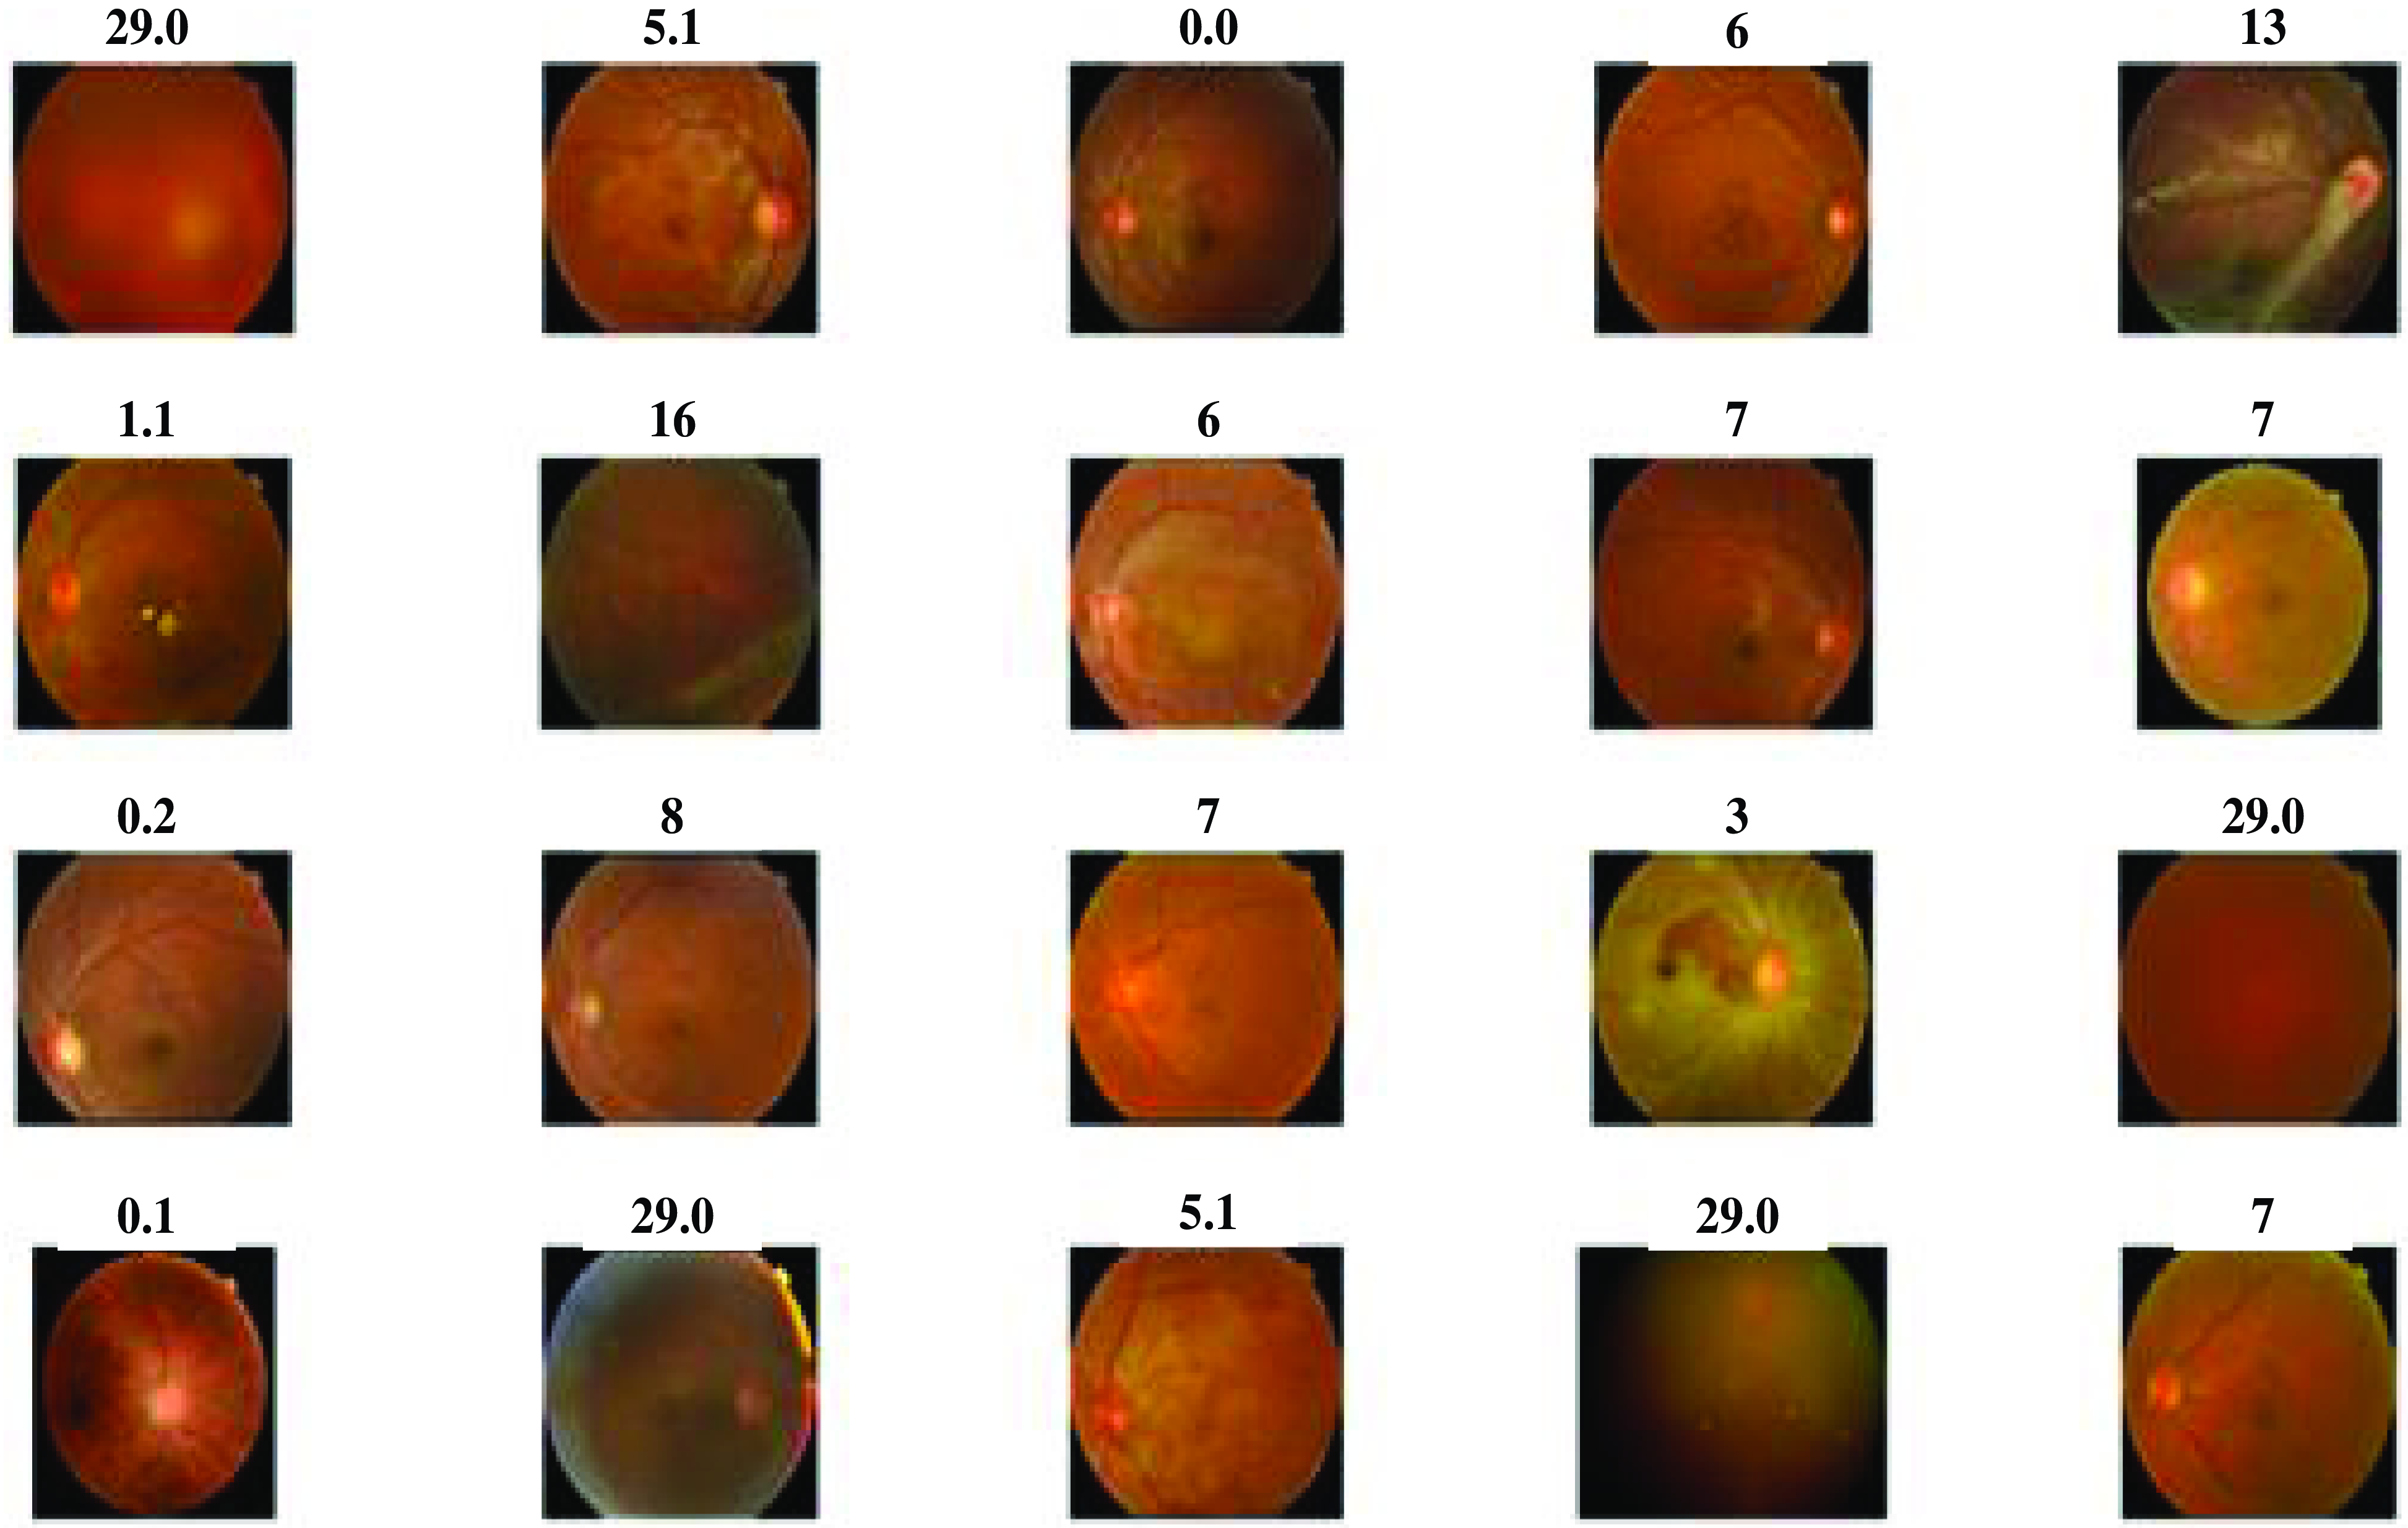
Figure 3. Diabetic retinopathy lession images.
The above Fig. 4 shows the detection rate of the proposed model. It is a visual representation of the model’s ability to identify DR in retinal images Fig. 5. It displays the false positive rate at different thresholds against the detection rate, sometimes referred to as sensitivity. The suggested DR model’s detection rate graph offers a useful evaluation of how well the model detects DR in retinal pictures. A higher detection rate for DR while maintaining a low false positive rate would indicate that the system is successfully detecting cases of the disease while reducing the number of false alarms or wrong diagnoses in situations of non-disease. The proposed earlier prediction of DR attains a high detection rate value as 1.
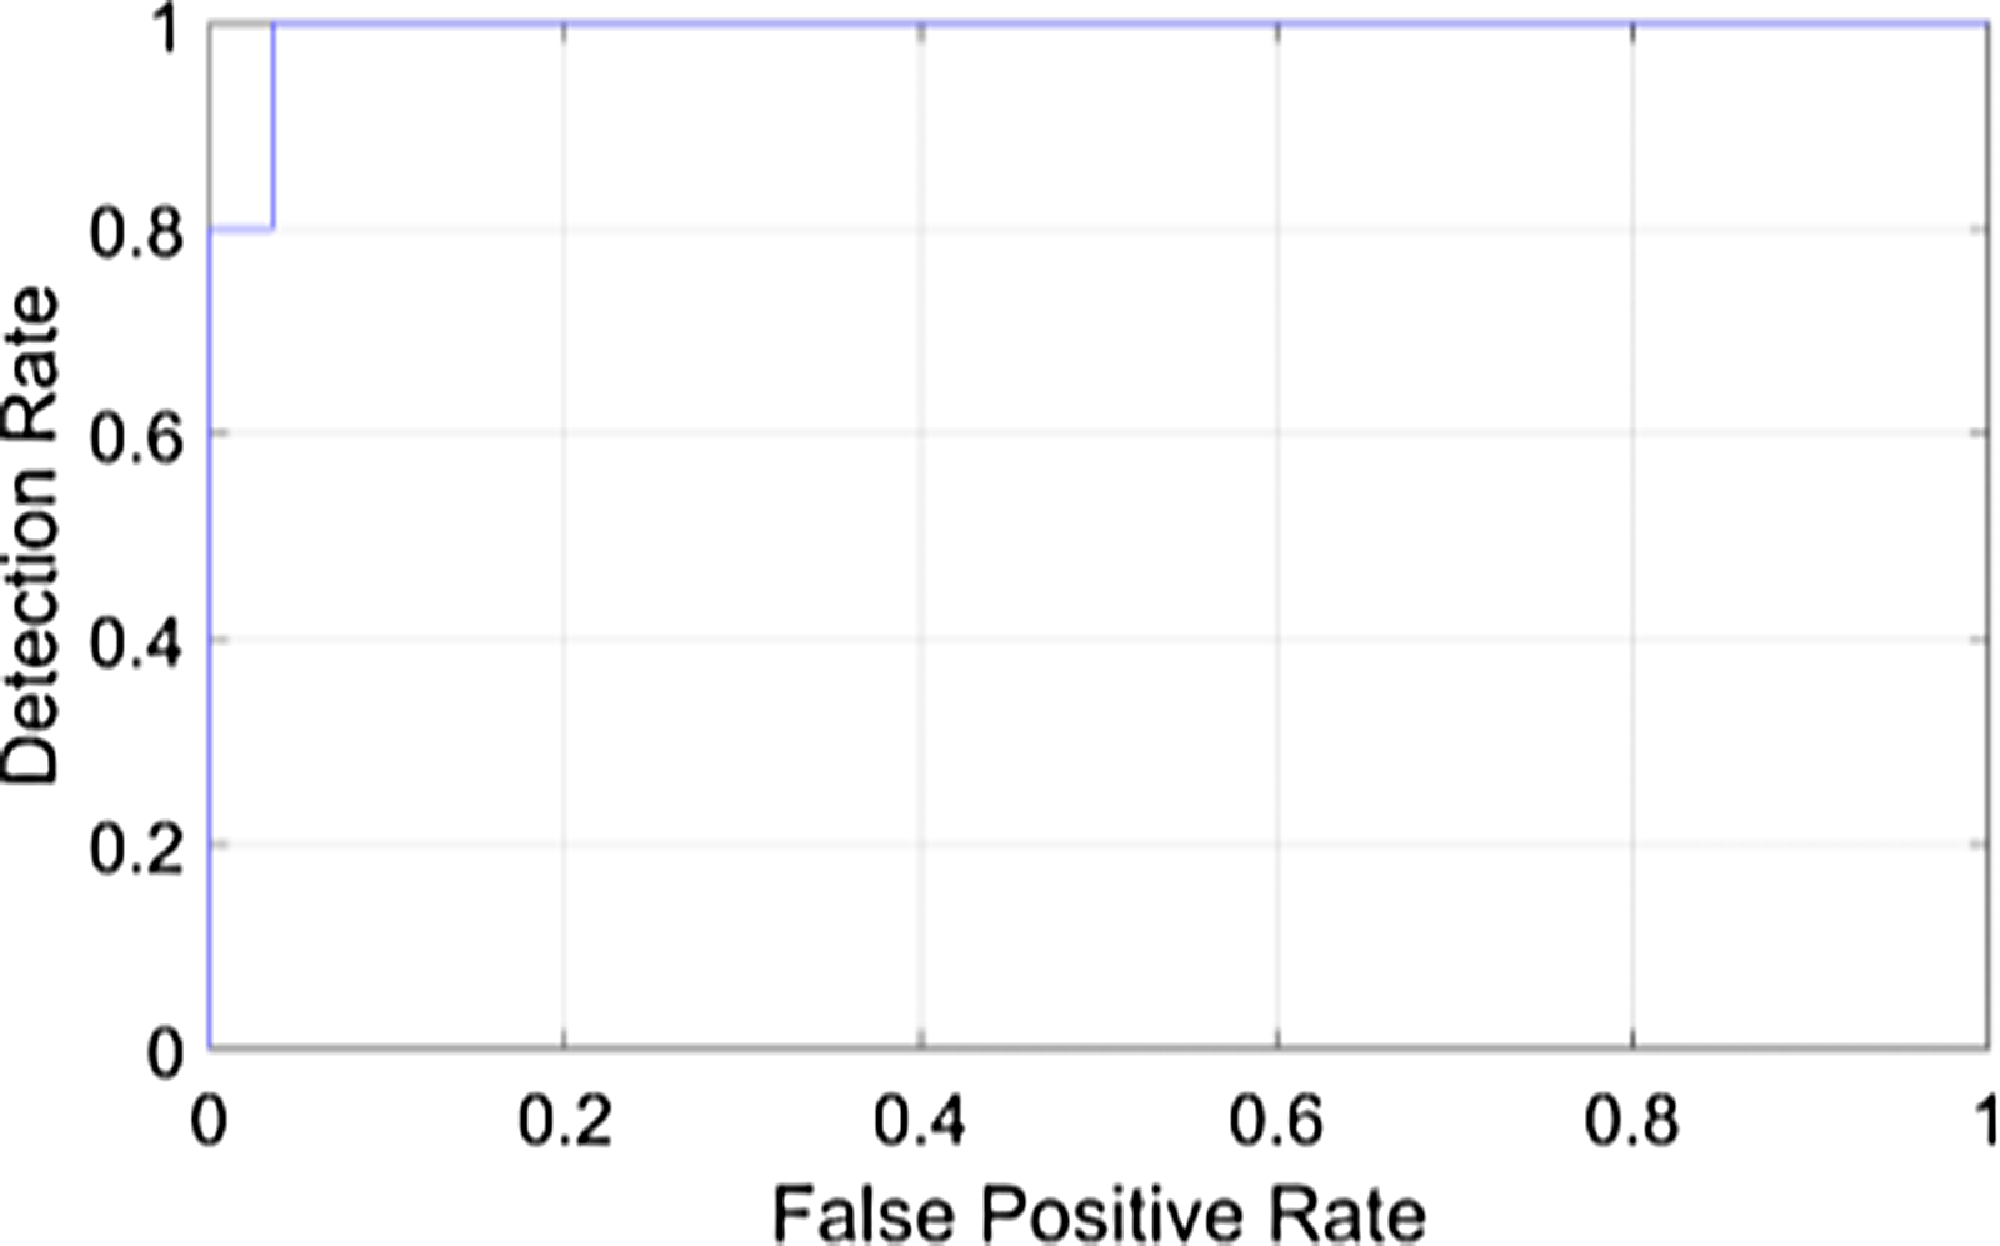
Figure 4. Detection rate of the proposed model.
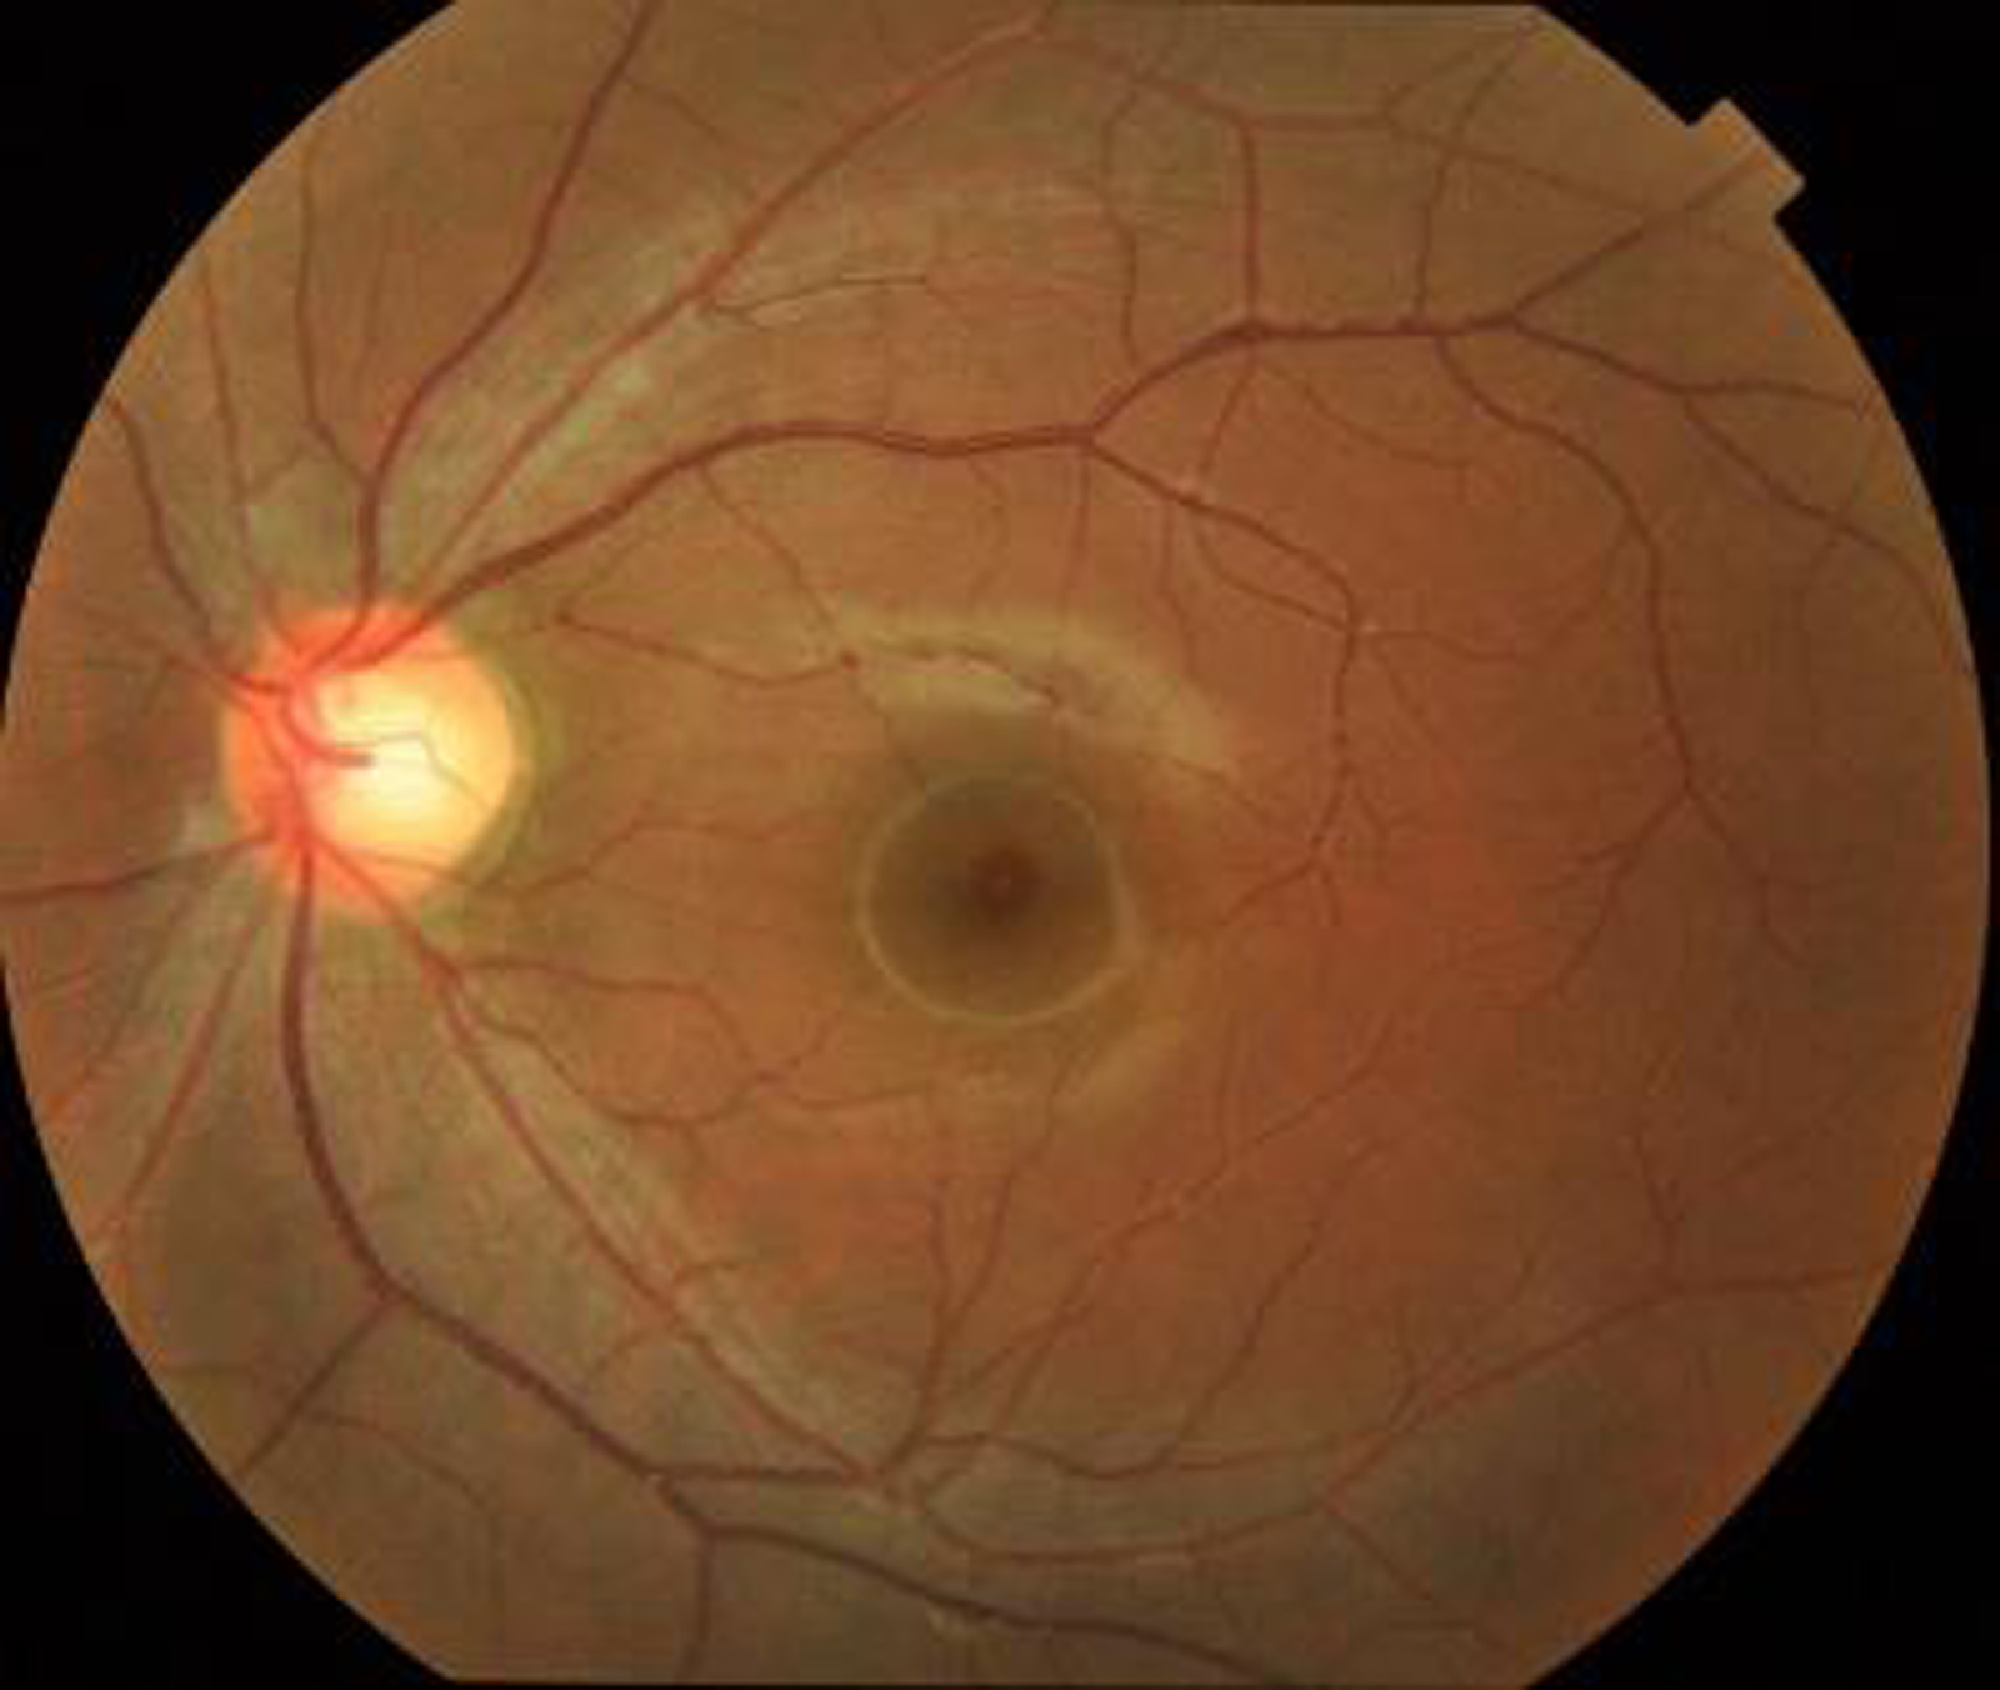
Figure 5. Input fundus image.
The above figure shows the input fundus image of the proposed model. A fundus image is a diagnostic photograph of the eyes inside part, especially its innermost layer. It is also referred to a fundus photograph or retinal image. The retina, optic disc, blood vessels, and macula are all parts of the fundus, which is the eye’s inner lining. Fundus pictures are frequently employed in ophthalmology and optometry for a variety of screening and diagnostic reasons, including the early diagnosis and prediction of DR.
The above Fig. 6 shows the grayscale image of the proposed model. The color fundus image is first converted into a grayscale format during preprocessing. Grayscale images, also known as black and white images, contain only shades of gray and no color information. This conversion simplifies the image to make it easier to process while preserving crucial details like the image’s brightness and contrast of the image. Darker grayscale values denote less brightness, whereas lighter grayscale values denote more brightness, and these grayscale values are used to generate the visual representation of the image.
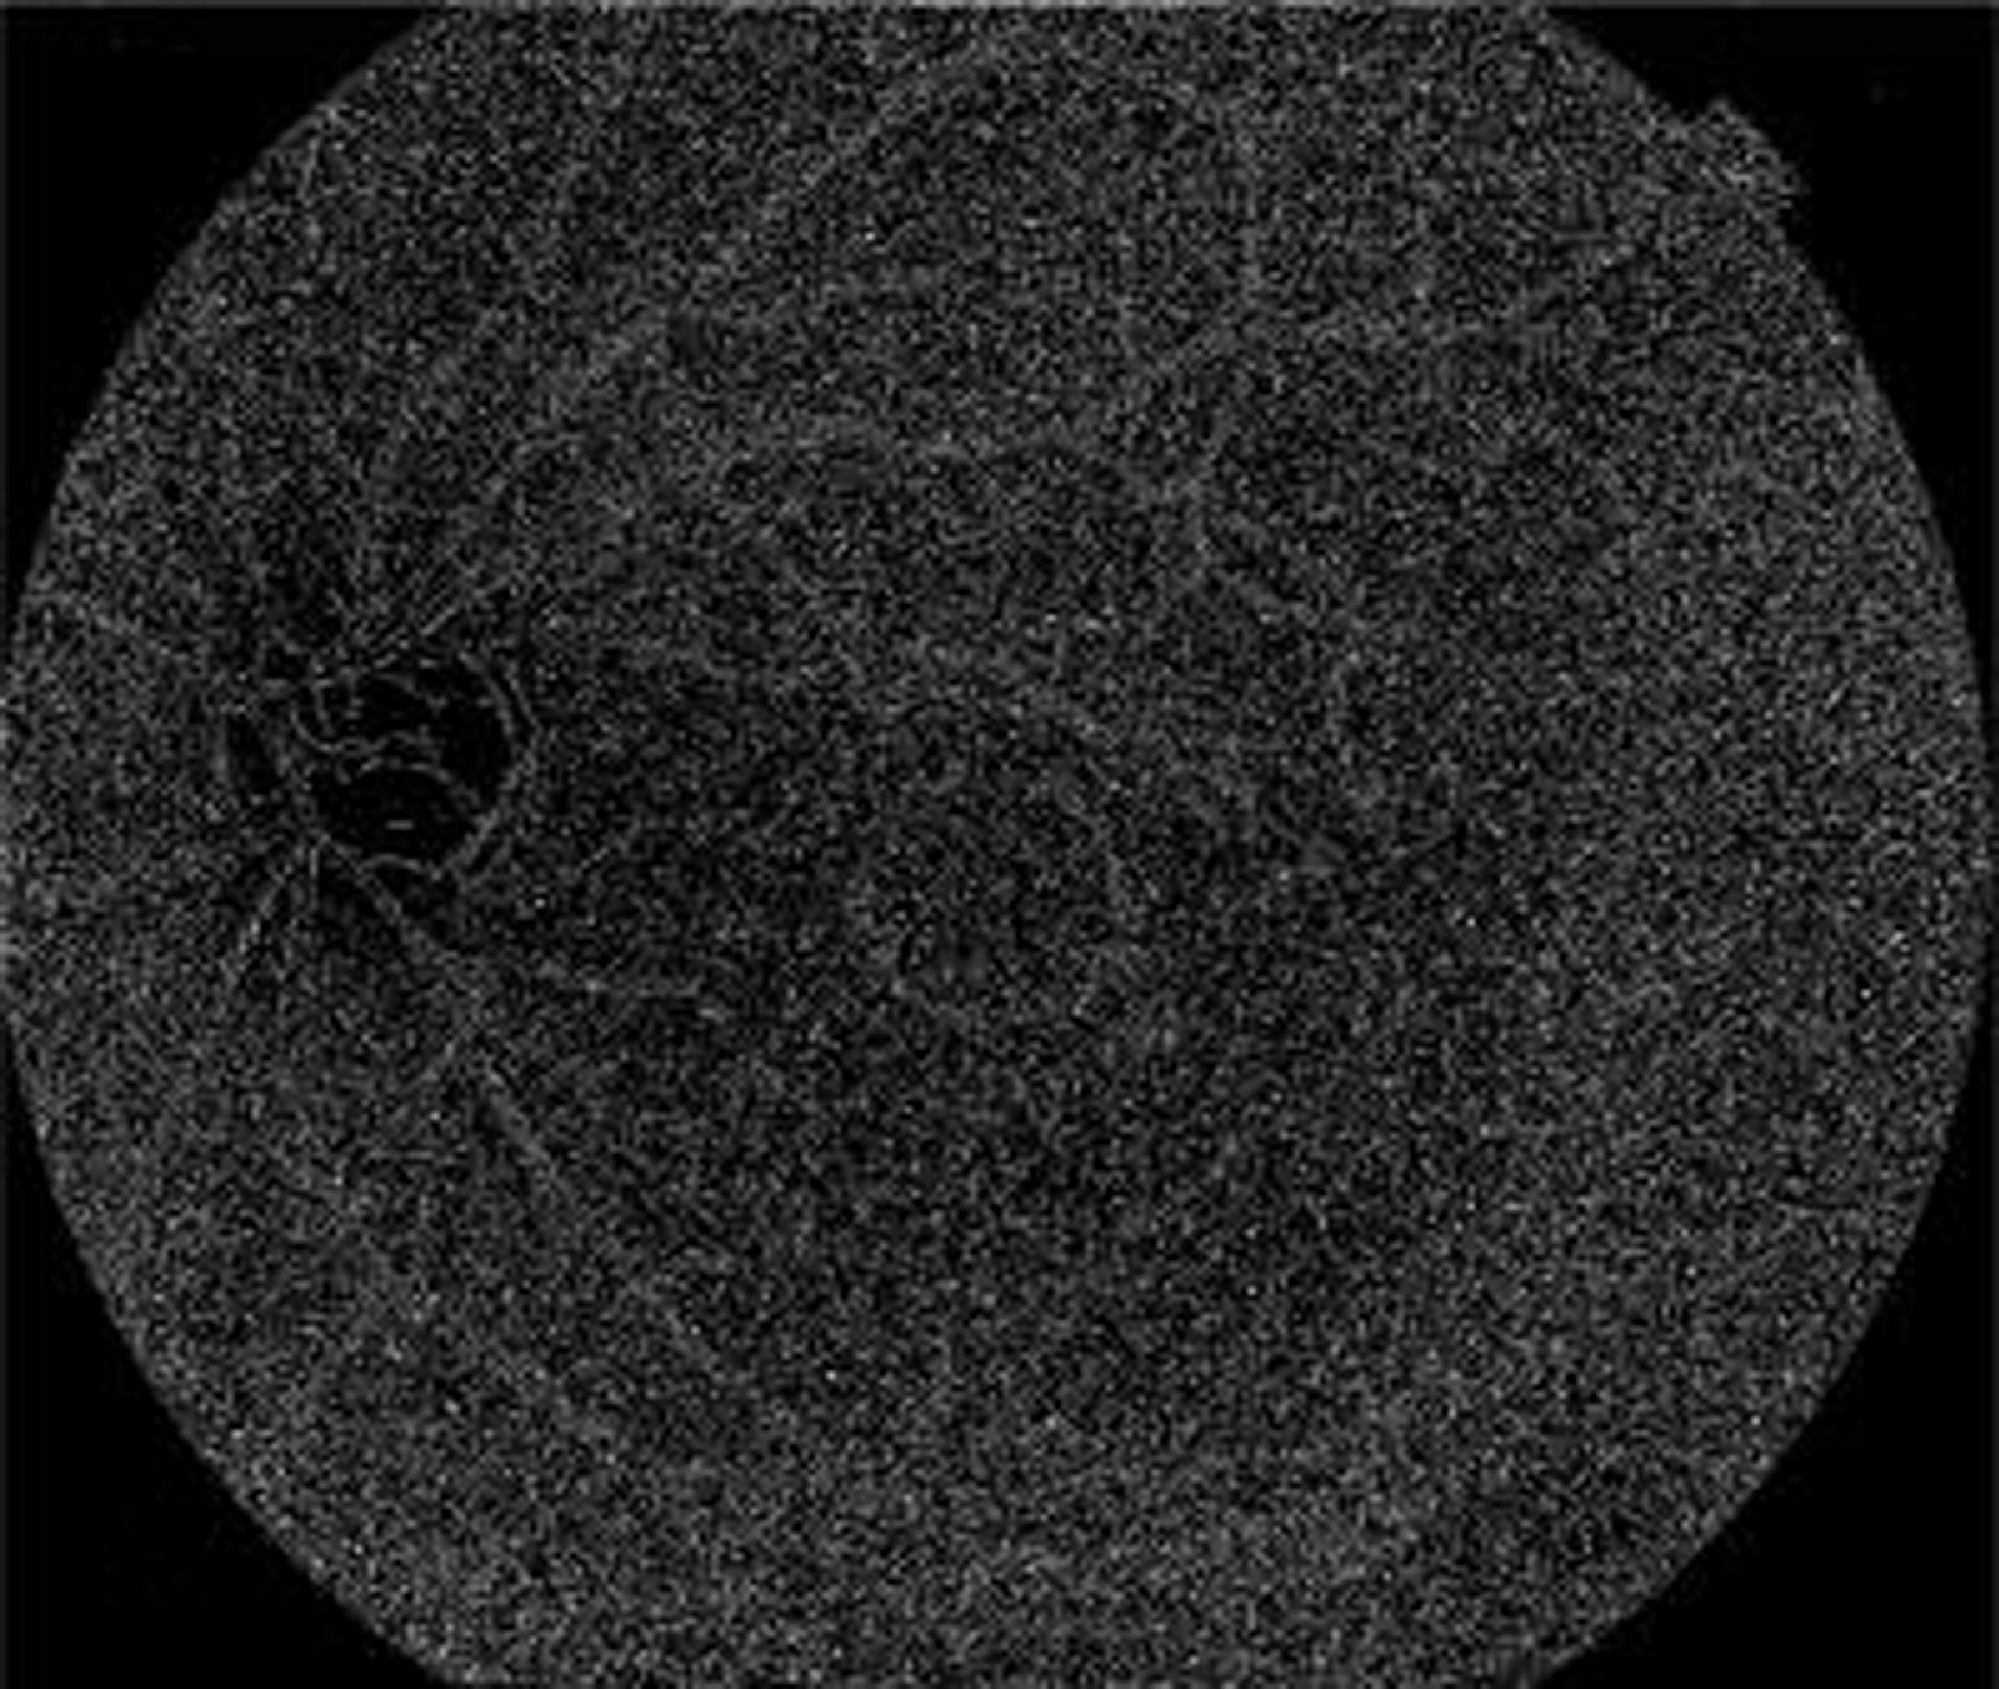
Figure 6. Grayscale image of the proposed model.
The above Fig. 7 shows the binary image of the proposed model. In the segmentation stage of the proposed model, binary images are often used. In order to create binary masks for DR detection, an intensity threshold needs to be set. At that point, pixels with intensity values above the threshold are given the color “white” to denote the presence of a feature, while pixels with intensity values below the threshold are given the color “black” to denote its absence.
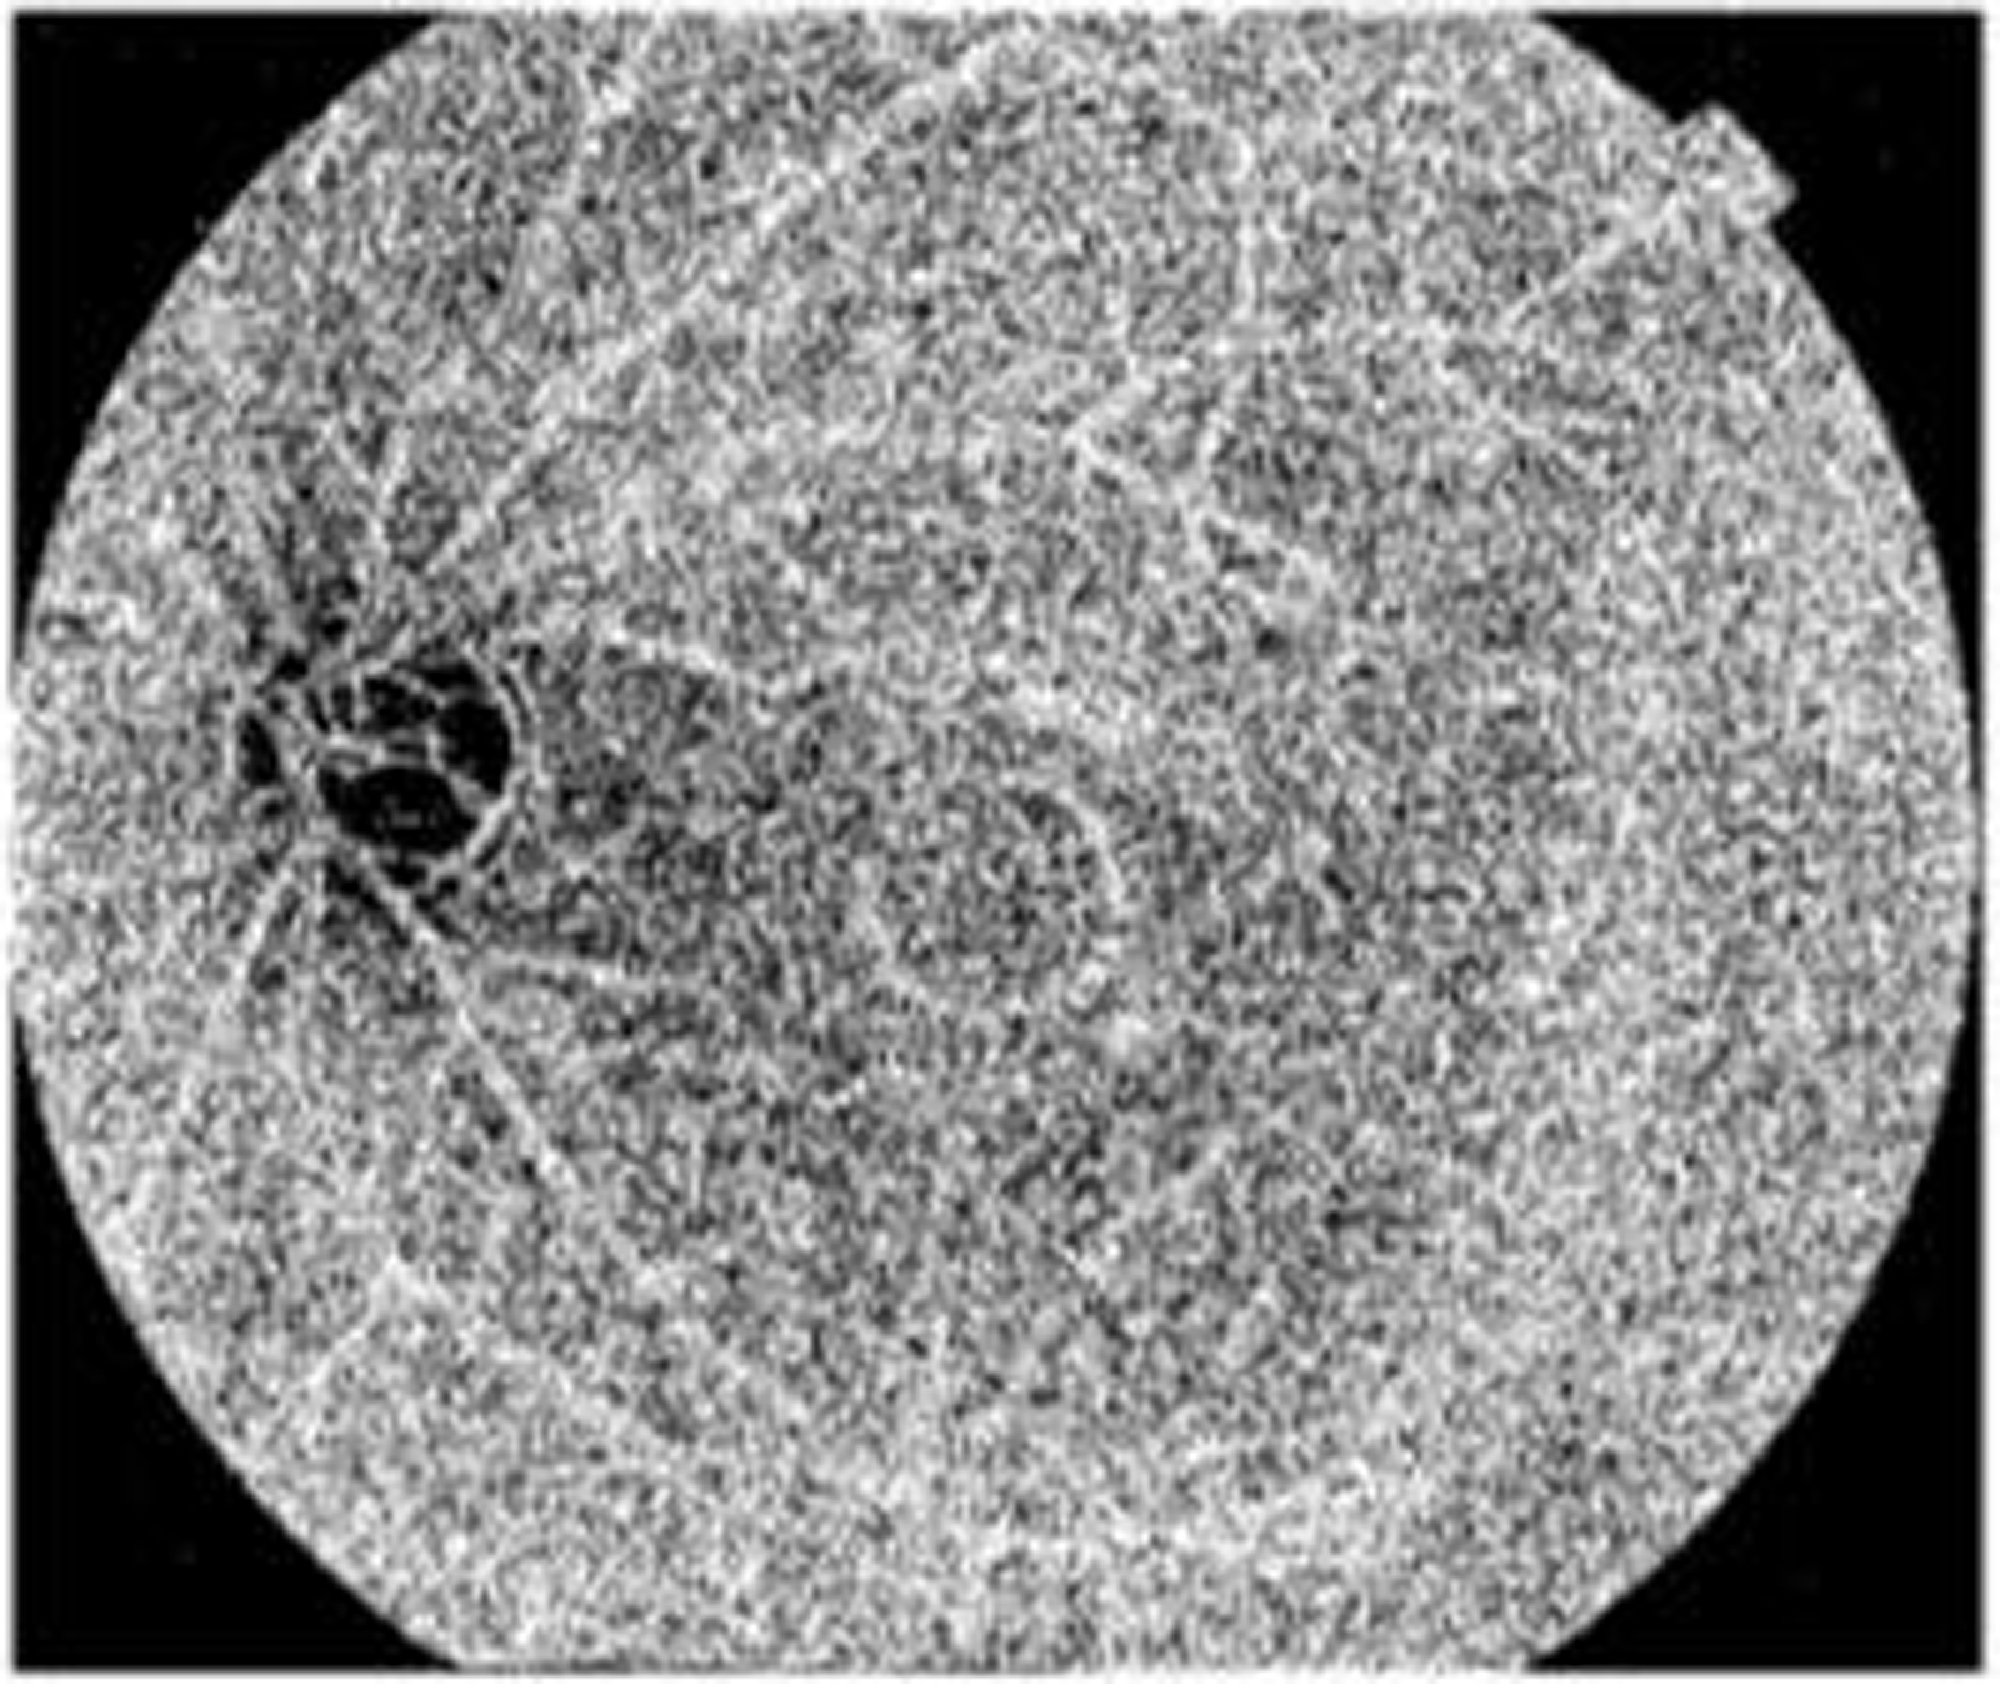
Figure 7. Binary image of the proposed model.
Figure 8 shows the segmentation image using Enriched Black Hat Transform-based. In the picture above, the blood vessels appear as clear elongated structures while the backdrop is stretched off to be dark. The Black Hat Transform is applied to an image to highlight its darker elements.
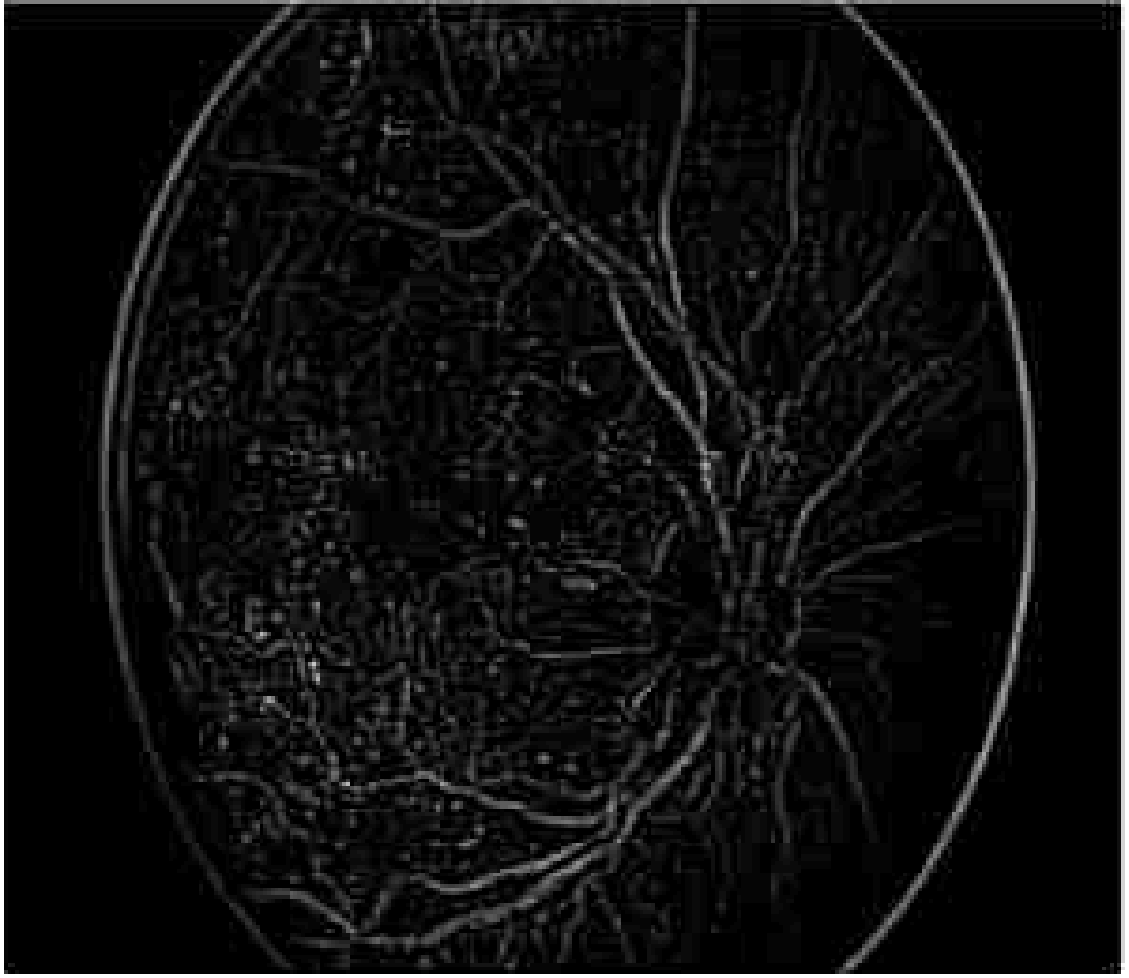
Figure 8. Segmentation using Enriched Black Hat Transform-based.
Figure 9 shows the segmentation applying Enriched Black Hat Transform-based morphological operation. Morphological procedures are used to identify and segment lesions such as microaneurysms and hemorrhages. These procedures aid in determining the form and nature of these lesions. This effectively segmented the novel features and also highlighted the features clearly.
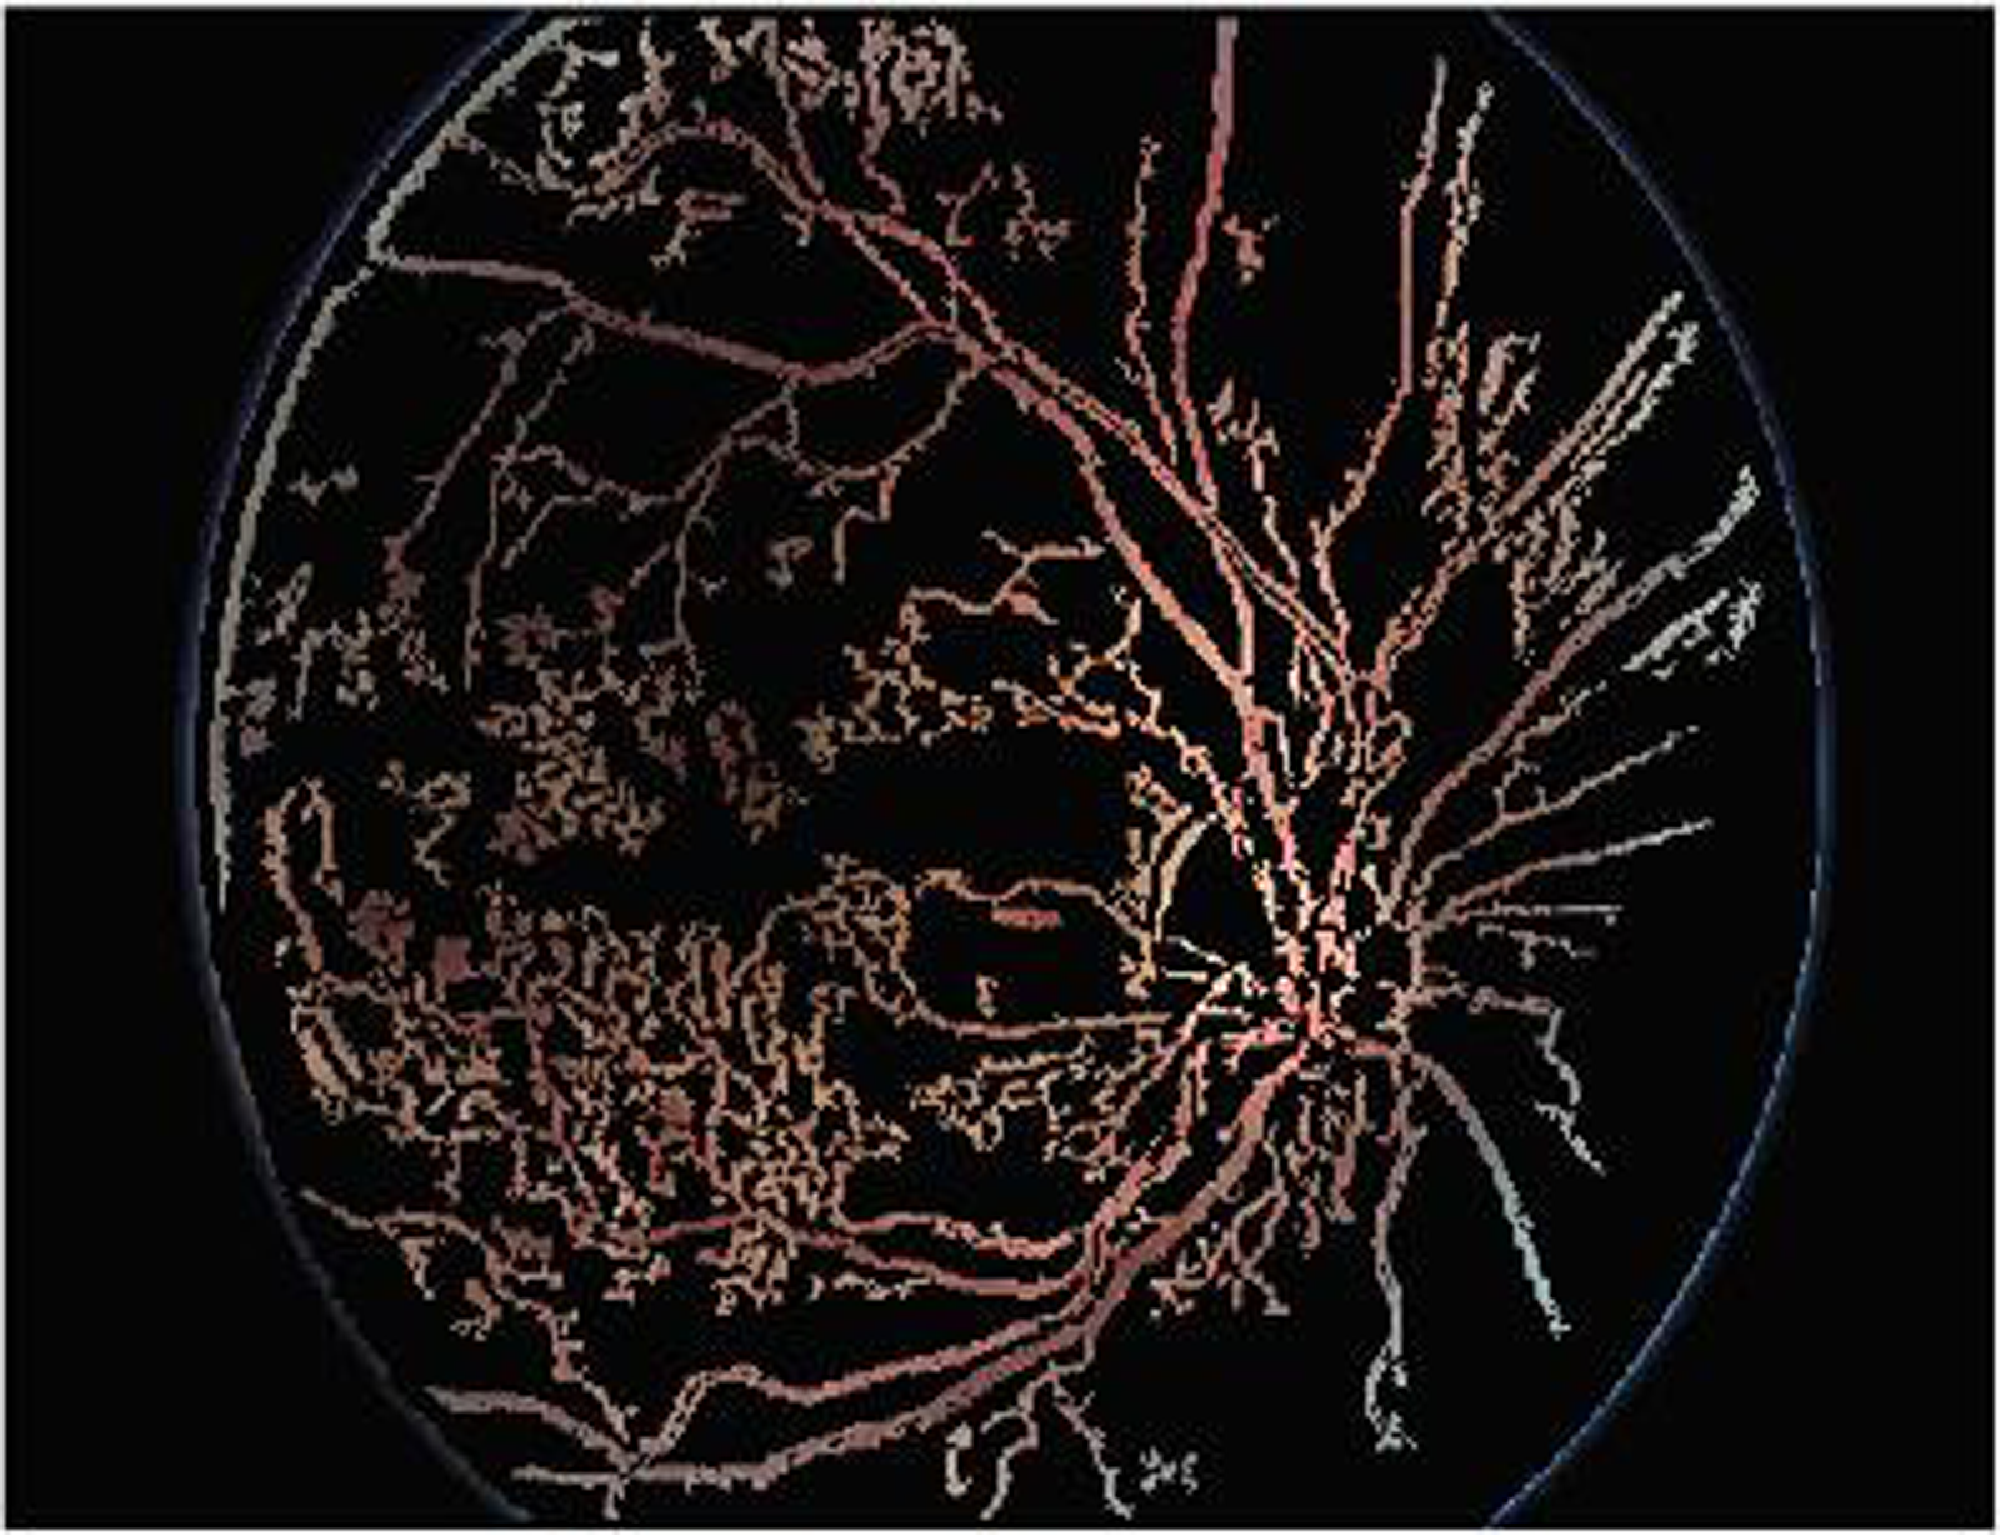
Figure 9. Segmentation applying Enriched Black Hat Transform-based morphological operation.
Figure 10 shows the classified output of the proposed model. The proposed DR is classified into five categories: Mild, Moderate, Severe, Proliferative, and Healthy. Healthy indicates no signs of DR. Among the rest, Mild indicates an early stage while Proliferative indicates an advanced and severe stage of the disease. It is crucial to identify the category of DR accurately to receive appropriate medical attention.

Figure 10. Classified output of the proposed model.
Figure 11 shows the histogram analysis of the proposed model. A histogram is a representation which demonstrates how the pixel values in an image distribute themselves. It shows the frequency of occurrence of each pixel intensity level. The histogram is used to calculate many statistical measures, including Mean, Contrast, Entropy, Energy, and Homogeneity.
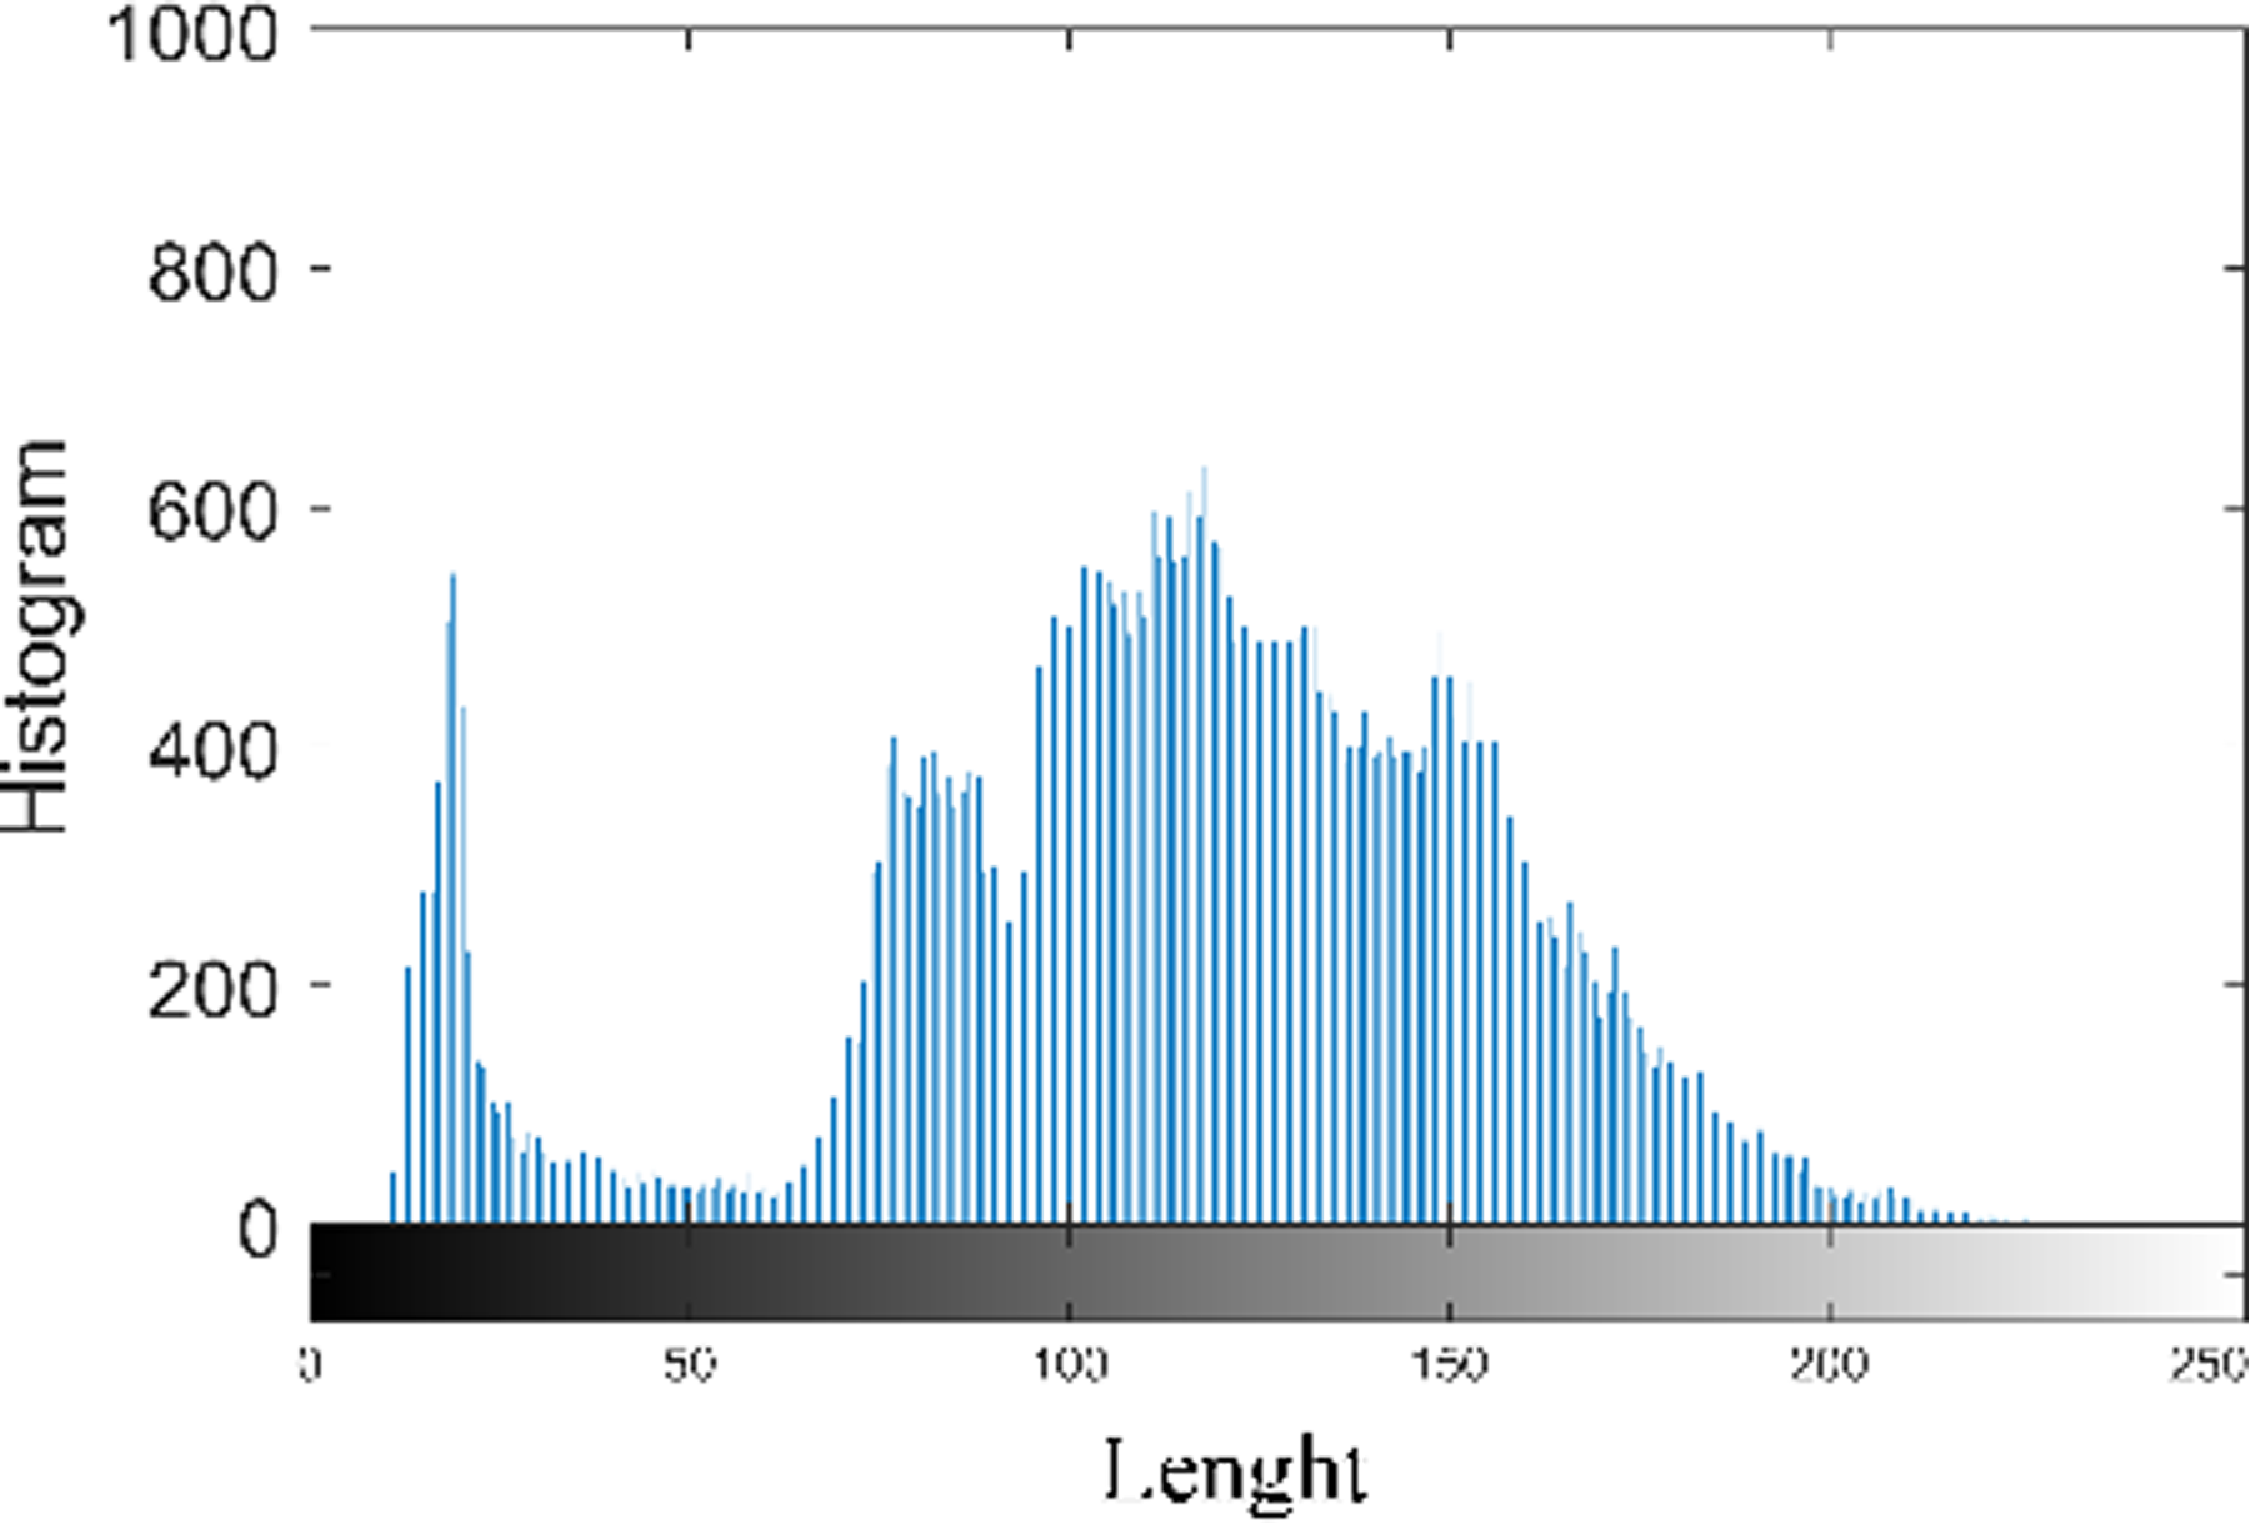
Figure 11. Histogram analysis of the proposed model.
Figure 12 shows the accuracy of the proposed model. The proposed model achieves a maximum accuracy of 99.25% and minimum value of 98.4%, when the epoch value is 40 and 200 respectively. GOA offers the capacity to analyze a variety of classification model parameter configurations. It imitates grasshopper swarming behavior, allowing it to seek the whole solution space rather than being stuck in local optima. This capacity to perform a global quest is useful in identifying the perfect environment that maximizes prediction accuracy.
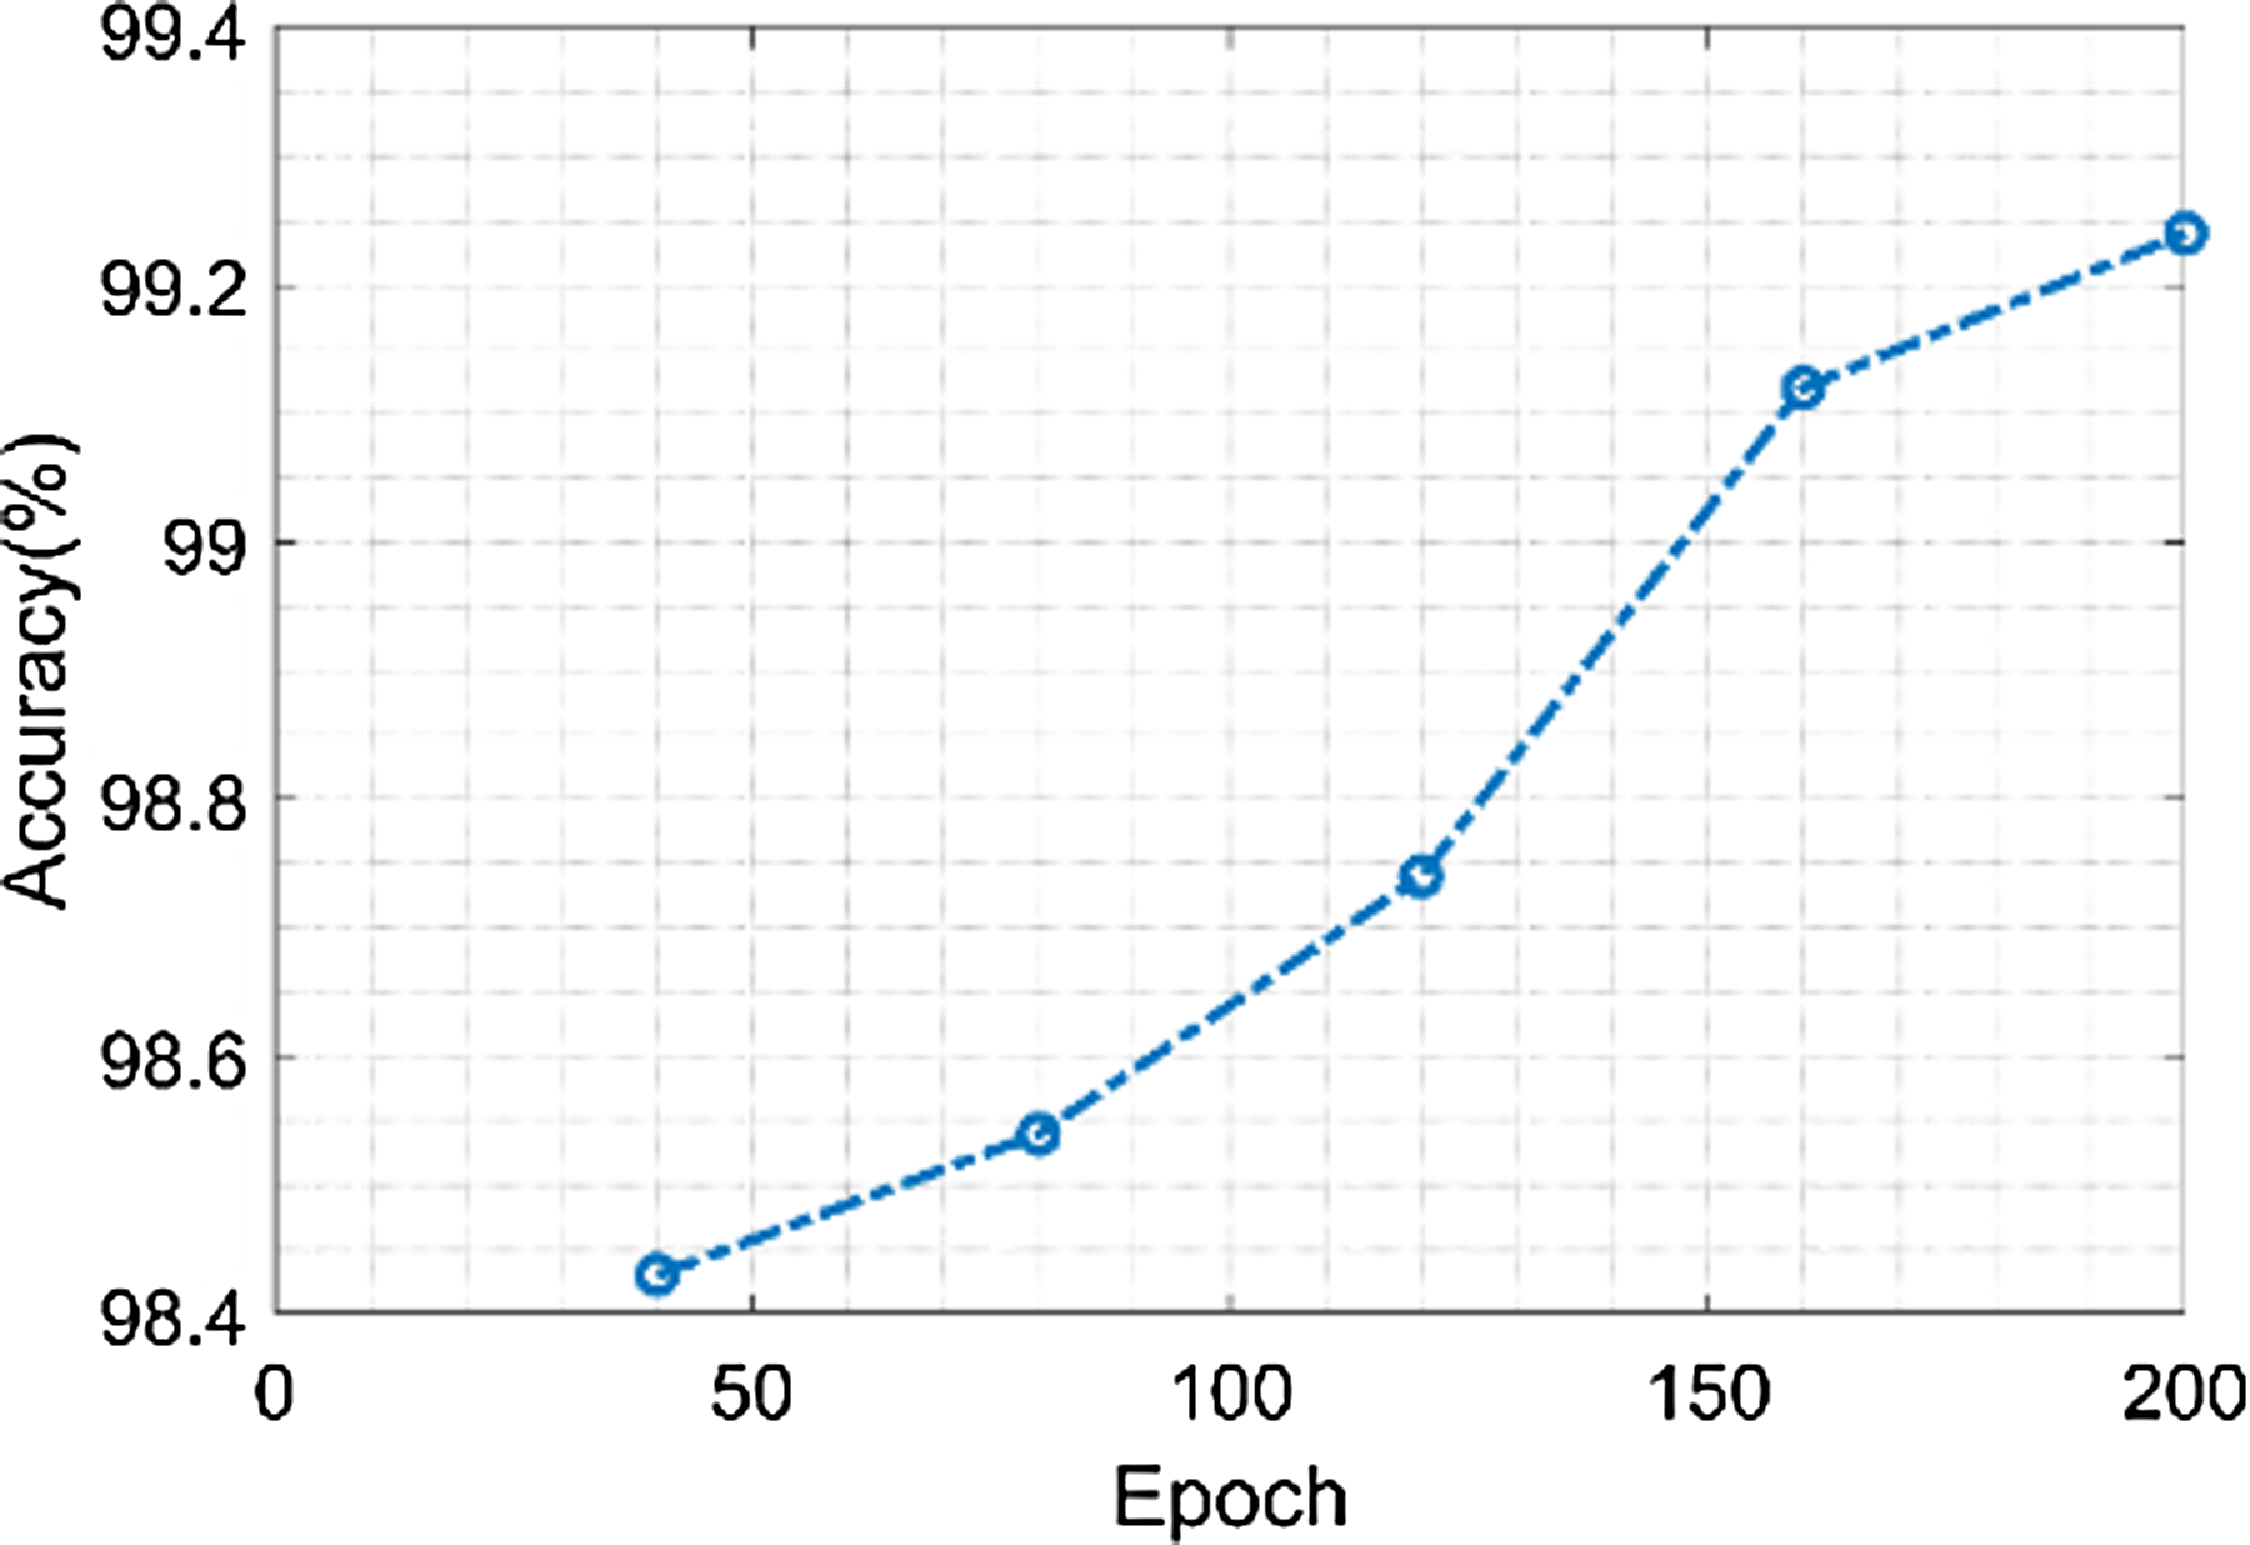
Figure 12. Accuracy of the proposed model.
Figure 13 shows the sensitivity of the proposed model. The proposed model achieves a minimum sensitivity value of 97.3% when the value of the epoch is 40 and a maximum sensitivity value of 98.4% when the value of the epoch is 200. The fundus image is streamlined while keeping crucial information during the preprocessing stage by resizing and converting it to grayscale. This stage ensures that the data used in the feature extraction phase that follows is reliable. Grayscale pictures enhance sensitivity by minimizing noise and bringing out contrast in the image.
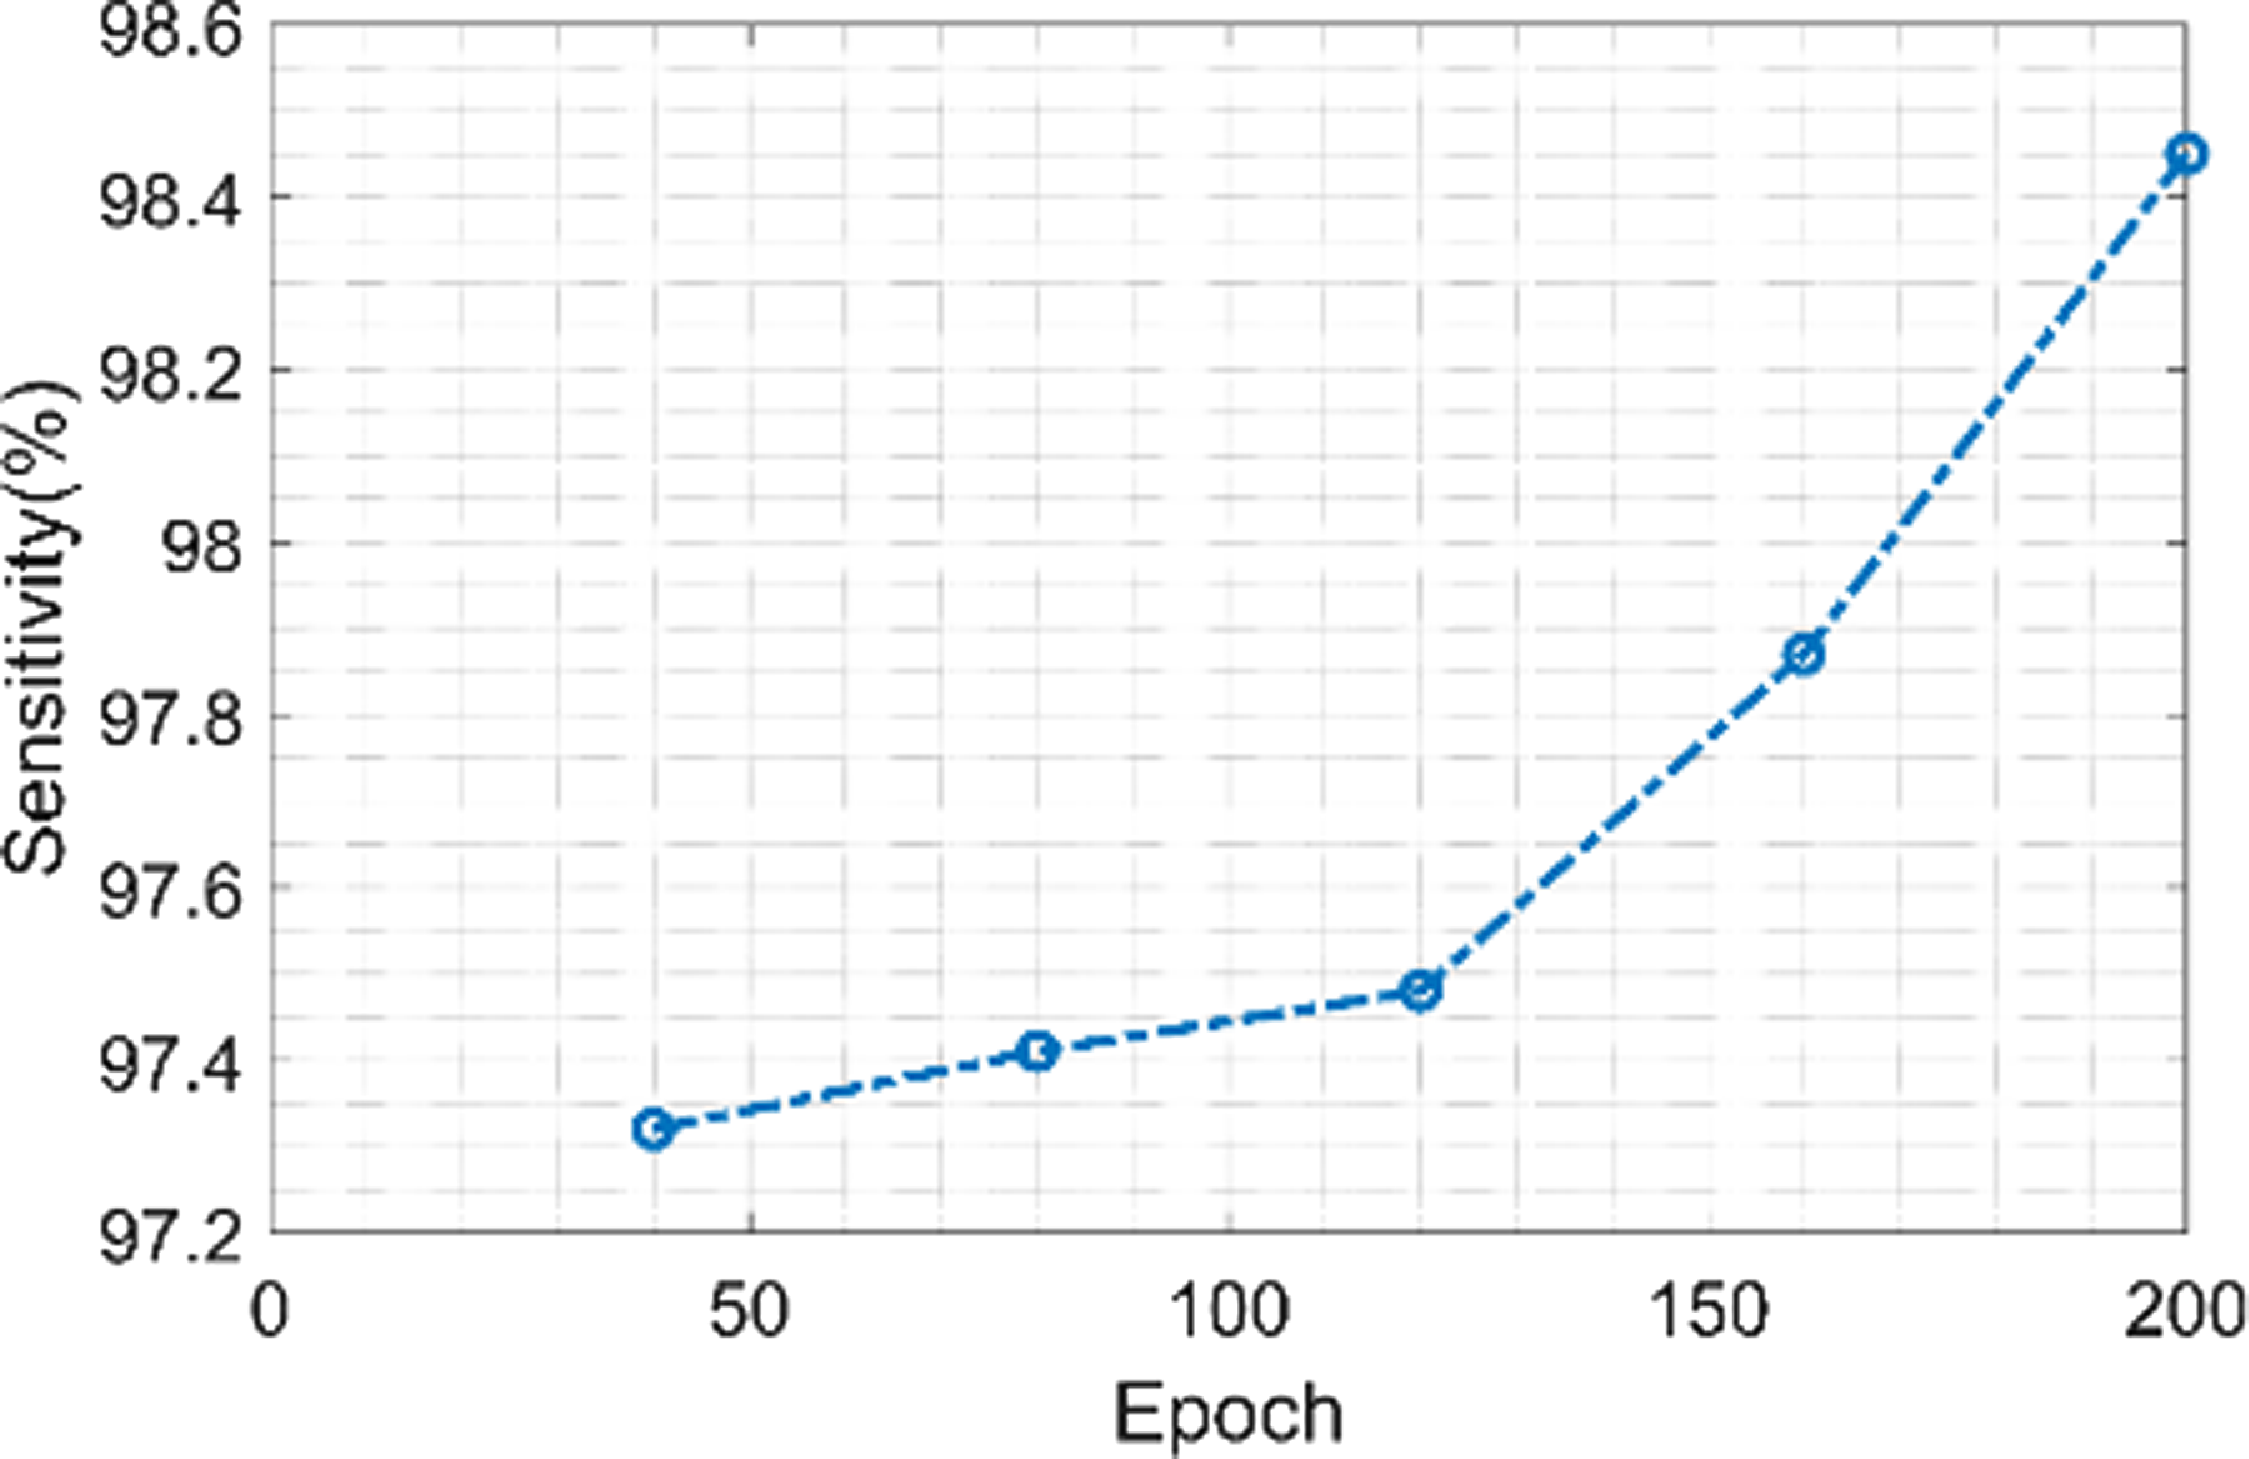
Figure 13. Sensitivity of the proposed model.
Figure 14 shows the precision of the proposed model. The proposed model achieves a minimum precision value of 96.1% when the value of the epoch is 40 and a maximum precision value of 98.5% when the value of the epoch is 200. More accurate boundaries between structures are able to be achieved by using morphological techniques to remove noise and artifacts from the segmented images. The classification phase’s total accuracy is influenced by this precision.
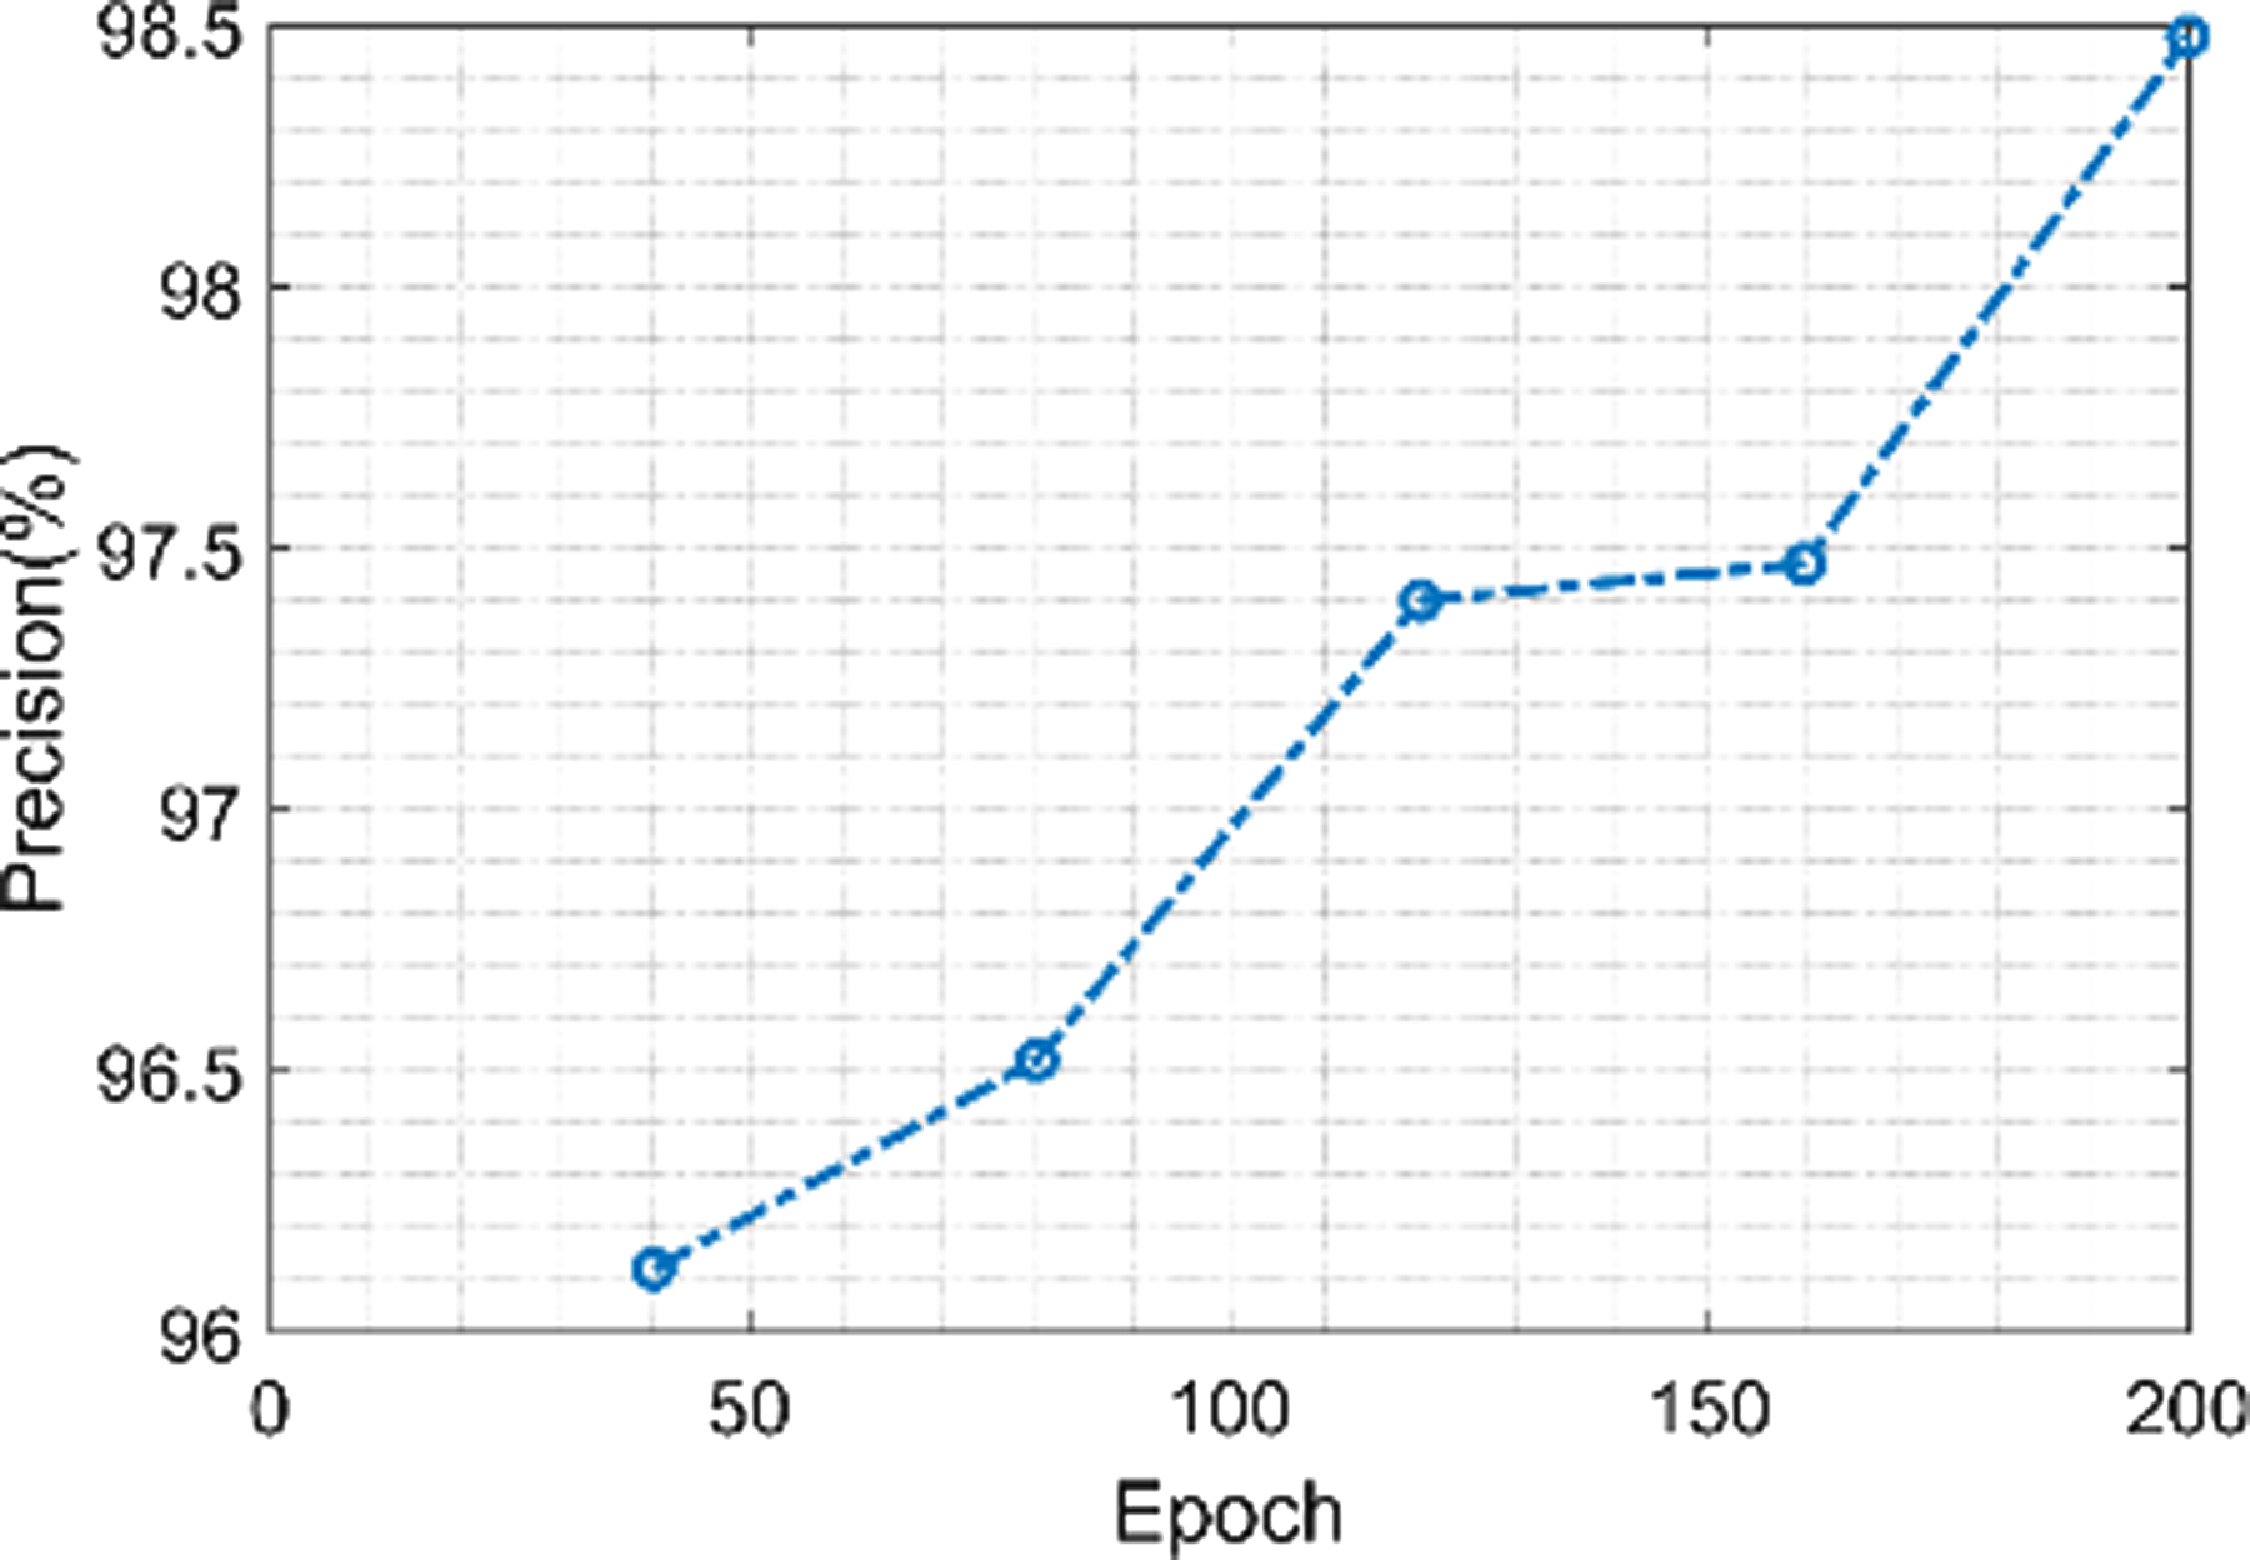
Figure 14. Precision of the proposed model.
Figure 15 shows the F1-score value of the proposed model. The proposed model has maximum F1-score value of 98.58% and minimum value of 97.36% when the epoch value is 200 and 40 respectively. Fine-scale texture information and spatial connections in the image are captured successfully when using the Fractional Radon Transform with Visibility Graph for feature extraction. As a result, classification accuracy is increased, F1-score is raised, and overall diagnostic performance is enhanced.

Figure 15. F1-score of the proposed model.
Figure 16 shows the error value of the proposed model. The proposed model achieves a maximum error value of 1.021% when the value of epoch is 45 and also achieves a minimum error value 1.015% when epoch value is 200. S-GOA is often used to optimize several ResNet configurations or variants of the model, and the predictions from each are able to be merged to provide predictions that are more reliable and precise. Compared to individual models, ensemble approaches frequently produce predictions with reduced error rates.

Figure 16. Error of the proposed model.
3.4. Comparative analysis of the proposed model
This section highlights the proposed method’s performance by comparing it to the outcomes of existing approaches such as Support vector machines (SVM) [Reference Daanouni, Cherradi and Tmiri26], Recurrent Neural Networks (RNN) [Reference Daanouni, Cherradi and Tmiri26], RBN [Reference Daanouni, Cherradi and Tmiri26], BOVW [Reference Daanouni, Cherradi and Tmiri26], MLP [Reference Daanouni, Cherradi and Tmiri26], and Convolutional Neural Networks (CNN) [Reference Daanouni, Cherradi and Tmiri26], DN-ELM [Reference Santhoshkumar, Varadarajan, Gavaskar, Amalraj and Sumathi36], U-Net [Reference Santhoshkumar, Varadarajan, Gavaskar, Amalraj and Sumathi36], WA-ANN [Reference Santhoshkumar, Varadarajan, Gavaskar, Amalraj and Sumathi36], WEM-DCNN [Reference Santhoshkumar, Varadarajan, Gavaskar, Amalraj and Sumathi36], CNN [Reference Santhoshkumar, Varadarajan, Gavaskar, Amalraj and Sumathi36], CNN [Reference Sunil and Shrivindhya37] and SVM [Reference Santhoshkumar, Varadarajan, Gavaskar, Amalraj and Sumathi36] showing their results based on various metrics.
Figure 17 shows the comparison of accuracy of the proposed technique with the existing technique. The existing techniques such as SVM, RNN, RBN, BOVW, MLP, and CNN has the accuracy value of 91%, 92.5%, 93.5%, 95%, 97%, and 98.4%. The proposed model attains an accuracy value of 99%. When compared to existing techniques, the proposed technique achieves a high accuracy value.
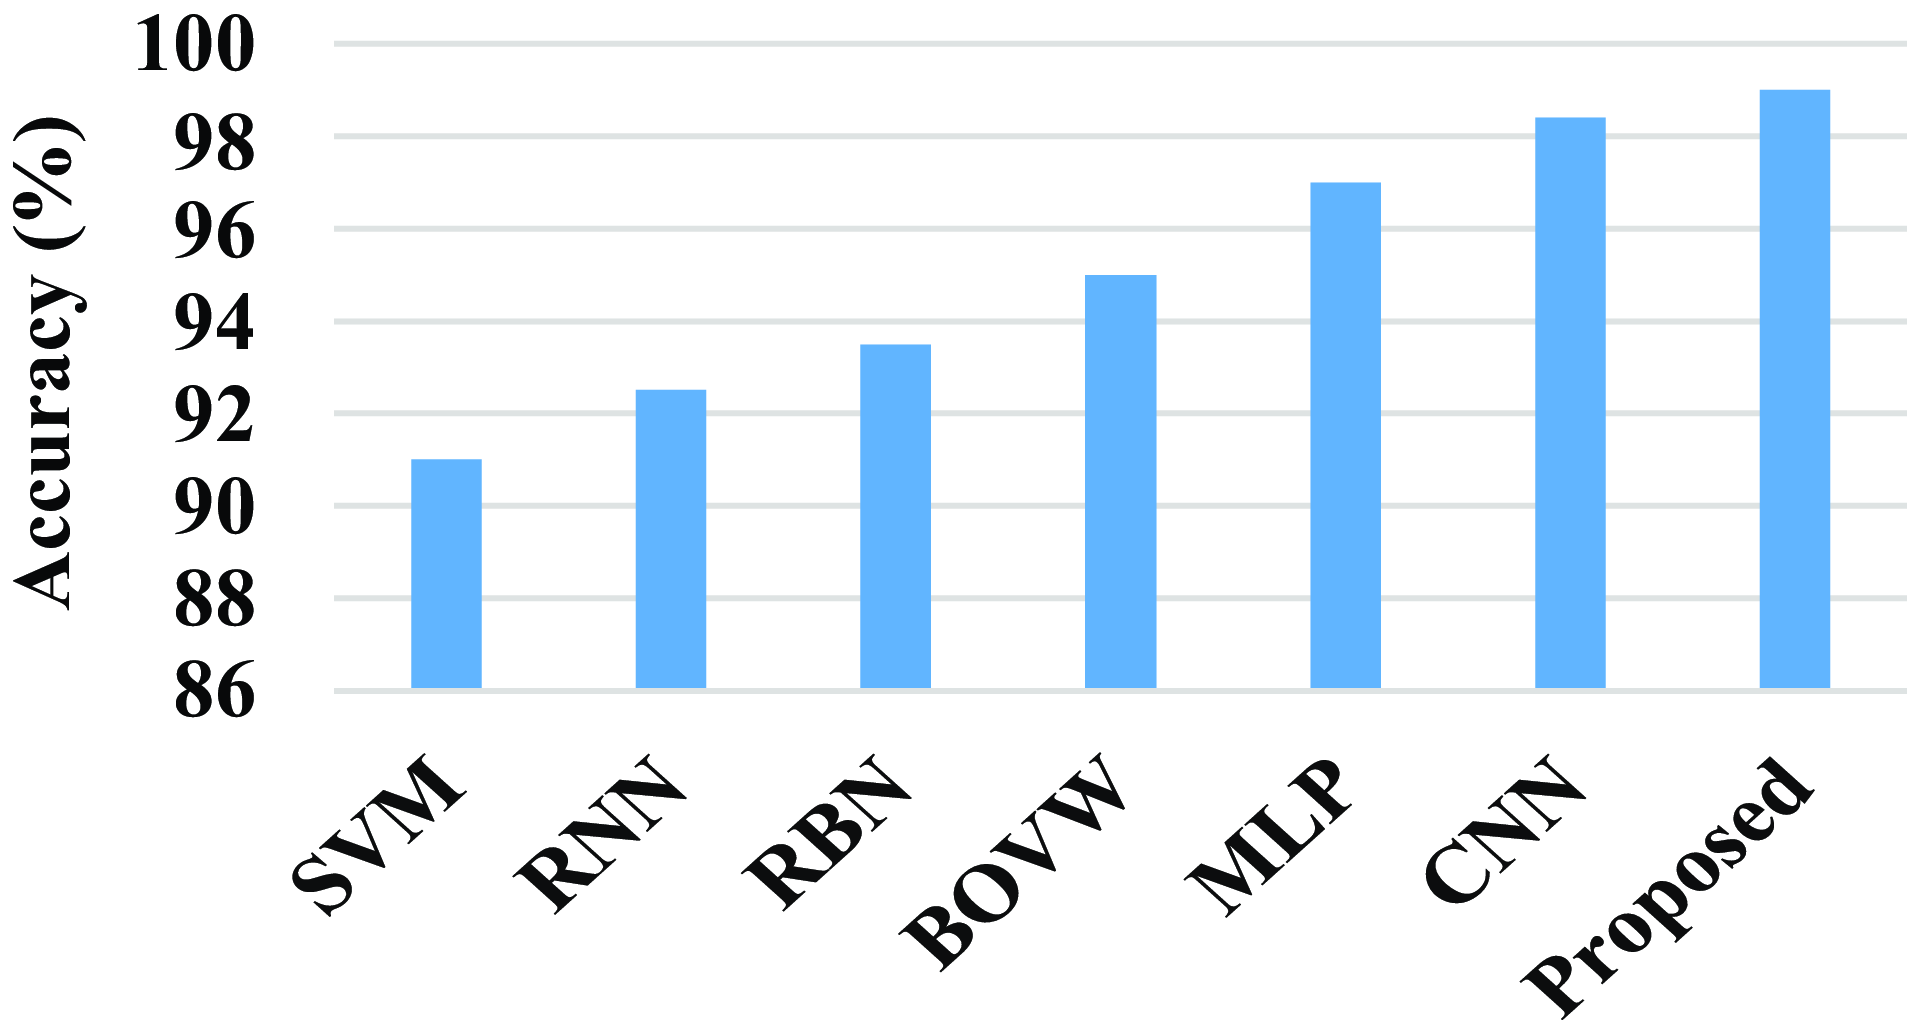
Figure 17. Comparison of accuracy.
Figure 18 shows the comparison of sensitivity of the proposed model with existing models. The existing model such as SVM, RNN, RBN, BOVW, MLP, and CNN has a sensitivity value of 92%, 93%, 94.5%, 95.5%, 93%, and 98%. Compared with existing models the proposed model attains a high sensitivity value. The proposed model achieves a high sensitivity value of 98.5%.
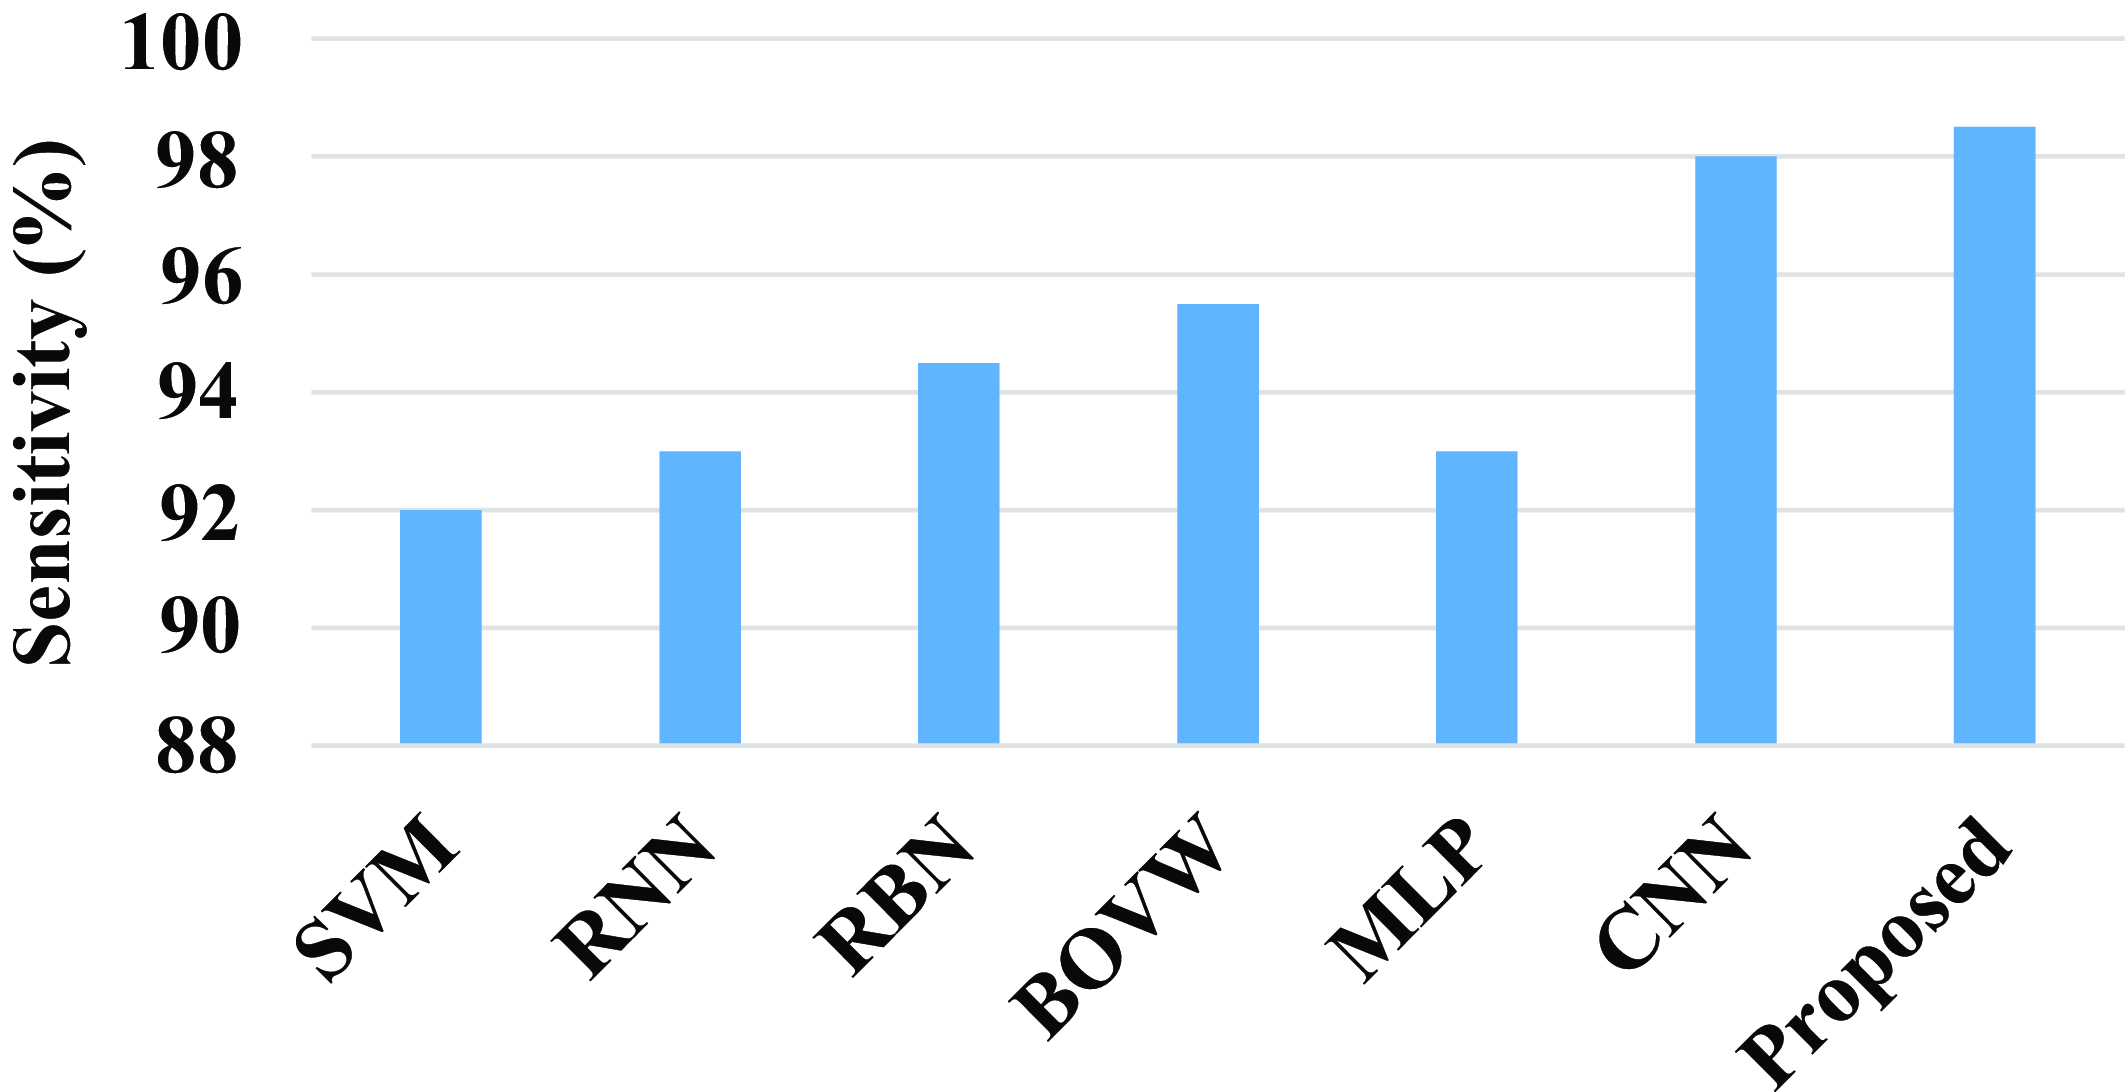
Figure 18. Comparison of sensitivity.
The precision of the proposed model and existing models are compared in the above fig. 19. The existing model such as SVM, RNN, RBN, BOVW, MLP, and CNN has a precision value of 92%, 94%, 94%, 95.5%, 93.5%, and 98.3%. Compared with existing models the proposed model attains a high precision value. The proposed model achieves a high precision value of 98.6%.
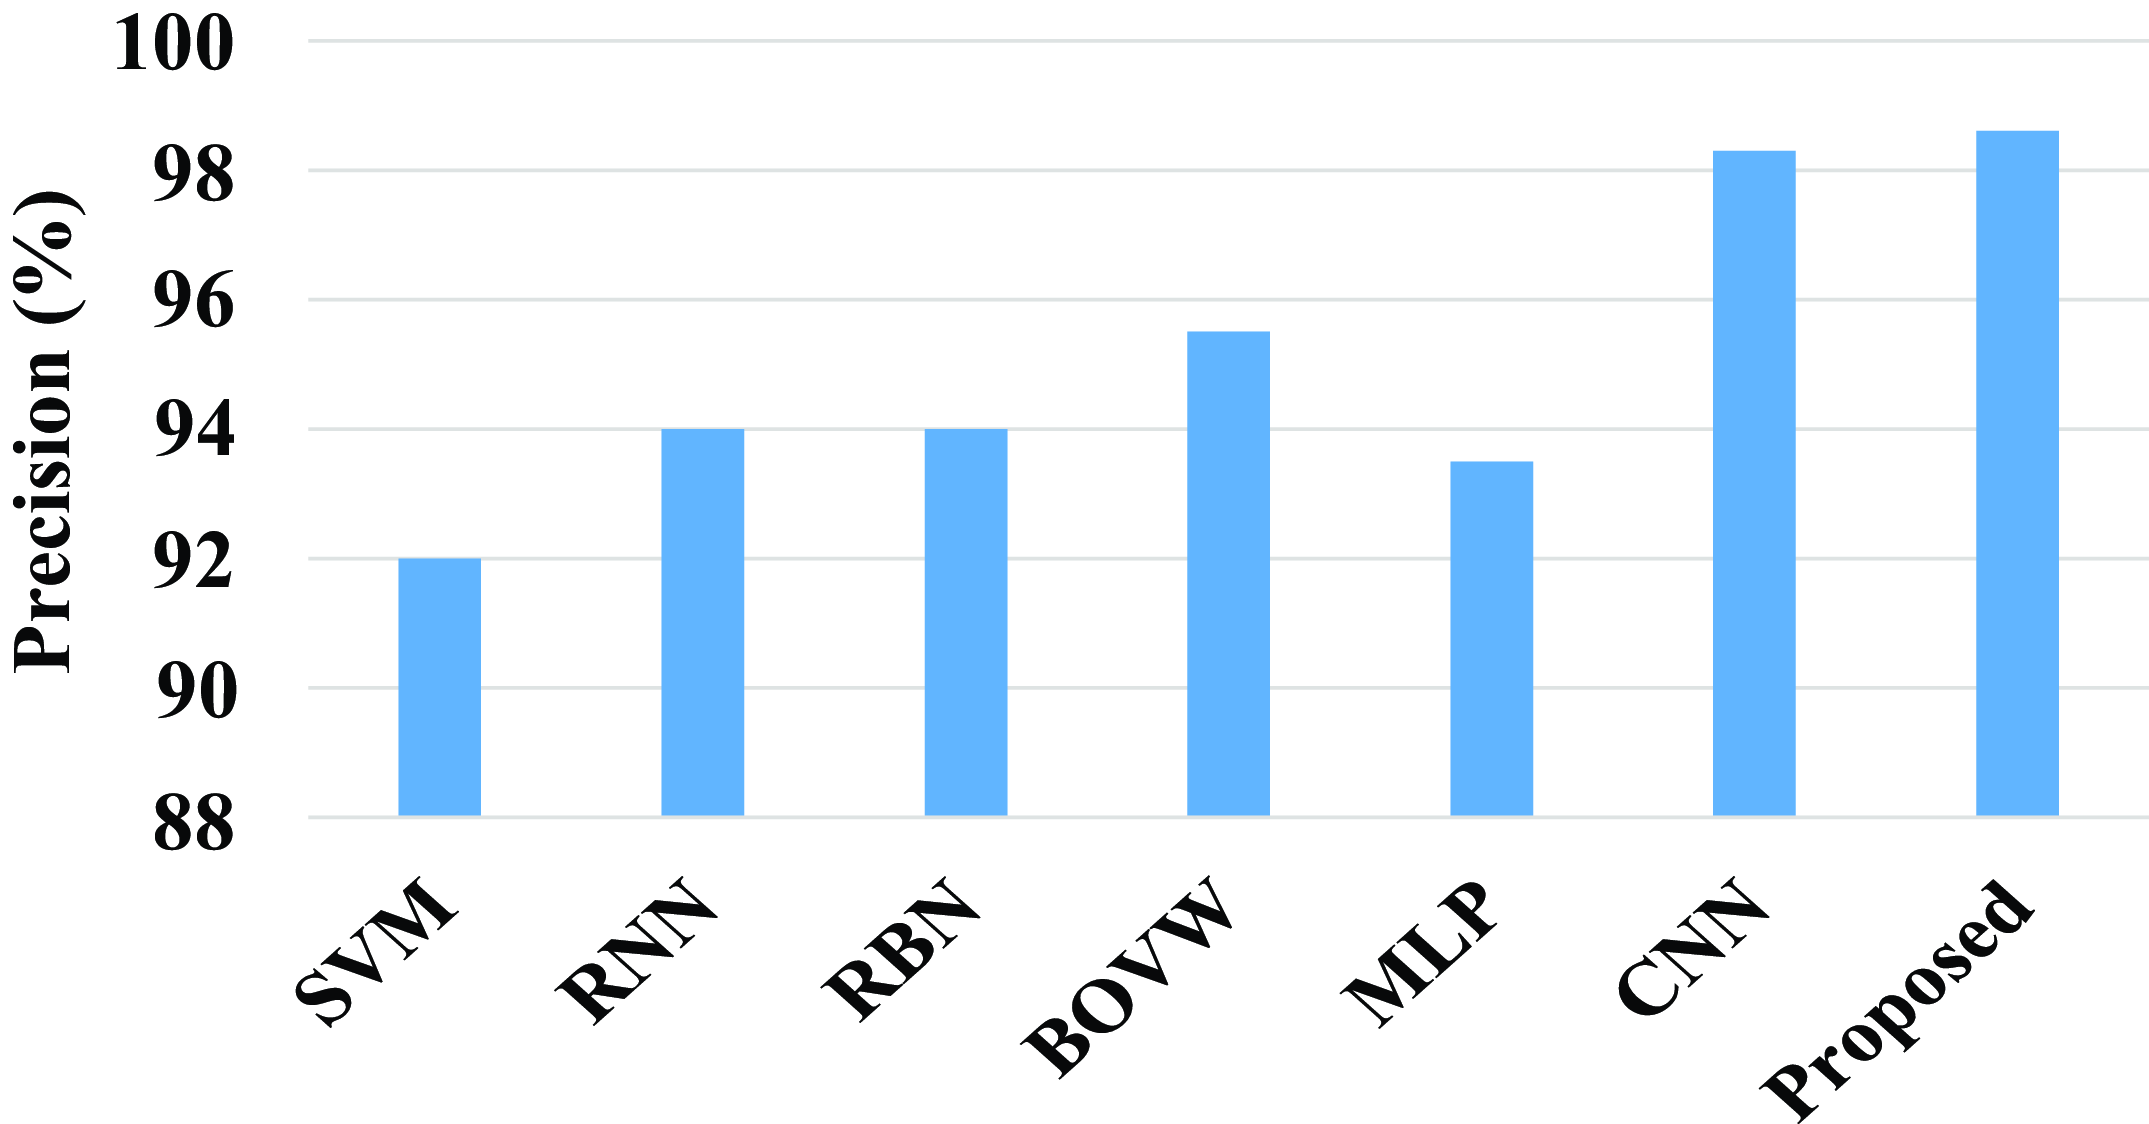
Figure 19. Comparison of precision.
Figure 20 shows the comparison of F1-score of the proposed model with the existing model. Existing models such as SVM, RNN, RBN, BOVW, MLP, and CNN have a F1-score percentage of 89.7%, 92.5%, 93%, 95.5%, 96%, and 98.45%, whereas the proposed model has a F1-score value 98.6%. Compared with existing models the proposed model has a high F1-score value.

Figure 20. Comparison of F1-score of the proposed model.
Figure 21 shows the comparison of the proposed model with the existing models. Existing models such as SVM, RNN, RBN, BOVW, MLP, and CNN have an error value of 9%, 7.5%, 6.4%, 5%, 3.5%, and 1.7%. The proposed model has an error value of 1.023%. Compared with existing model the proposed model has a less error value.
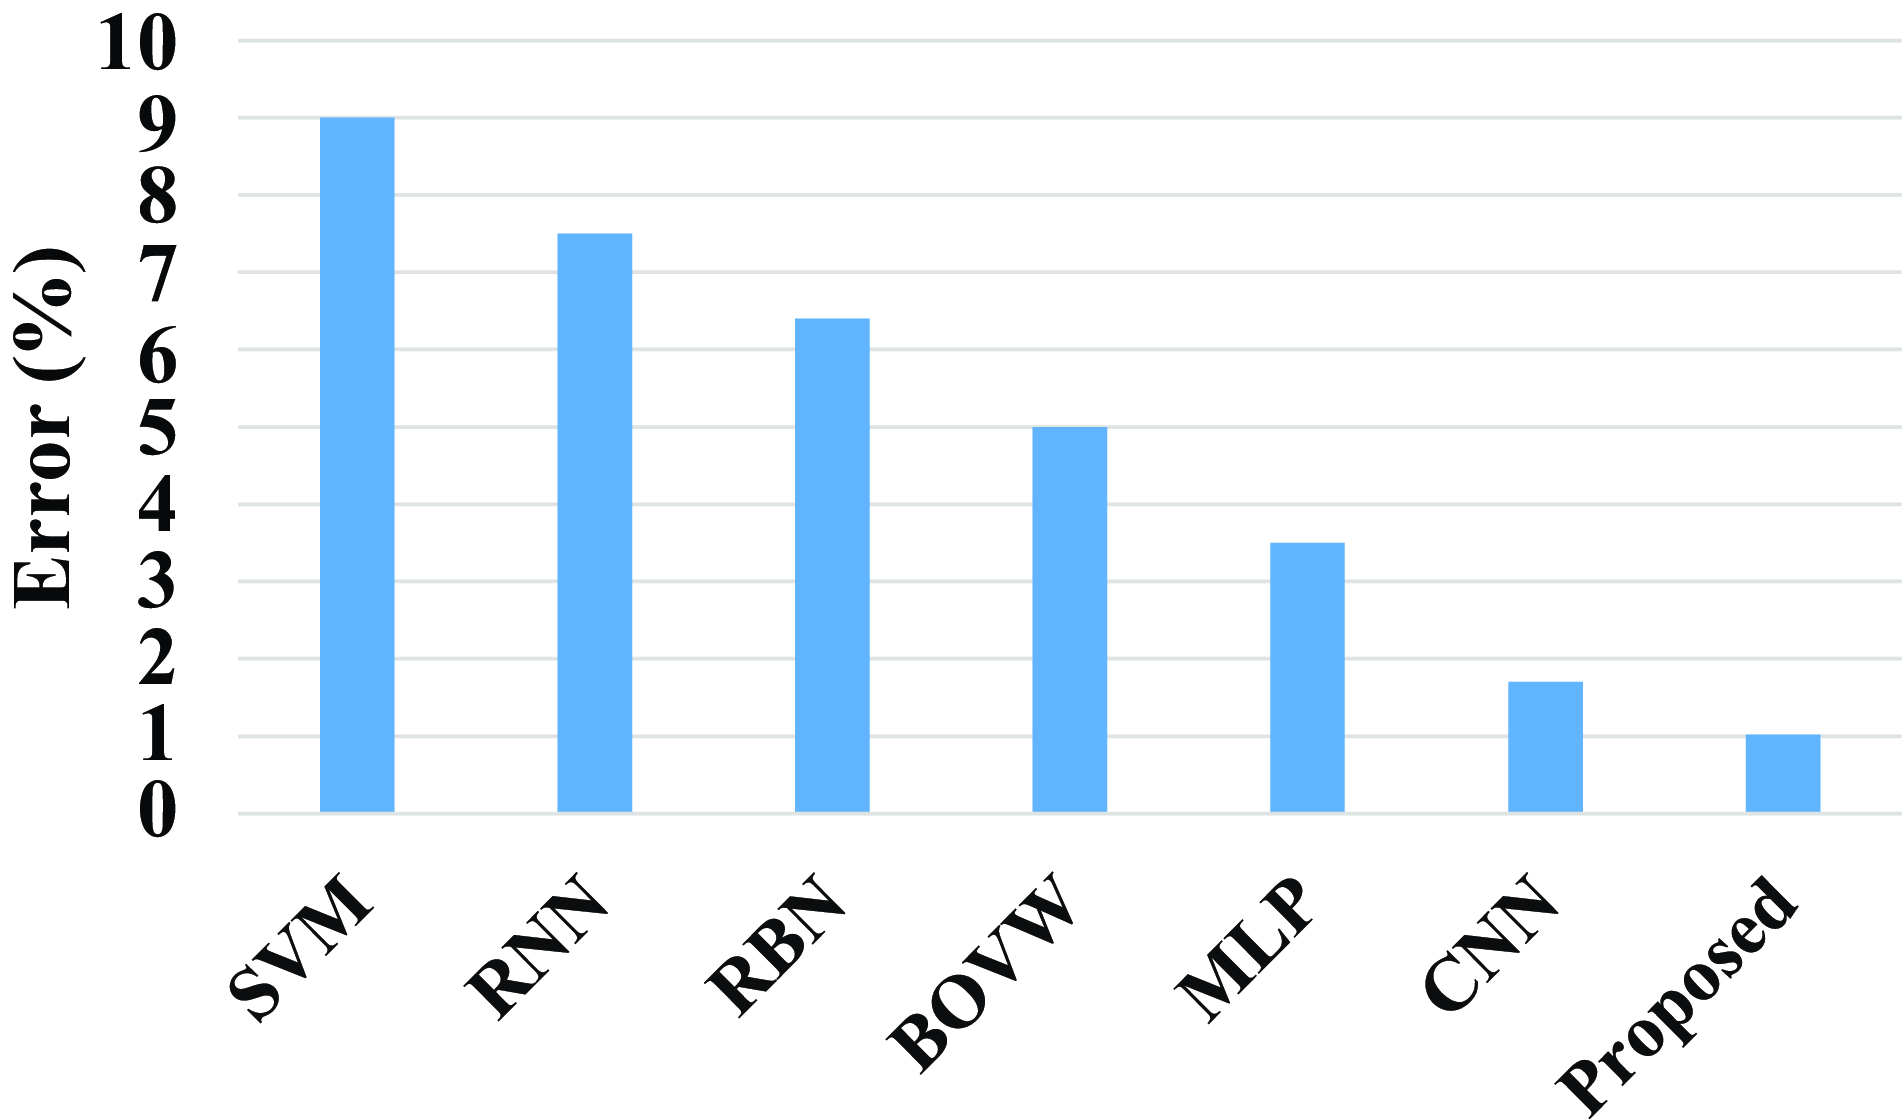
Figure 21. Comparison of error of the proposed model.
Figure 22 shows the comparison of computation time of the proposed model with existing models. Existing models such as DN-ELM, U-Net, WA-ANN, WEM-DCNN, CNN, and SVM have a computation time of 30 sec, 42 sec, 78 sec, 74 sec, 72 sec, and 90 sec. When compared with existing models, the proposed has a less computation time. The proposed model has a less computation time of 23 sec.

Figure 22. Comparison of computation time of the proposed model.
Overall, the proposed approach demonstrates that it is more effective and accurate when compared to earlier models like SVM, RNN, RBN, BOVW, MLP, DN-ELM, U-Net, WA-ANN, WEM-DCNN, and CNN. The suggested model achieves a low computation time of 23 sec and an error value of 1.023%. The suggested models achieve a high accuracy of 99.25%, sensitivity of 94.8%, precision of 98.5%, and an F1-score value of 98.58%. This proves that the proposed approach outperformed other existing approaches.
4. Conclusion
A novel earlier smart prediction of diabetic retinopathy from fundus image under Innovative ResNet Optimization Maneuver has been presented to effectively detect the earlier stage of DR from fundus image. A Fractional Radon Transform with Visibility graph was made to extract unique properties including the number of microaneurysms in the retina, the number of dot and blot hemorrhages in the retina, and the distribution of these hemorrhages, as well as statistical measures like homogeneity, contrast, entropy, and energy, as well as retinal layer thickness. For segmentation and classification, a brand-new Morphological Black Hat Transform with an improved ResNet algorithm has been developed. In order to segment the pixels, an Enriched Black Hat Transform-based Morphological operation was used to find small dark areas. Classification was done by using ResNet-driven S-GOA which optimally predicts the stages of DR from fundus image. Compared with existing models, the proposed model achieves a low computation time of 23 sec and an error value of 1.023%. The proposed models attain a high accuracy of 99.25%, a sensitivity of 94.8%, a precision of 98.5%, and an F1-score value of 98.58%. The proposed architecture was found to be fully comprehensive based on the metric results. Thus, the proposed architecture was utilized to provide a better prediction according to the results.
Author contributions
Sunil S.S and Dr. A. Shri Vindhya conceived and designed the study and conducted data gathering and performed statistical analyses. Sunil S.S wrote the article.
Financial support
This research received no specific grant from any funding agency, commercial, or not-for-profit sectors.
Competing interests
The authors declare no conflicts of interest exist.
Ethical standards
None.


