


Overall glycaemic index (GI) and dietary glycaemic load (GL) have been used as indicators of carbohydrate quality(Reference Ludwig, Hu, Tappy and Brand-Miller1,Reference Reynolds, Mann and Cummings2) . These metrics are based on the acute impact of digestible carbohydrates on blood glucose(Reference Ludwig3–Reference Barclay, Augustin and Brighenti5). High-GI and high-GL diets stimulate lipogenesis, increase oxidative stress, and impair endothelial function(Reference Ludwig, Aronne and Astrup6–Reference Yu, Zhang and Shu8). Poor carbohydrate quality diets also affect insulin-like growth factor I circulating levels, which may in turn increase breast cancer risk(Reference Debras, Chazelas and Srour9). The Prospective Urban Rural Epidemiology (PURE) study, a multi-country cohort that includes more than 137 000 participants(Reference Teo, Chow and Vaz10), showed that overall participants in the highest category of GI had a 21 % higher incidence of a major cardiovascular event or death relative to those in the lowest category(Reference Jenkins, Dehghan and Mente11). Relative to high-income countries, the magnitude of the association appeared to be lower in low- and middle-income countries. Three population-based case-control studies conducted in Mexico suggest that carbohydrate intake and carbohydrate quality could play a role in breast cancer incidence(Reference Amadou, Degoul and Hainaut12–Reference Lajous, Willett and Lazcano-Ponce14).
Mexico is a middle-income country, where 68 % of total energy intake comes from carbohydrates(Reference López-Olmedo, Carriquiry and Rodríguez-Ramírez15). Also, this is one of the countries with the highest consumption of foods with added sugars(Reference Aburto, Pedraza and Sánchez-Pimienta16,Reference Singh, Micha and Khatibzadeh17) (which have a high GI) and where diabetes exerts an important impact on all-cause and cardiovascular disease (CVD) mortality(Reference Alegre-Díaz, Herrington and López-Cervantes18). Increasing our understanding of the impact of high consumption of low-quality carbohydrates across populations may provide additional insights for etiologic research and global health and public.
We hypothesised that the intake of high GI/GL foods increases all-cause and CVD and breast cancer mortality in women. Thus, we conducted an analysis in a large sample of Mexican women aged 25 years or older participating in a cohort assembled in 2006–2008 and followed up to 2019 to estimate the effect of low-quality carbohydrate intake on all-cause and CVD and breast cancer mortality.
Materials and methods
Participants
The Mexican Teachers’ Cohort (MTC) is an ongoing prospective cohort established between 2006 and 2008(Reference Lajous, Santoyo-Vistrain and García-Anaya19). The study includes 115 306 female teachers from twelve states in Mexico who were 25 years and older at baseline. Potential participants received an invitation letter and a scannable paper questionnaire on demographic and reproductive characteristics, diet, lifestyle and medical conditions. Responding to the baseline questionnaire was considered informed consent from all participants. For the current analysis, we excluded participants with unusual energy intake (≤500 calories or >3500 calories) and/or a FFQ with ≥70 or more missing items and/or no information on the cereal and grain questionnaire sections (n 21 911), given that these are considered staple foods. We also excluded women who at baseline reported a diagnosis of diabetes (n 5330), CVD (n 192) and breast and cervical cancer (n 1263). Thus, the final analytical sample included 86 610 participants. This study was conducted according to the guidelines laid down in the Declaration of Helsinki, and all procedures involving human subjects were approved by the research, ethics and biosecurity commissions of the National Institute of Public Health of Mexico with number CI1364.
Overall glycaemic index and dietary glycaemic load
At baseline, we assessed habitual food intake using a 144-item semiquantitative FFQ. Participants specified how often they consumed a unit or serving of each food during the previous year. Possible responses were never, once a month or less, 2–3 times a month, once a week, 2–4 times a week, 5–6 times a week, once a day, 2–3 times a day, 4–5 times a day and 6 or more times a day. A similar version of the FFQ was previously validated among 134 Mexico City female residents in a 12-month study(Reference Hernández-Avila, Romieu and Parra20). Correlation coefficients between the FFQ and four 4-day 24-h recalls administered the previous year were 0·52 for total energy, 0·57 for carbohydrate, 0·32 for protein, and 0·63 for total fat.
We followed an established methodology to incorporate GI values of foods included in the MTC’s FFQ to estimate overall GI and dietary GL (online Supplementary Fig. S1)(Reference Flood, Subar and Hull21). We extracted values using the glucose scale, on which 100 indicates the GI for glucose, from international GI tables(Reference Atkinson, Foster-Powell and Brand-Miller22,Reference Atkinson, Brand-Miller and Foster-Powell23) . An experienced Mexican nutritionist (A.M.) reviewed all food items in the FFQ and identified foods in the international tables that were directly linked to the FFQ items (n 49). Whenever possible, we averaged values of the same food from different studies. For 18 items, we used the GI value for a closely related food (e.g., lemon flavoured beverage instead of non-cola carbonated beverage, fusilli pasta instead of homemade pasta, Cornflakes instead of ready-to-eat cereals). For vegetables for which appropriate GI value could not be found, we calculated a simple mean of GI values for vegetables in the tables (n 17). When the food was a simple mixture found in the tables or a mixed dish, we used a weighted mean of GI values for the ingredients (n 12). Of the remaining FFQ items, four (local fruits: mamey, sapote, lime, and prickly pear) were minor contributors to carbohydrate intake and their GI value were imputed to 50. Finally, we assigned a value of zero to 44 food items without carbohydrates. Next, we calculated GL per serving by portion size, multiplying each item’s available carbohydrate content (in grams) by its GI (divided by 100). Then, this value was weighted by its specified portion size in the FFQ. Each unit of GL represents the equivalent of 1 gram of carbohydrate from a glucose solution. Therefore, a high-GI food will have a greater glycaemic response at higher carbohydrate intakes(Reference Salmerón, Ascherio and Rimm24–Reference Vega-López, Venn and Slavin29). The GL value for every food in the FFQ was estimated as the product of the available carbohydrate content (in grams) for each food and GI (÷100) for the food consumed. Then, this value was weighted by the specified portion size in the FFQ. These GL values were used to calculate the dietary GL based on reported frequency across all items on the questionnaire. We estimated the overall GI, an indicator of the average quality of carbohydrates consumed, by dividing the dietary GL by the total amount of carbohydrates consumed(Reference Liu, Manson and Stampfer25,Reference Willett, Manson and Liu26) . Thus, GI is the weighted average of GI values of the foods consumed. Details on the GI values used, mean GL per food item and proportion of GL provided by each food can be found in online Supplementary Table S1. The top five contributors to GL were corn tortillas (10·5 %), fruit-flavoured beverages (5·0 %), rice (4·3 %), carbonated beverages (4·2 %) and bananas and bread (tied at 3·9 %).
Mortality
Information on deaths that occurred between baseline and December 2019 was obtained from (1) administrative databases from state education authorities (updated once a year), (2) next-of-kin reports, and (3) a pension fund management database. Dates and causes of death were identified and confirmed through two national mortality registries: the mortality database from Instituto Nacional de Estadística y Geografía (Inegi)(30), between January 1, 2006, through December 31, 2016, and the Subsistema Epidemiológico y Estadístico de Defunciones (31), from January 1, 2006 to December 31, 2019. Additionally, we cross-linked all remaining participants in the cohort to include deceased women who had not been reported as dead. Cross-linkage was performed using a probabilistic record linkage algorithm explicitly developed for Mexico by the Public Health Intelligence Unit at the National Institute of Public Health(Reference Quezada-Sánchez, Espín-Arellano and Morales-Carmona32). This algorithm demonstrated a sensitivity of 91 % and a positive predictive value of 97 % for the identification of deaths. We previously evaluated the validity of the mortality registries for identifying deaths in the MTC and found a high sensitivity and specificity(Reference Lozano-Esparza, Zazueta and Hernández-Ávila33). Causes of death were coded according to the International Classification of Diseases, 10th revision(34). The endpoints were all-cause mortality, CVD (I00-I99) and breast cancer (C50) deaths.
Assessment of covariates
Covariate information was based on self-reports from the baseline questionnaire. Variables to address confounding were selected for inclusion in multivariable models using directed acyclic graphs (see details in online Supplementary Fig. S2A). The baseline questionnaire collected information on speaking or having a parent who spoke an indigenous language. We obtained information on seven household assets (phone, car, computer, vacuum cleaner, microwave oven, cell phone and internet access). Participants reported family history of hypertension, diabetes, myocardial infarction and breast cancer. Information on reproductive history included age at menarche, detailed information on each pregnancy including breastfeeding, and menopausal status. We assessed average weekly hours spent on mild, moderate and vigorous recreative physical activity over the last 12 months by providing eight response categories for each type of activity that spanned from none to >10 h/week. In a subsample of 86 cohort participants, the correlation coefficients for vigorous and moderate-to-vigorous activity from this questionnaire and the International Physical Activity Questionnaire were 0·60 and 0·30(Reference Medina, Monge and Denova-Gutiérrez35). We also used self-reported smoking and information on dietary factors from the FFQ that could affect mortality but were not included in the calculation of GI values and GL, such as intake of red meat, seafood, and alcohol.
Statistical analyses
Continuous variables were expressed as means (±s d), medians and categorical variables as percentages. Women were categorised in quintiles of GI and GL. For socioeconomic status, we used the sum of the household assets and categorised women according to tertiles of this socioeconomic status score in low, medium, and high. We estimated total recreational physical activity metabolic equivalents (MET) per week by multiplying the usual hours in each activity type by MET for mild (2·2), moderate (4·7) and vigorous (6·0) and categorised participants in tertiles of recreational physical activity. Alcohol intake in servings per week was estimated based on eight items in the FFQ. We excluded beer, from the calculation because it was included in the estimation of GI. For red meat intake, we used eleven food items (processed and unprocessed) and seafood intake was based on seven items.
For everyone, person-years of follow-up were calculated from the date of response to the baseline questionnaire (2006 or 2008) to the date of death or December 31, 2019, whichever occurred first. Using the Cox hazard proportional model with follow-up time as the time scale, we estimated hazard ratios (HR) and 95 % confidence intervals (95 % CI) for each quintile of GI and GL, using the lowest category as the reference. We verified the proportional hazards assumption of the Cox model by a graphical display of the empirical score process and a quantitative assessment based on the martingale residuals. For categorical analyses, we used the lowest quintile of GI and GL as the referent. We used a competitive risk model to evaluate cause-specific mortality. We performed a survival analysis for CVD and breast cancer mortality separately, where the other events (i.e. competing deaths) were censored(Reference Kleinbaum and Klein36). The results were expressed as sub-distribution HR with 95 % confidence intervals (95 % CI).
We evaluated non-linearity between GI and GL and mortality using Cox proportional hazards regression model with cubic spline functions and the smooth curve fitting (penalised method)(Reference Pan, Han and Hu37). Therefore, we assessed the relations between GI and GL and all-cause mortality using restricted cubic splines with four knots, placed according to Harrell’s suggested percentiles(38). We fit age-adjusted and multivariable-adjusted models, using the covariates described above. In our primary analyses, total energy intake and BMI were not included in multivariable models because these factors are affected by the exposures of interest (i.e., GI and GL; online Supplementary Fig. S2B)(Reference Lajous, Banack and Kaufman39,Reference Hernán, Hsu and Healy40) . We also explored the relation of the top contributing food groups to GL (fruits, sugar-sweetened beverages, and corn tortilla) and all-cause mortality.
We conducted several post hoc and sensitivity analyses. There are 22 fruit items in our FFQ, and fruits were important contributors to GI in this population. Thus, we repeated analyses using GI and GL values that excluded fruits. We explored the sensitivity of our results by excluding beer from GI and GL and including BMI and energy intake (in kilocalories) as covariates in multivariable models. We also repeated analyses calculating GI and GL based on seven food groups used in the PURE study(Reference Jenkins, Dehghan and Mente11). We excluded 20 237 cohort participants from our analytic sample because of non-valid dietary questionnaires. Thus, we explored the characteristics of excluded participants relative to those included in this analysis. We imputed missing values for family history of hypertension (11 %; n 9513), diabetes (14 %; n 11 720), myocardial infarction (22 %; n 19 151) and breast cancer (26 %; n 19 151) to no history of disease. None of the other variables had more than 5 % missing values. We imputed those to the mode or median.
All statistical analyses were performed with SAS software, version 9.4.
Results
The mean age of participants was 42·3 (standard deviation ±7·4 years). The age-standardised distribution of risk factors for mortality according to quintiles of GI and GL is summarised in Table 1. Women with the highest GI were three years of age younger relative to women in the lowest category of GI. After accounting for age, the proportion of women with high socioeconomic status in the highest category of GI was 46 % and the corresponding proportion for women in the lowest category of GI was 31 %. While the proportion of indigenous women in the lowest category of GI was 13 %, proportion among those in the highest category was 5 %. Family history of hypertension appeared to be more frequent in women in the highest relative to the lowest category of GI (64 % v. 68 %). Dietary GI was directly associated with early menarche (i.e. <11 years), nulliparity and smoking. Similar patterns in the distribution of risk factors and GL were observed. In contrast to GI, a direct relation between GL and physical activity was observed.
Table 1. Age-standardised participant characteristics, by baseline quintiles of overall glycaemic index and dietary glycaemic load in 86 610 Mexican women from the MTC*
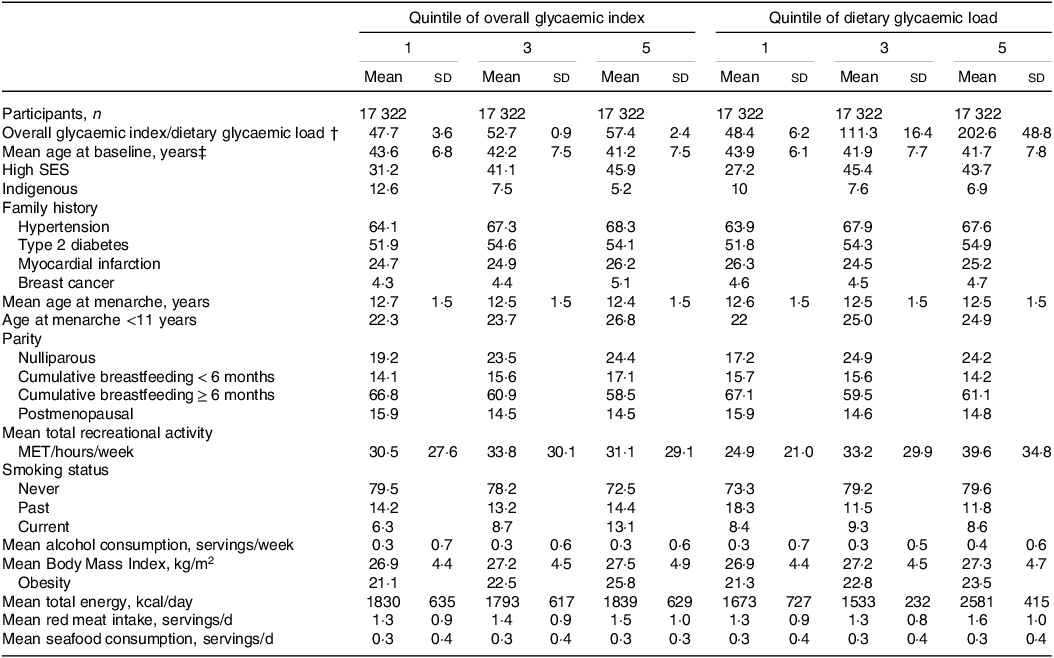
* Values are percentages unless stated otherwise (mean ± sd) and are standardised to the age distribution of the study population. Values of polytomous variables may not sum to 100 % due to rounding. MET, Metabolic equivalent from recreational and leisure-time activities; SES, socioeconomic status; MTC, the Mexican Teachers Study.
† Median (interquartile range).
‡ Value is not age-adjusted. 4 Excluding beer.
We documented 1198 deaths (206 CVD and 92 breast cancer) in 910 728 person-years of follow-up (median follow-up: 10). The median value for the GI was 53 (interquartile range, 5), and for the GL was 111 (interquartile range, 98). In multivariable models, GI and GL appeared to be minimally associated with all-cause mortality (Table 2). When comparing extreme quintiles of GI, we observed 12 % higher mortality (GI, HR = 1·12; 95 % CI: 0·93, 1·35) in the highest category. GL results were similar (HR = 1·12; 95 % CI: 0·87, 1·44). We further explored the relation between these exposures and all-cause mortality using restricted cubic splines adjusted for covariates, and, for GI, we found a slight upward trend in mortality with a wide underlying variation. (Fig. 1(a)). The relation appeared to be non-monotonic for GL, but the limited magnitude and ample variability remained the same. (Fig. 1(b)). When we repeated analyses excluding fruits from the calculation of GI and GL, results were closer to the null for GI, but the association for GL appeared to be strengthened in the third and fourth quintiles.
Table 2. Hazard ratios (HR) and 95 % confidence intervals (95 % Cl) for all-cause mortality by quintiles (Q) of overall glycaemic index (GI) and dietary glycaemic load (GL) in the Mexican women from the MTC, n 86 610 (2006–2008)*
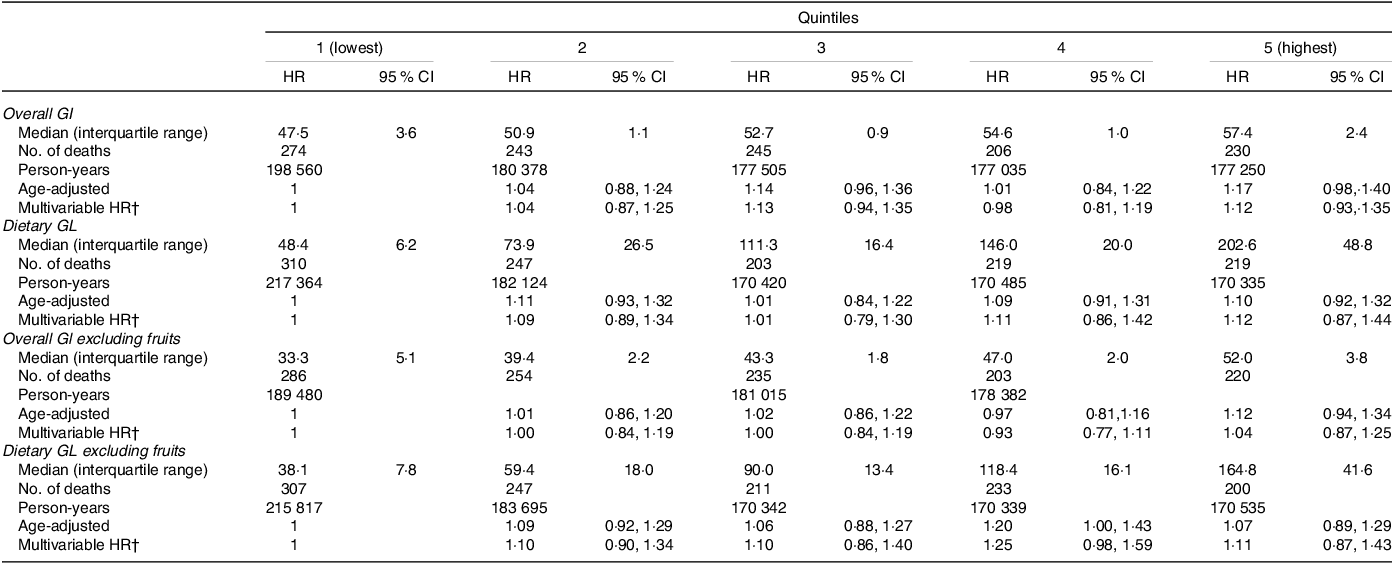
* HRs and 95 % CI estimated from Cox proportional hazard model. The MTC, the Mexican Teachers Study.
† Includes the following: age, socieconomic status, indigenous, age at menarche (≤11 years, ≥12), breastfeeding (nulliparous, <6 months, ≥6 months), menopausal status (premenopausal, postmenopausal, don’t know), family history of hypertension of diabetes, of heart attack and of breast cancer (no, yes), smoking status (never, ex-smoker, current), total intensity exercise, red meat and seafood intake (servings/d), and alcohol consumption (excluding beer, servings/week).
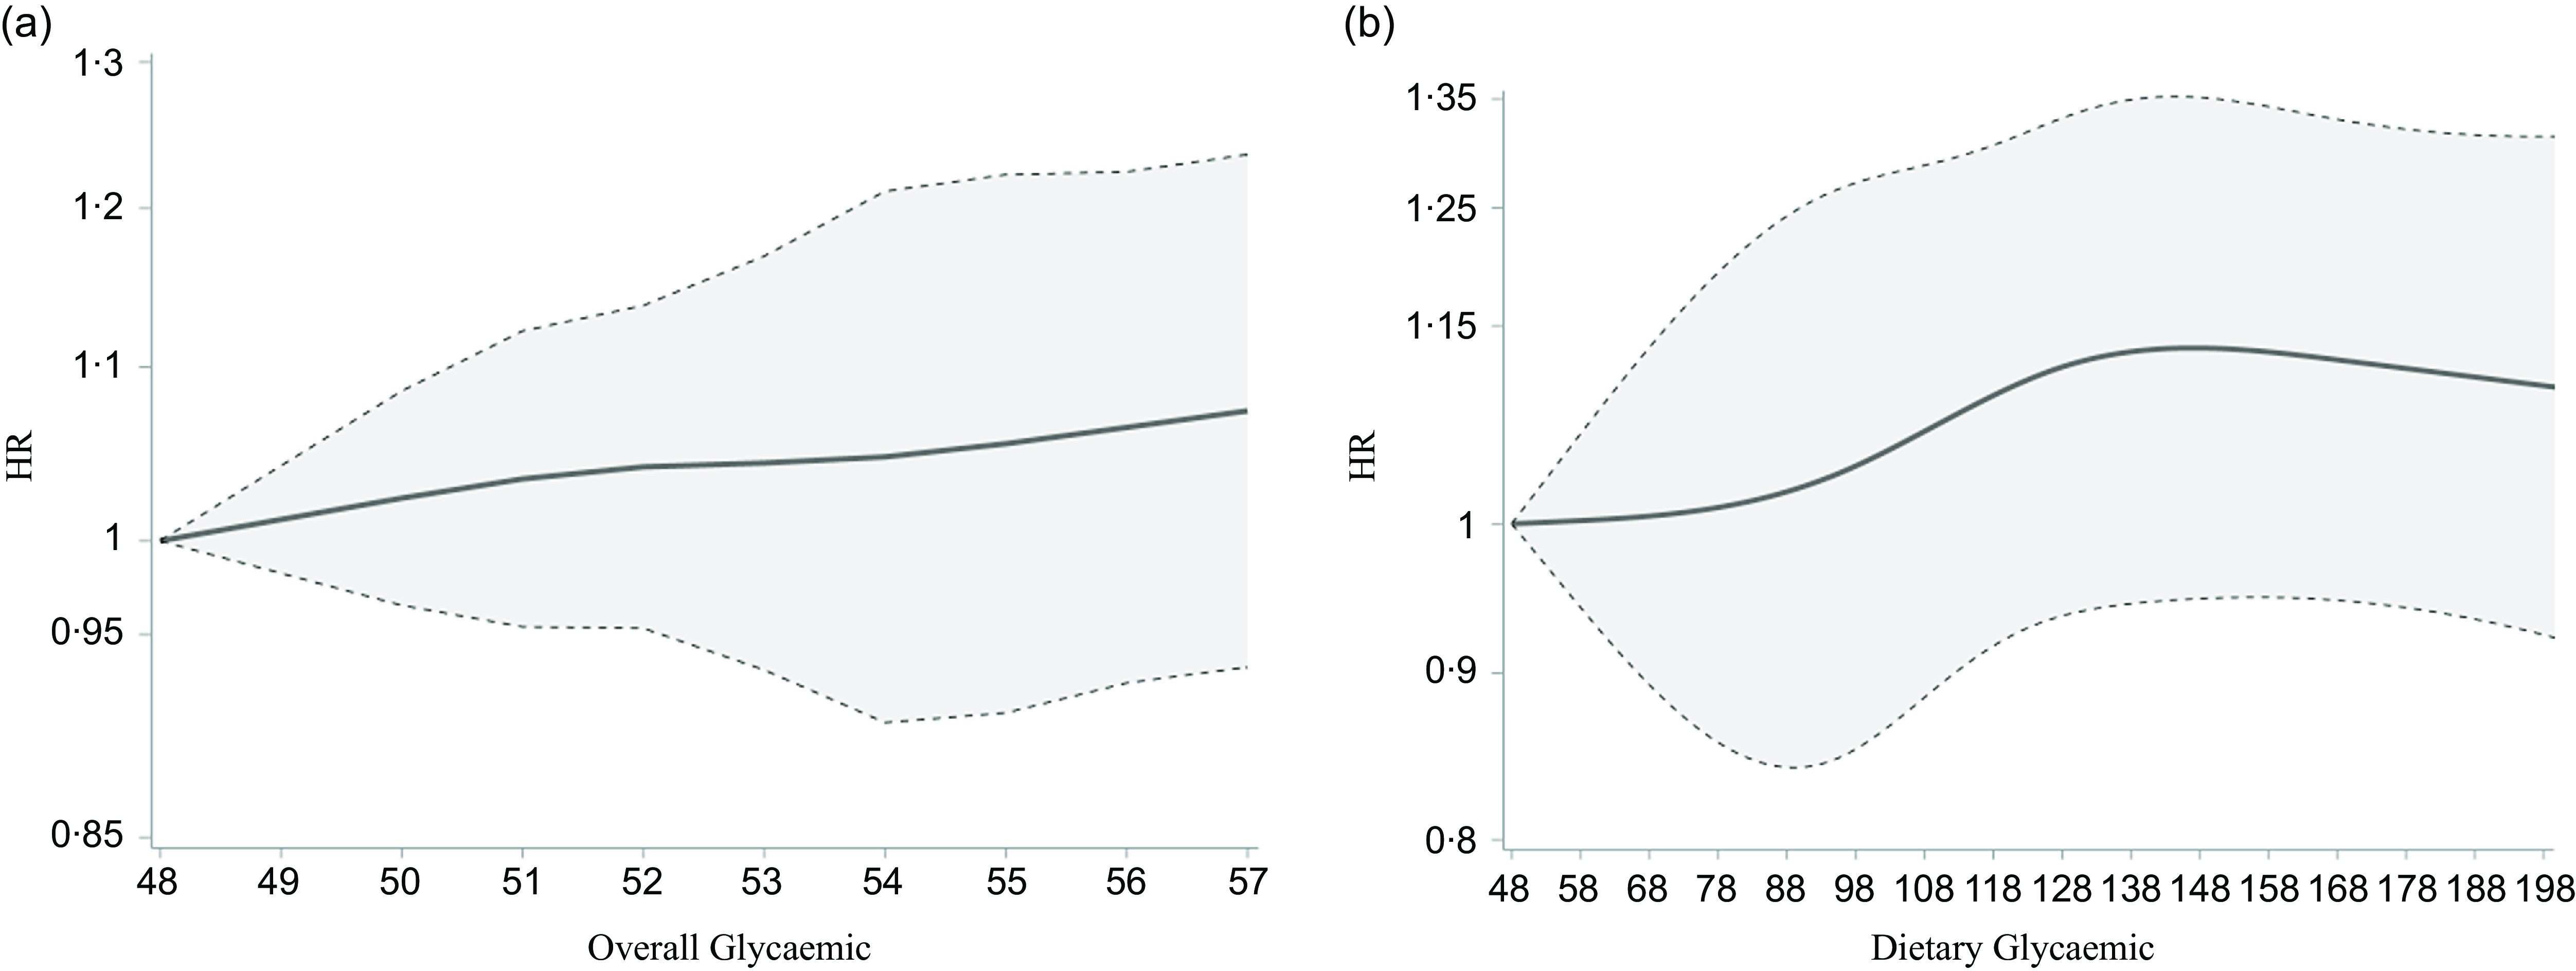
Fig. 1. Restricted cubic spline showed an association between GI and all-cause mortality. We used a Cox proportional hazards regression model with cubic spline functions and smooth curve fitting (penalised spline method) to evaluate the mentioned association. (a) The result showed a slight upward trend in mortality incidence with wide underlying variation. (b) The result showed that the relation appeared to be non-monotonic, but the limited magnitude and the ample variability remained the same.
Higher GI and GL were associated with increased CVD mortality. However, the number of deaths per category of GI and GL was limited and the relation did not appear to be linear. Relative to the lowest quintile, women in the third quintile of GI had a 63 % higher mortality (HR = 1·63; 95 % CI: 1·06, 2·52), yet the corresponding estimate for the fifth quintile was lower (HR = 1·30; 95 % CI: 0·82, 2·08). For GL, the magnitude of the association was stronger beginning in the second quintile (HR = 1·87; 95 % CI: 1·15, 3·03). We observed estimates compatible with a higher risk of breast cancer mortality in women in the fifth quintile of GI relative to women in the lowest category (GI, HR = 2·13, 95 % CI: 1·12, 4·06). GL results were similar (HR = 2·43; 95 % CI: 0·90, 6·59). (Table 3).
Table 3. Hazard ratios (HR) and 95 % confidence intervals (95 % CI) for cause-specific mortality by quintiles (Q) of dietary glycaemic index (GI) and glycaemic load (GL) from the MTC in 86 610 Mexican women (2006–2008)*
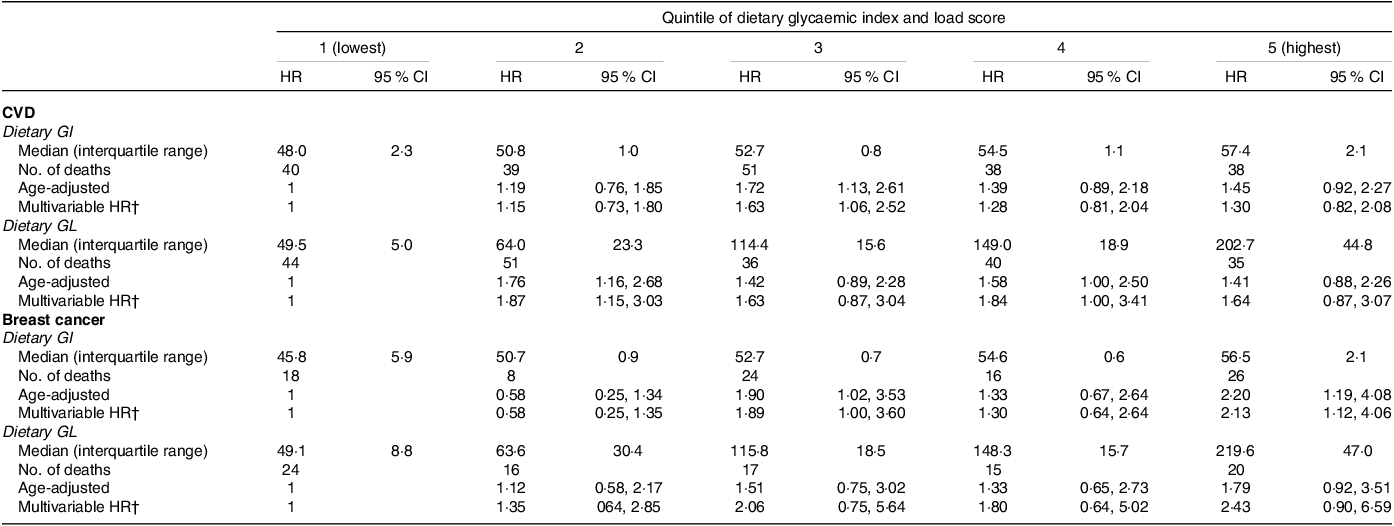
* HRs and 95 % CI estimated from Cox proportional hazard model. The MTC, the Mexican Teachers Cohort.
† Includes the following: age, socioeconomic status, indigenous, age at menarche (≤11 years, ≥12), breastfeeding (nulliparous, < 6 months, ≥ 6 months), menopausal status (premenopausal, postmenopausal, don’t know), family history of hypertension, of diabetes, of heart attack and of breast cancer (no, yes), smoking status (never, ex-smoker, current), total intensity exercise, red meat, and seafood intake (servings/d), and alcohol consumption (excluding beer, servings/week).
Conclusions based on our primary all-cause mortality analyses did not change after the exclusion of alcohol from the GI and GL calculations and adjustment for BMI and total energy intake (online Supplementary Tables S3 and S4). Results became null when an alternative calculation of GI and GL based on seven food categories from the PURE study(Reference Jenkins, Dehghan and Mente11) was used (online Supplementary Table S5). We explored the relation between four major food group contributors to GI and all-cause mortality (fruits, non-carbonated sugar-sweetened beverages, carbonated sugar-sweetened beverages, and corn tortillas) (online Supplementary Table S6). No single food group confers increased mortality. However, relative to the lowest intake category, the estimate for the highest intake of carbonated sugar-sweetened beverages was compatible with increased mortality. Also, women in the second quintile of intake of corn tortillas had a higher mortality than women in the first quintile. Except for socioeconomic status and indigenous ethnicity, the distribution of factors was similar between women included and excluded from the analyses (online Supplementary Table S2).
Discussion
In this large prospective cohort study of women living in Mexico, higher GI and GL may confer only minimal risk for all-cause mortality. However, women with increasing GI and GL appeared to have increased risk of CVD and breast cancer mortality relative to women in the lowest quintiles of these exposures.
Our observations are comparable with the summary estimates for three cohort studies in women(Reference Shahdadian, Saneei and Milajerdi41). For that study, the estimate for overall mortality for comparing the highest to the lowest categories were 1·17 (95 % CI: 1·02, 1·35) for GI and 1·18 (95 % CI: 0·82, 1·69) for GL. While the underlying variability was important, in the current analysis we found the corresponding estimates to show a 12 % higher mortality. Also, in a study of 74 735 women from Shanghai where 10 501 deaths were observed the corresponding estimate for GI was 1·10 (95 % CI: 1·04, 1·16) and for GL 1·03 (95 % CI: 0·93, 1·13)(Reference Zhao, Li and Liu42). Differences in estimates across populations may be due to heterogeneity in the foods that contribute to total carbohydrate intake and in the methods to estimate the exposure. We explored this by excluding fruits from GI and GL in a post hoc analysis and repeating analyses following the GI/GL estimation procedure used in PURE and our conclusions for all-cause mortality did not change.
High-GI meals promote excessive food intake, beta cell dysfunction, dyslipidaemia and endothelial dysfunction, increasing heart disease risk(Reference Ludwig3), and then, CVD mortality. Our analyses were limited because of the number of women who died of CVD in the MTC. Our results are similar in magnitude to observations made in PURE(Reference Jenkins, Dehghan and Mente11). In that study in persons without CVD at baseline, for those in the highest category of GI, CVD was 32 % higher relative to those in the lowest category of GI. In our study, this estimate was 30 %. In contrast, the magnitude of the association between GL and CVD mortality was stronger in our study relative to PURE (1·64 v.1·09 when comparing extreme categories). Interestingly, median overall GI (58 v. 52) and GL (197 v. 111) were higher than what was observed in our study. When we repeated analyses using the same GI values as those used in that study, GI and GL estimates were closer to null.
High-GI foods could also play a role in cancer by inducing inflammation (i.e. increased concentration of inflammatory markers) and raising insulin levels leading to increased insulin-like growth factor-1 (an inductor of cell proliferation/differentiation and inhibitor of apoptosis) and decreased insulin-like growth factor binding protein-3, which usually downregulates insulin-like growth factor I (Reference Murphy, Knuppel and Papadimitriou43). In our study, women with GI and GL categories had higher breast cancer mortality relative to those in the lowest category. Three breast cancer case-control studies in Mexico with population-based controls previously estimated the impact of GI and GL on breast cancer(Reference Amadou, Degoul and Hainaut12–Reference Lajous, Willett and Lazcano-Ponce14). The first study was conducted in the 1990s(Reference Murphy, Knuppel and Papadimitriou43). Women in the highest quartile of dietary GL had an OR of 1·62 (95 % CI: 1·13–2·32) relative to women in the lowest quartile. The magnitude of the association appeared to be stronger among postmenopausal women. No association was found for overall GI. In a larger study conducted a decade later, dietary GI and GL were not associated with breast cancer, even among postmenopausal women(Reference Amadou, Degoul and Hainaut12). The third study, also conducted in the 2000s but in Northern Mexico, showed a direct association between overall GI and breast cancer molecular cancer(Reference Zhao, Li and Liu42). In a meta-analysis that used information from 14 prospective cohorts, the authors concluded that there was low certainty of evidence that GI affected breast cancer incidence(Reference Lajous, Boutron-Ruault and Fabre44). Interestingly, two studies conducted in France that were not included in that analysis found that GI and GL were associated with breast cancer risk(Reference Debras, Chazelas and Srour9,Reference Lajous, Boutron-Ruault and Fabre44) . In addition to differences in the distribution of GI and GL in different populations, heterogeneous results across studies could be due to differences in the quality of dietary assessment and the distribution of breast cancer subtypes.
High- and low-GI foods have been used to assess the impact of carbohydrates on different health outcomes for more than four decades. However, there is an ongoing debate on the appropriateness of GI and GL in nutritional epidemiology. While the use of an indicator of the biological response to food is attractive, the assignment of GI values based on international tables may not reflect blood glucose responses in different populations. In our study, about 50 % of food and dishes (51 items) listed on the FFQ were imputed based on similar foods. We do not know if population-specific variations of these foods may affect our GI and GL estimates. Also, high GI/GL diets may be the result of choices made in the construction of dietary assessment tools and GI values and population-specific dietary patterns. Moreover, detailed descriptions of the strategy to incorporate international GI table values to specific populations are uncommon. In addition, different populations may have varying distributions of GL components. The most important contributors to dietary GL in our study were fruits (22 %), refined grain (11 %), corn tortillas (10 %) and sugar-sweetened beverages (9 %). In contrast, in an European cohort, the largest contributors to GL were bread (31 %), fruit (14 %) and pasta/rice/other grains (8 %)(Reference Turati, Dilis and Rossi45). Finally, there may be barriers for the translation of the meaning of overall GI and dietary GL to the public. Using indicators of dietary quality of foods accessible to the population where public health recommendations are targeted may be more beneficial to encourage healthy choices.
The main strengths of this study include our structured and detailed approach to estimate overall GI and dietary GL, a large sample of women included in the cohort, and a robust mortality follow-up in an understudied population from a middle-income country. However, some limitations need to be considered. First, while we used a validated questionnaire and followed a structured approach to estimate GI and GL, diet was assessed only at one time point. Thus, measurement error due to changes in the exposure may have occurred. While this error is likely to be non-systematic, the impact on effect estimates is difficult to predict. Second, in observational studies confounding is unavoidable and inappropriate adjustment may introduce bias or affect the interpretation of results. We used subject-matter knowledge (articulated using directed acyclic graphs) to guide our choice of variables for adjustment and explicitly articulate our assumptions. Nevertheless, we cannot exclude residual and unmeasured confounding. Third, a limited number of cause-specific deaths affected our capacity to evaluate other causes of mortality. Fourth, our competing risks analysis assumes that times for different event types were independent, or at least, that each event was noninformative for the others. We acknowledge that this assumption is not easily verifiable(Reference Allison46). Finally, the MTC includes only women living in Mexico and results may not be transportable to men and other populations. However, our study is a first approach to understand GI and GL effect in mortality in a middle-income country.
In conclusion, overall GI and dietary GL were associated with all-cause mortality, CVD and breast cancer mortality in a middle-income country. Our results contribute to the evidence base for the recent implementation of measures in Mexico and beyond (i.e. front-of-package labelling) that seek to lower the intake of low-quality foods. This evidence could be further strengthened with analyses using exposures aligned with existing public health interventions (e.g. added sugar warnings) and conducting analyses of incident disease rather than mortality.
Acknowledgements
We thank the services of the MTC study, the contributing research centres delivering data to the MTC and all the study participants. We thank teachers for their participation.
The Mexican Teachers’ Cohort was supported by the American Institute for Cancer Research, the Ministry of Health, the Ministry of Education, the ISSSTE, Avon, and AstraZeneca. The project has also received funding from CONAHCYT through the National Scholarship for Postgraduate Programs.
The authors’ contributions are as follows: M. L., D. S. and A. M.: designed the study; L. P., M. L., D. S. and S. Z. M.: analysed the data; L. G. F. R.: supervised the MTC database to the national mortality database cross-linkage; L. P.: made the figures and drafted the manuscript; J. E. H. A. standardised and supervised the national mortality database cross-linkage. M. L., D. S., S. Z. M., A. M., L. G. F. R. and J. E. H. A.: revised the paper, and all authors read and approved the final manuscript.
The funders had no role in the study design, data collection and analysis decision to publish or manuscript preparation. There is no conflict of interest declared.
Ethics approval
The study was approved by the research, ethics and biosecurity commissions of the National Institute of Public Health of Mexico (CI1364).
Data availability
Data described in the manuscript and analytic code will not be made available because data are not publicly available. Researchers can apply to use the MTC data used in this study. More information about the MTC data and conditions of use can be found on their website (https://esmaestras.org).
Supplementary material
For supplementary material/s referred to in this article, please visit https://doi.org/10.1017/S0007114524001569


