During 1987, a diet restriction study of domestic dogs (Canis lupus familiaris) was initiated with a hypothesis that 25 % diet restriction would decrease hip joint laxity and osteoarthritis (OA) in a dog breed that is genetically susceptible to obesity and OA(Reference Kealy, Olsson, Monti, Lawler, Biery, Helms, Lust and Smith1).
At 24 months, the experiment was extended for the lifetimes of the dogs. The original experimental design was continued with the added hypothesis that 25 % diet restriction (DR) for lifetime would result in increased longevity and improved overall health of DR dogs, compared to pair-mate control-fed (CF) dogs. The last dog died in mid-2001, at age 14·5 years. The database of physiological observations from this study is large and diverse, and earlier communications have occurred over an elapsed time of about 15 years. This report reviews the key findings of the second decade of this work and presents our view of the most important inter-species comparative observations.
Overview of general methods
Study design
Labrador retrievers (n 48) were paired at age 6 weeks by sex and body weight within each of seven litters, and then were assigned randomly within the pair to CF or 25 % DR. Beginning at age 8 weeks, each CF dog was given the dry, extruded diet ad libitum, and each DR pair-mate was given 75 % of the amount of food that its CF pair-mate had consumed the previous day. Each feeding group was given the same diet; only the quantity offered differed between the CF and DR feeding groups(Reference Kealy, Olsson, Monti, Lawler, Biery, Helms, Lust and Smith1). Animal care and experimental procedures were approved by the Institutional Animal Care and Use Committee.
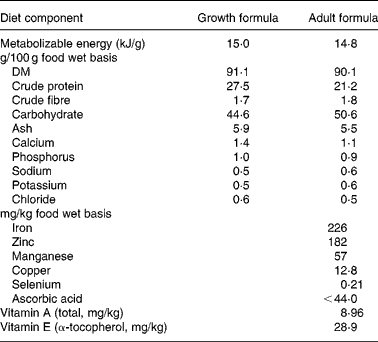
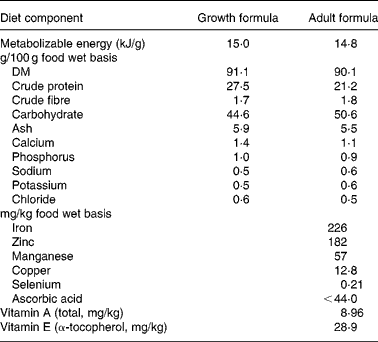
When the dogs were age 3·25 years, two adjustments were made to the feeding protocol. All dogs were switched from a growth formula diet (27 % protein) to an adult formula diet (21 % protein) (Table 1), and the amount of food given to CF dogs was held constant to prevent development of serious obesity in all of the dogs. These adjustments were necessary because most domestic dogs do not self-regulate food intake to energy needs, and the Labrador retriever further has a breed-based susceptibility to obesity. To accomplish these modifications, the amount fed to the twenty-four CF dogs was calculated by establishing an ideal body weight for each CF dog, based on skeletal size and referenced to other dogs of the same breed. These metrics were established independently by three animal technicians who were trained and experienced with body condition and size scoring of dogs, with the resulting estimate being the average of those evaluations. These CF dogs then were fed 0·62 kJ metabolizable energy (ME)/g of estimated ideal body weight (RD Kealy, unpublished results), the pre-established daily energy requirement of large breed dogs. The twenty-four DR dogs continued to receive 25 % less than the amount of food consumed by respective pair-mates on the previous day(Reference Kealy, Lawler, Ballam, Lust, Smith, Biery and Olsson2). When a CF dog developed prolonged loss of appetite associated with a chronic illness, the limit-fed pair-mate was maintained at the mean level of daily food intake that it had been receiving over several weeks prior to development of anorexia in the CF pair-mate. The same procedure was used to feed surviving DR pair-mates of deceased CF dogs. Absent of defined and uniform means to address these issues with longer-lived species, a long-term study of this nature would become a confounded series of observations of degrees of obesity, and not a study of DR.
Table 1 Proximate analysis of diets fed to control and diet-restricted dogs
All dogs were monitored daily throughout life for signs of disease. Therapeutic measures were governed by protocols established for the entire colony (average about 1000 dogs) of which these forty-eight dogs were a part. The dates when it became necessary to begin a treatment for a chronic disease were recorded for each dog. Of the forty-eight dogs, forty-six eventually were euthanized for humane reasons, and two dogs died spontaneously. Euthanasia was carried out only after extensive diagnostic evaluation, careful monitoring and assessment of response to treatments, serial evaluation of clinical condition, and consideration of prognosis. These end-of-life practices were pre-established for the entire colony that included these dogs(Reference Kealy, Lawler, Ballam, Mantz, Biery, Greeley, Lust, Segre, Smith and Stowe3).
Data collection
Data collection included the following general categories: food intake, body weight and body condition score (body condition score chart; Ralston Purina Company, St Louis, MO, USA), body composition (dual-energy X-ray absorptiometry), haematology, serum and urine clinical chemistry, serum thyroid and parathyroid metabolism, blood acid–base chemistry, glucose–insulin metabolism, bone metabolism, immune function, oxidative metabolism, orthopaedic evaluation and multiple joint radiography, cardiology (indirect blood pressure, electrocardiography, ultrasound), physical examination, clinical illnesses and post-mortem evaluation. Most data collection was scheduled to coincide with birth anniversaries.
Primary observations
Life span
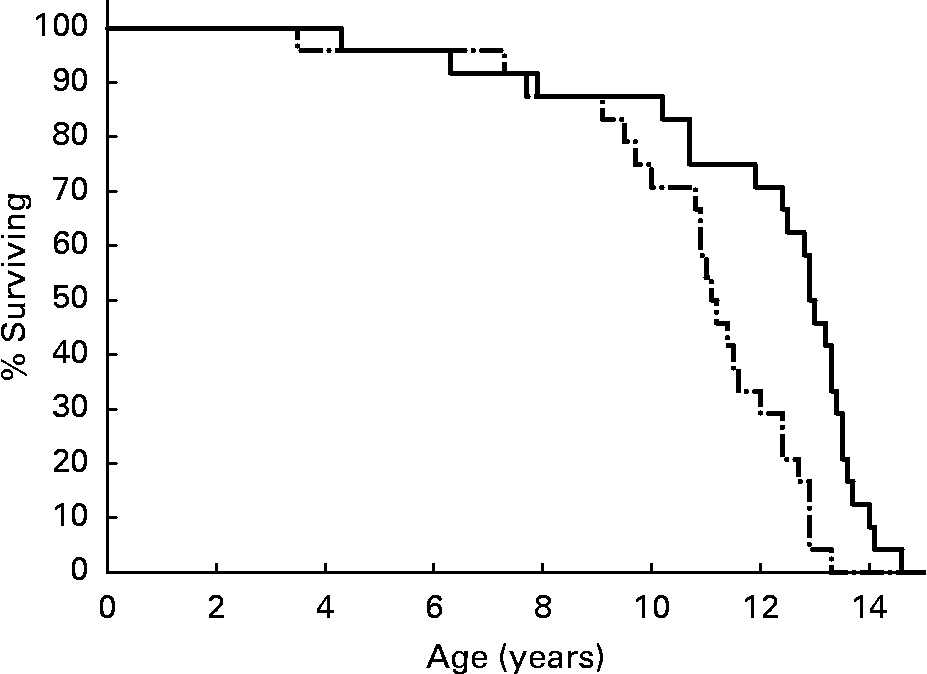
Median life span among DR dogs was 13·0 years, compared to 11·2 years among CF dogs(Reference Kealy, Lawler, Ballam, Mantz, Biery, Greeley, Lust, Segre, Smith and Stowe3) (Fig. 1). Statistical significance for maximum life span is difficult to establish for last deciles as small as 2·4 individuals per group. However, data analysis by continuity-adjusted χ2 test showed that maximum life span was significantly different between the CF and DR groups over ages 11·5–14·0 years, by which time the remaining population consisted of only two DR dogs(Reference Lawler, Evans, Larson, Spitznagel, Ellersieck and Kealy4). Nine DR dogs (37·5 %) remained alive at the time that all CF dogs had died. The life span findings were consistent with those of DR studies of numerous vertebrate and invertebrate species.
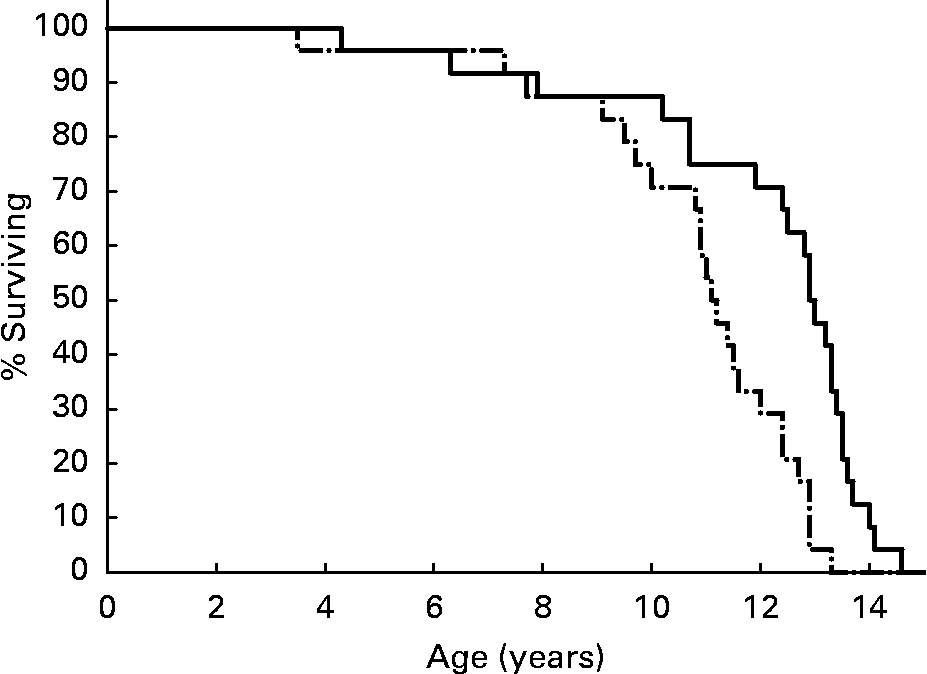
Fig. 1 Survival curves for diet-restricted (—) and control (–·–) feeding groups. Kealy et al., J Am Vet Med Assoc 220, 1315–1320, 2002. Reprinted with permission.
Body weight and body condition scoring
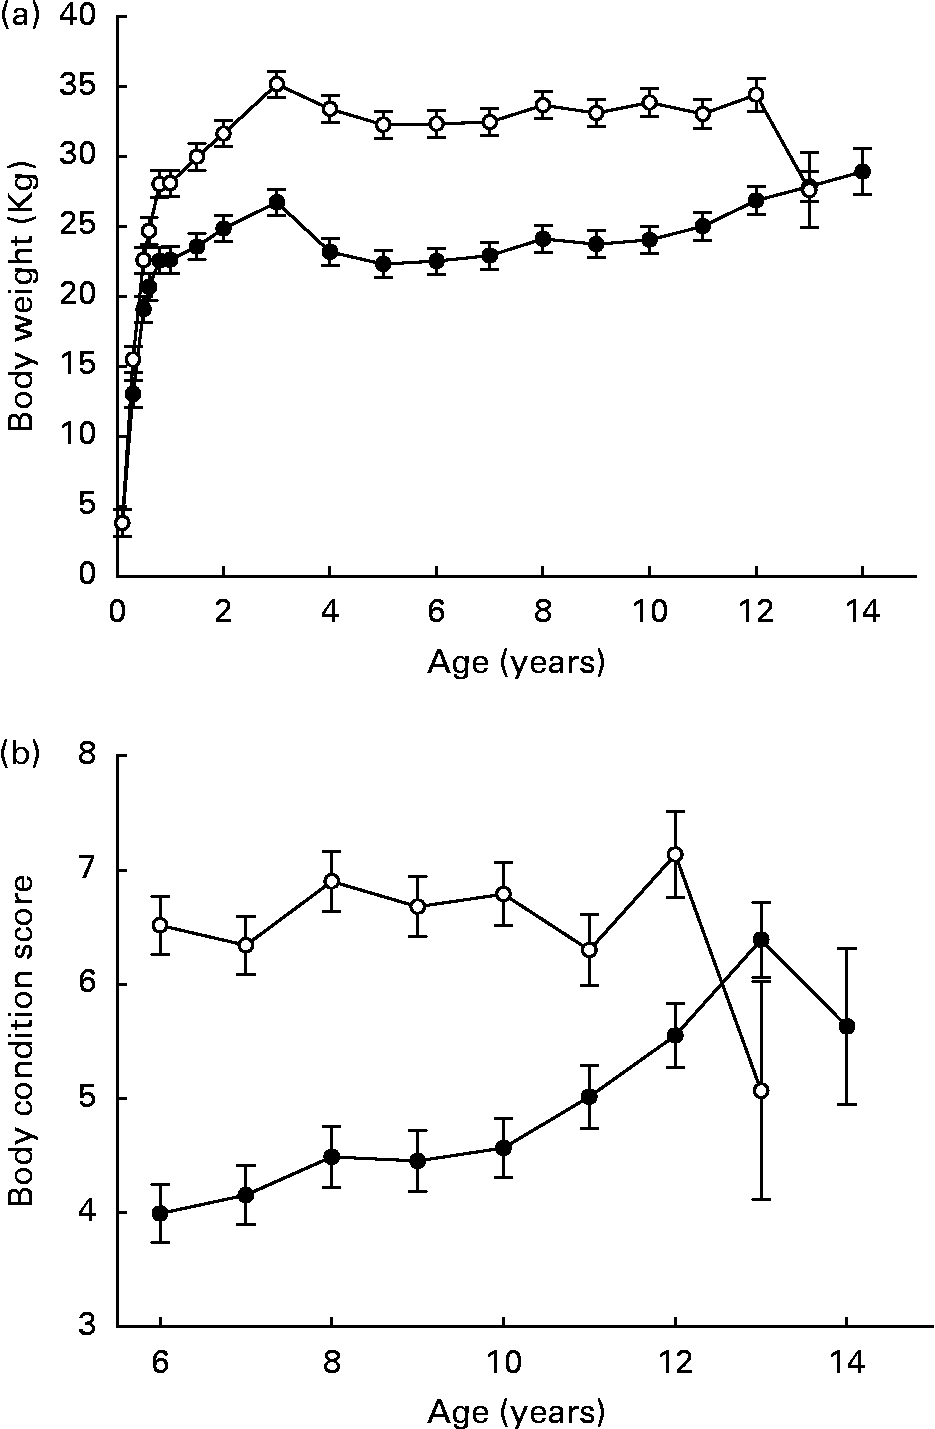
Pair-wise comparisons indicated that weight gained by DR dogs over ages 8–30 weeks ranged between 70·8 and 89·6 % of respective CF pair-mates. Over ages 8–104 weeks, weight gained by DR dogs ranged between 53·0 and 95·9 % of respective CF pair-mates(Reference Kealy, Olsson, Monti, Lawler, Biery, Helms, Lust and Smith1). Mean adult body weights of DR dogs did approximate 75 % of those in the CF group, over the lifetimes of the dogs, in parallel to food intake(Reference Kealy, Lawler, Ballam, Mantz, Biery, Greeley, Lust, Segre, Smith and Stowe3) (Fig. 2 (a)). The variability among individuals demonstrates the wide normal variation in canine metabolizable energy requirement (MER; RD Kealy, unpublished results). Mean body condition score was 6·7 (se 0·19) in the CF group and 4·6 (se 0·19) in the DR group, over ages 6–12 years(Reference Kealy, Lawler, Ballam, Mantz, Biery, Greeley, Lust, Segre, Smith and Stowe3) (Fig. 2 (b)). In a study of Wistar rats, body weight affected longevity independent of DR(Reference Wang, Weindruch, Fernandez, Coffey, Patel and Allison5). Although experimentally structured comparative data for the dog are not available, it is well known that smaller breeds of dogs generally have longer mean life spans than larger breeds. Thus, mechanisms that might underlie the DR longevity response cannot be inferred from body weight alone. Possibly, wide individual variability in MER in dogs accounts for the observed species difference.
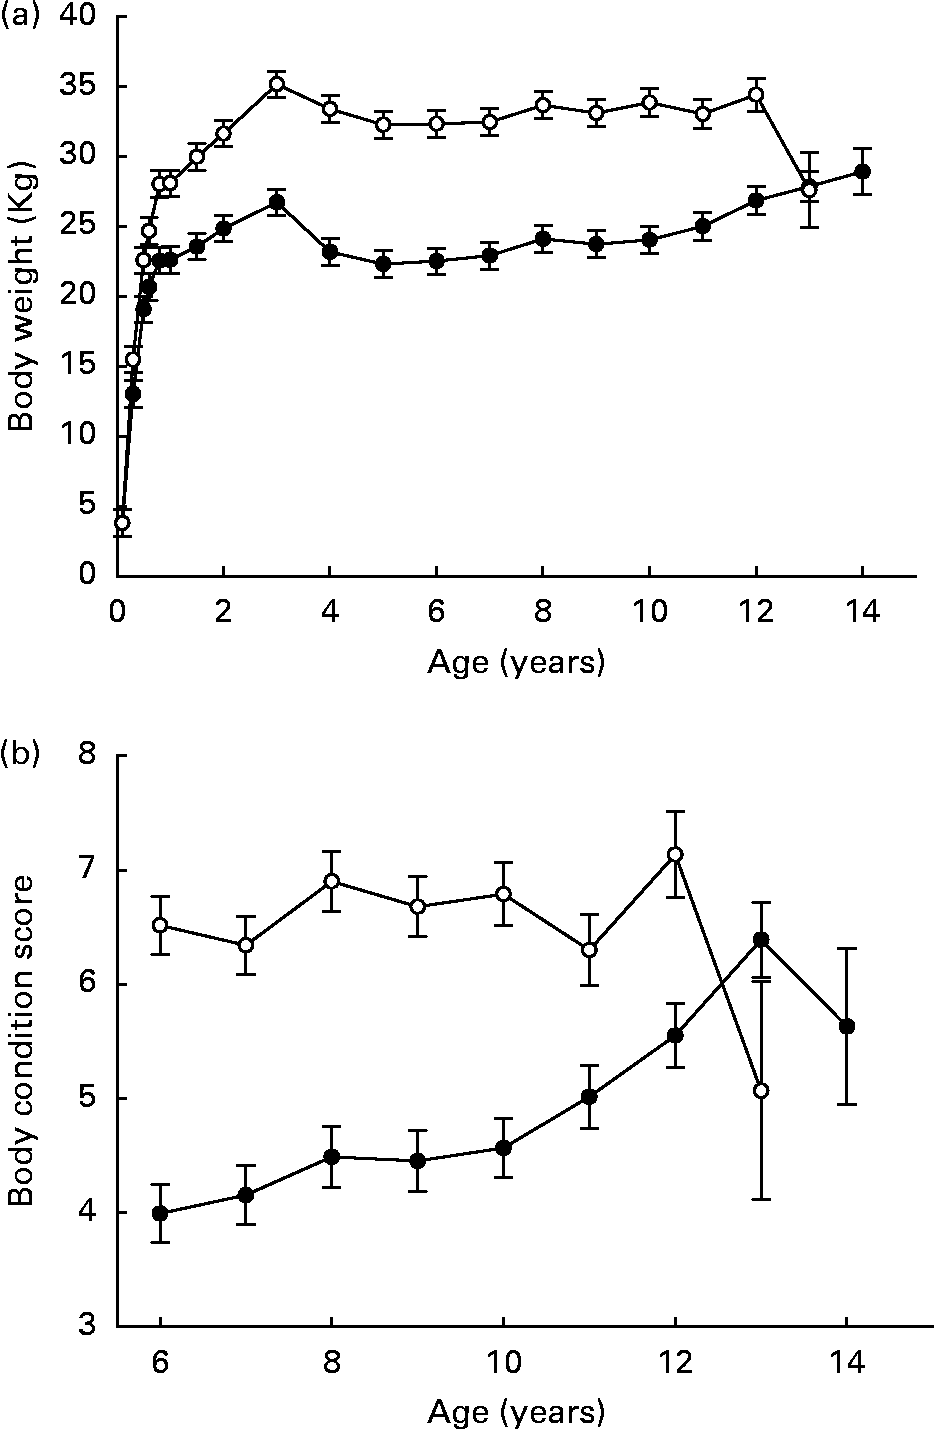
Fig. 2 Body weights (a) and body condition scores (b) of diet-restricted (●) and control-fed (○) dogs. Values are means with their standard errors depicted by vertical bars. Kealy et al., J Am Vet Med Assoc 220, 1315–1320, 2002. Reprinted with permission.
Body composition
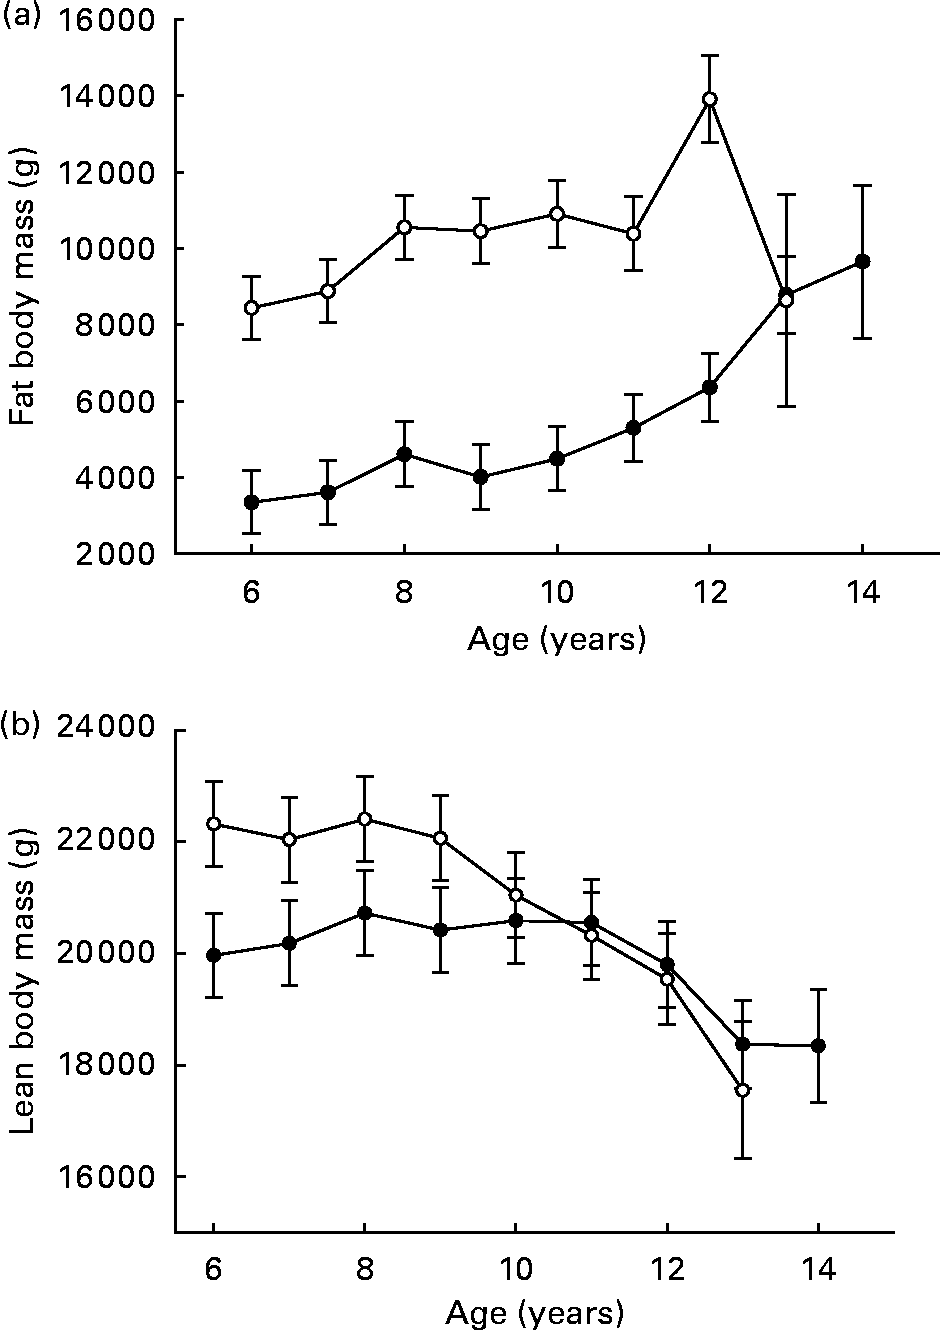
Over ages 6–9 years, fat body mass was high and tended to be more constant among CF dogs, compared to a lower but slightly increasing mean among DR dogs(Reference Kealy, Lawler, Ballam, Mantz, Biery, Greeley, Lust, Segre, Smith and Stowe3) (Fig. 3 (a)). Recognition that body fat produces biologically active molecules suggests possible underlying mechanisms for an interaction between increased fat mass and reduced longevity(Reference Barzilai and Bupta6). Other investigators, however, have reported data suggesting that reduced energy intake is a primary factor in the DR longevity response, as opposed to degree of adiposity(Reference Harrison, Archer and Astle7); the role of species differences in this relationship is not yet clear.
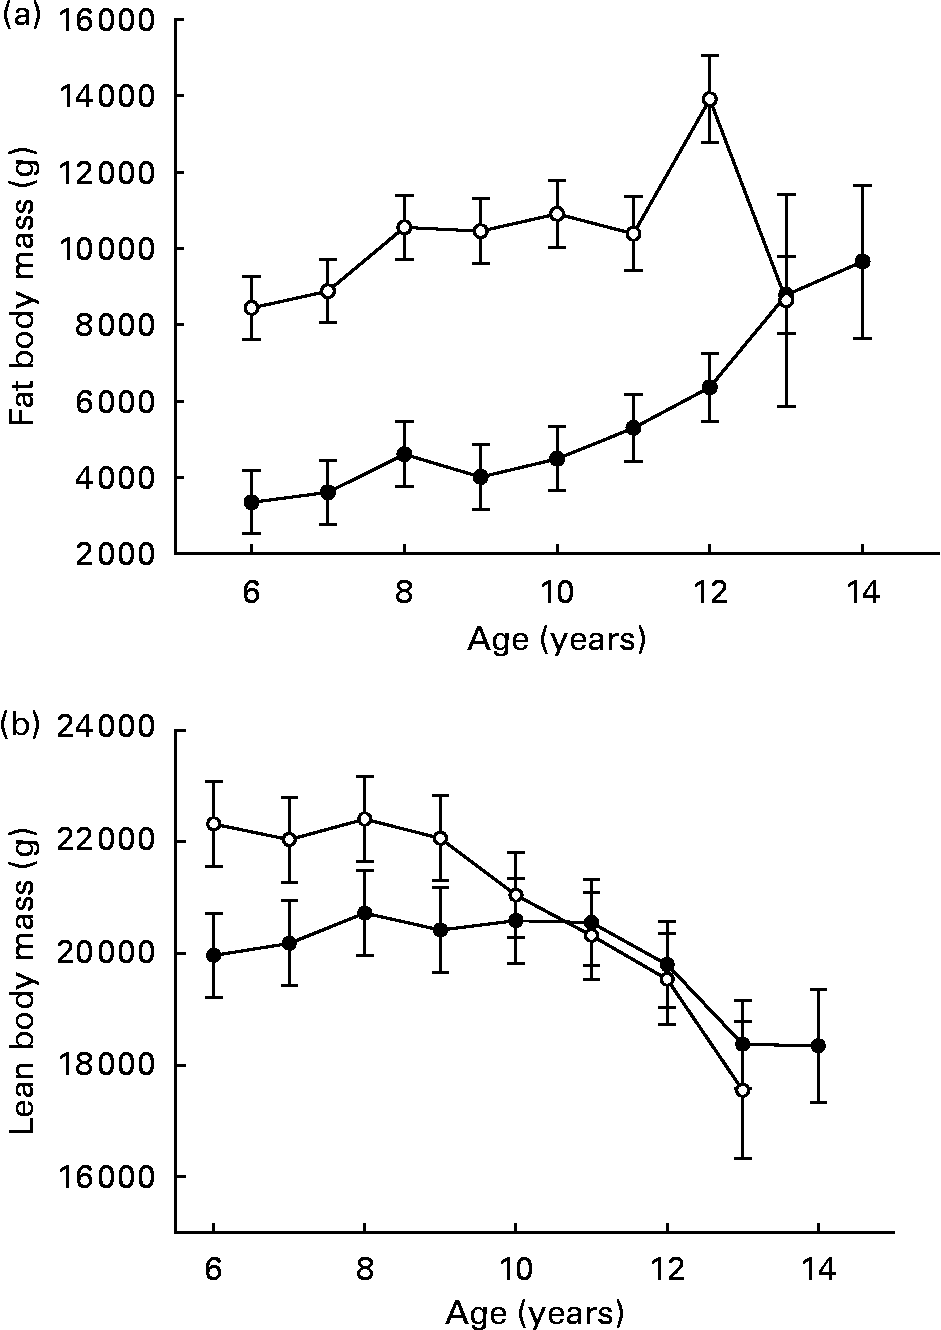
Fig. 3 Fat body composition (a) and lean body composition (b) of diet-restricted (●) and control-fed (○) dogs. Values are means with their standard errors depicted by vertical bars. Kealy et al., J Am Vet Med Assoc 220, 1315–1320, 2002. Reprinted with permission.
Over ages 6–9 years, mean lean body mass was constant within each group and was greater in the CF group as a consequence of greater total body weight (Fig. 3 (b)), although lean body mass always represented a greater percentage of total body composition in the DR group. In the CF group, progressively declining lean body mass was observed after the ninth year, whereas the same trend was not observed among DR dogs until after the eleventh year(Reference Kealy, Lawler, Ballam, Mantz, Biery, Greeley, Lust, Segre, Smith and Stowe3).
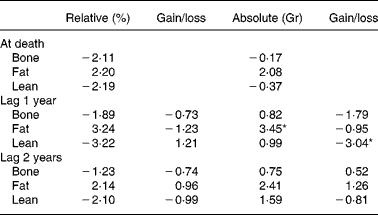
Proportional hazards analysis of body composition data (across feeding groups) from dual-energy X-ray absorptiometry showed that high static fat mass and declining lean mass both strongly predicted death at 1 year prior, as denoted by higher Z-values for high fat mass and for declining lean mass at this time interval(Reference Kealy, Lawler, Ballam, Mantz, Biery, Greeley, Lust, Segre, Smith and Stowe3) (Table 2). Within dog, however, there was no correlation (r − 0·08) between lean and fat grams, suggesting that underlying driving mechanisms for the association between body composition components and the DR longevity response may be multiple and may be driven independently(Reference Larson, Lawler, Spitznagel and Kealy8).
Table 2 Z-values from Cox regression model for body composition and prediction of time of death
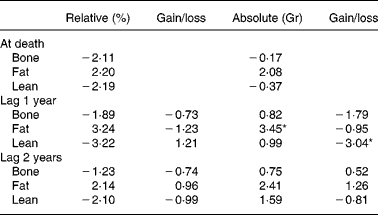
* Higher Z-values denote strongest predictivity.
Late life trends in body composition also have been reported from rodent studies. In male Sprague–Dawley rats, investigators observed that lean mass tended to be relatively constant into senescence(Reference Lesser, Deutsch and Markofsky9, Reference Lesser, Deutsch and Markofsky10). A life span DR study of male F344 rats also demonstrated no progressive decline of lean mass during advanced life, until after the onset of terminal diseases in the population(Reference Yu, Masoro, Murata, Bertrand and Lynd11). The longer advance prediction of death by lean mass loss in dogs, compared with the post-disease lean mass loss observed in rodent populations, may represent phenotypes that are associated with the shorter rodent life span, compared to the longer canine life span. In elderly man, precipitous unintentional weight loss consistently associates with terminal outcome(Reference Pamuk, Williamson, Serdula, Madans and Byers12, Reference Wallace and Schwartz13) independent of chronic disease(Reference Pamuk, Williamson, Serdula, Madans and Byers12, Reference Bales and Ritchie14).
Despite obvious differences that may relate to life span or physiological variability among species, there are clearly recognizable similarities in the relationship of lean mass decline to the death trajectory (pre-death changes). Loss of skeletal muscle can occur secondary to loss of motor neurons, inactivity, endocrinopathy, anorexia, reduced protein synthesis and effects of inflammatory mediators(Reference Doherty15). All of these factors can contribute to cachexia and can be associated with initiating the death trajectory, suggesting that final common pathways may link changing gene expression to cachexia phenotypes. The ubiquitin pathway in skeletal muscle is one possible candidate for a common pathway(Reference Caso and Garlick16). The observation that more systemic phenomena such as acid–base balance may play an indirect, supervising role(Reference Caso and Garlick16) also supports an argument for genetic programming of ageing responses, perhaps even to the point of mediating the death trajectory.
Studies of man and Drosophila suggest that longevity is moderately heritable at best, and suggest also that gene–environment interactions exert important indirect influences, independent of specific causes of death(Reference Roff and Mousseau17, Reference Herskind, McGue, Holm, Thorkild, Sorensen, Harvald and Vaupel18). While fundamental mechanisms of DR relationships to gene–environment interactions are not fully elucidated, understanding DR as simple weight management is to ignore a multitude of metabolic effects that extend well beyond the modern but more narrow idea of obesity control.
Insulin–glucose metabolism
DR mammals have been observed to be more insulin sensitive than CF counterparts(Reference Bodkin, Metzger and Hansen19–Reference Gresl, Colman, Roecker, Havighurst, Huang, Allison, Bergman and Kemnitz22). Loss of insulin sensitivity is an indication of defective glucose regulation(Reference Bergman23), the consequences of which have been readily apparent in mammalian studies. For example, compared to DR primates, CF primates had hyperinsulinaemia and a 3·7-fold increased risk of death (i.e. greater risk for earlier death)(Reference Bodkin, Alexander, Ortmeyer, Johnson and Hansen24).
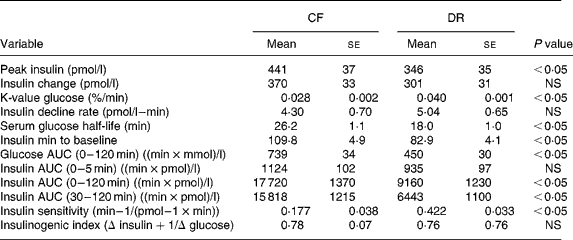
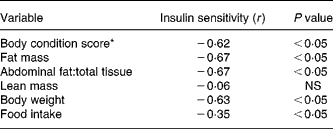
Intravenous glucose tolerance tests were done on all CF and DR dogs at birth anniversaries over ages 9–12 years (Table 3). The results showed that insulin sensitivity, calculated by the simplified method of Galvin et al. (Reference Galvin, Ward, Walters, Pestell, Koschmann, Vaag, Martin, Best and Alford25), was 58 % greater among DR dogs on a whole-body weight basis, and 147 % greater on a lean body mass basis. Easily accessed serum markers such as basal glucose and insulin were, respectively, 7 and 32 % lower among DR dogs. Insulin–glucose variables correlated better to factors that reflect fat mass, compared to lean mass(Reference Larson, Lawler, Spitznagel and Kealy8) (Table 4). Using three minimal models in primate studies, investigators also showed that differences in insulin sensitivity between CF and DR monkeys were influenced by differences in body fat(Reference Gresl, Colman, Roecker, Havighurst, Huang, Allison, Bergman and Kemnitz22). These findings are interesting in light of the poor correlation between fat grams and lean grams within dog(Reference Larson, Lawler, Spitznagel and Kealy8), and the fact that high static fat mass and declining lean mass both were strong mortality predictors(Reference Kealy, Lawler, Ballam, Mantz, Biery, Greeley, Lust, Segre, Smith and Stowe3). The observations underscore the complexity of the DR health and longevity response, and again suggest that the underlying biochemical mechanisms are likely to be multiple, with both independent and interactive components.
Table 3 Insulin and glucose response to intravenous glucose challenge of 9–12-year control-fed (CF) and diet-restricted (DR) Labrador retriever dogs (from Larson et al. (Reference Larson, Lawler, Spitznagel and Kealy8))
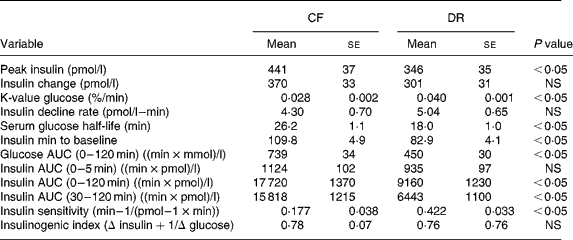
AUC, area under the curve.
Table 4 Selected Spearman rank-order correlations to insulin sensitivity
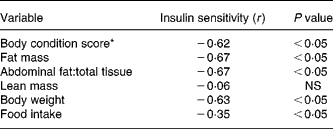
* Range 1 (very thin) to 9 (very obese).
Basal glucose in advanced age decreased more in DR dogs than in CF dogs, whereas basal glucose generally increases with age in DR animals. Therefore, ageing relationships between insulin and glucose may have some aspects that are unique to the domestic dog(Reference Larson, Lawler, Spitznagel and Kealy8). It is interesting in this respect that the dog is the first member of order Carnivora to be studied in a DR paradigm, and it is possible that phylogenetic background is reflected in some aspects of metabolic responses to DR. Further studies would be required to confirm or reject this hypothesis, but the data do suggest that caution should be exercised with interspecies data comparisons and interpretations.
Threshold effects have been observed for the correlation of increasing body fat to increasing insulin resistance(Reference Bogardus, Lillia, Mott, Hollenbeck and Reaven26, Reference Bodkin, Hannah, Ortmeyer and Hansen27). The suggested threshold is 22 % body fat in monkeys and between 20 and 25 % body fat in dogs(Reference Larson, Lawler, Spitznagel and Kealy8). In the present study, increasing insulin resistance was associated with a greater risk for onset of treatment for a chronic disease(Reference Larson, Lawler, Spitznagel and Kealy8). Since genes that are associated with insulin metabolism appear to function in phylogenetically conserved stress-response roles, it has been suggested that stress-response genes could represent one of the important underlying mechanisms by which DR influences longevity(Reference Sinclair28). This idea represents a fascinating area for further investigation.
Energy metabolism
The adult diet that was fed to the dogs contained 14·8 MJ ME/kg food. Intake of CF dogs was fixed at 0·26 MJ ME/kg estimated ideal body weight, while DR dogs were fed 25 % less than that consumed by respective CF pair-mates. Average ME intake per dog was calculated, using diet intake and in vivo energy digestibility estimates(Reference Kienzle, Opitz, Earle, Smith, Maskell and Iben29). Overall, ME intake was 21 % greater for CF dogs compared to DR dogs (6·527 v. 5·151 MJ/d, respectively). Daily intake of ME decreased with age in CF dogs, but increased with age in DR dogs. This observation may have resulted from earlier death of many of the CF dogs, compared to DR counterparts, which resulted in averaged and subsequently stable food intake by DR dogs. Another potential contributing factor was the long delay in the onset of diseases of late life, which resulted in better quality of late life, and thus more stable appetite among the DR group(Reference Larson, Lawler, Spitznagel and Kealy8).
The mean MER, expressed based on total body weight, metabolic body weight or lean body mass, was 8 % lower (0·200 v. 0·216 MJ/kg body weight), similar (0·477 v. 0·476 MJ/kg metabolic body weight) or 17 % higher (0·307 v. 0·255 MJ/kg lean body mass), respectively, for CF v. DR dog. Therefore, among these three common methods of expressing ME intake (MER per body weight, metabolic body weight and lean body mass), only MER/lean body mass explained the observed metabolic energy changes due to diet restriction. DR dogs required 17 % less energy to maintain 1 kg lean tissue than CF dogs(Reference Larson, Lawler and Kealy30).
The mechanisms by which DR relates to energy metabolism are not understood entirely. In a longitudinal study of male F344 rats, DR consistently resulted in basal plasma glucose and insulin levels about 15 and 50 %, respectively, below CF rats. However, the rate of glucose fuel utilization based on metabolic mass did not differ between DR and CF groups, suggesting that the DR response might not be associated directly with reduced metabolic rate(Reference Masoro, McCarter and Katz31). By contrast, a study of primates, which also exhibited reduced plasma glucose and insulin in response to DR, indicated that total daily energy expenditure, based on total body mass or lean body mass, was lower in the DR monkeys(Reference DeLany, Hansen, Bodkin, Hannah and Bray32). It is possible that there are species-related differences in the metabolic responses to DR, as suggested also by the greater rate of plasma insulin decline in older DR dogs, compared to older DR animals of other species(Reference Larson, Lawler, Spitznagel and Kealy8).
Metabolic studies based on NMR (metabonomics) of urine samples taken at birth anniversaries were used to construct life trajectories for each dog. Urine metabolites related to energy, such as creatine, succinate, lactate, acetate and 1-methylnicotinamide, were consistently lower in DR dogs. In addition, both ageing and DR altered urine excretion of aromatics and aliphatic amines, suggesting that ageing and DR both alter gut microbiota numbers or metabolism(Reference Wang, Lawler, Larson, Ramadan, Kochhar, Holmes and Nicholson33). A signalling role for microbiota is conceptually compatible with an underlying role in mediating a variety of systemic responses to DR, although additional research is necessary to confirm and elucidate the exact nature and pathways of signalling mechanisms, and any role in the DR response. Nonetheless, the observation that only 25 % restricted intake of the same diet in genetically similar individuals can result in detectably different microbiota signals in urine is fascinating, considering the co-evolution of species with microflora.
Immunological responses
To assess the influence of age and sex on the canine immune system, a battery of immunological tests were conducted over ages 4–11 years (70 % of median life span), including total leucocytes and lymphocyte subsets, lymphocyte proliferation, natural killer cell activity and neutrophil phagocytosis(Reference Greeley, Ballam, Harrison, Kealy, Lawler and Segre34). In both sexes, there were age-related declines in total lymphocytes, T-cells, CD4- and CD8-cells and lymphoproliferative responses. In females, B-cell percentages declined with age while T-cell percentages increased. CD4- and CD8-cell percentages ultimately were stable after early- to mid-life significant increases in CD8 cell percentages in females. Males tended to have higher natural killer cell activity. Phagocytic activity of neutrophils was not influenced chronologically. The present findings corroborated previously published cross-sectional ageing data in the same breed, from the same colony(Reference Greeley, Kealy, Ballam, Lawler and Segre35).
Compared to CF dogs, the DR group had a significantly slower age-related rate of decline in lymphoproliferative responses to mitogens, although age-related declines occurred in both groups. DR dogs had lower B-lymphocyte counts, although it is not clear that the difference held clinical implications. DR had a significant effect on the age-related decline in numbers of total lymphocytes, T-cells, and CD4 and CD8 subsets (age × diet). For total lymphocytes, T-cells and CD8 cells, CF dogs had significant declines over time, whereas DR dogs did not. For CD4 cells, age-related declines were observed in both groups, with CF dogs experiencing the greater magnitude in rate of decline. Total leucocyte, natural killer cell, neutrophil counts and neutrophil phagocytic capacity were unaffected by age or diet(Reference Greeley, Spitznagel, Lawler, Kealy and Segre36).
Relationships of immune variables to survival were examined using Cox proportional hazards modelling. Independent of feeding group, increased hazard of earlier death was associated with lower lymphoproliferative responses to phytohaemagglutinin, concanavalin A and pokeweed mitogen; lower total lymphocytes, T-cells, CD4 and CD8 cells; lower CD8 percentages and higher B-cell percentages. When diet group was taken into account, pokeweed mitogen responses and cell counts and percentages remained predictive of earlier death. Beneficial effects on lymphocyte proliferative responses tended to be more evident in females, although it should be noted that, by the end of the study, most females had ovariohysterectomy to correct disorders of the reproductive system (or to maintain the balance of the experimental design, in the case of pair-mates)(Reference Greeley, Spitznagel, Lawler, Kealy and Segre36).
DR literature contains numerous studies of effects on immunity. In one interesting group of studies using mice, DR inhibited the age-related decline in antigen presentation and T-cell proliferation, and reduced the decline in antibody production in response to Influenza-A virus. These data suggested that multiple protective mechanisms might be involved in the response(Reference Effros, Walford, Weindruch and Mitcheltree37).
The outcomes of immunological studies of DR in the dog are generally compatible with previously recognized outcomes in DR studies of rodents and primates, where favourable modulation of immune responses has been demonstrated(Reference Riley-Roberts, Turner, Evans and Merry38–Reference Nikolich-Zugich and Messaoudi41). A survival hazard that is shared among man, mice and dogs is a diminished capacity of lymphocyte proliferative response to concanavalin A(Reference Greeley, Spitznagel, Lawler, Kealy and Segre36). Overall, the comparable immune responses to DR across species add strength to the hypothesis that modulation of immune capacity (another stress response) is at least a part of the complex longevity response to DR.
Antioxidant responses
Cumulative effects of oxidative damage to metabolic pathways, cells and tissues are considered to be important components of ageing that are modulated favourably by DR. However, the mechanisms and relative importance of the contributions to the longevity effect are not understood fully(Reference Merry42).
Antioxidant status of CF and DR Labrador retrievers was assessed as a part of the database for the life span study, annually between years 5 and 10, using serum (retinal, retinyl palmitate, total vitamin A, vitamin E, selenium, copper and ceruloplasmin); plasma (ascorbic acid, uric acid and total peroxyl-radical trapping activity); or whole blood (glutathione peroxidase)(Reference Stowe, Lawler and Kealy43).
DR was associated with lower serum retinal, vitamin E, copper and ceruloplasmin. Ageing was associated with lower serum retinyl palmitate, vitamin A, vitamin E, selenium and copper, and with increased serum retinol, ceruloplasmin and blood glutathione peroxidase. Females (mostly ovariohysterectomized by year 10) had lower retinyl palmitate, vitamin A, copper and ceruloplasmin than males. There were litter effects for vitamin E, copper, uric acid and glutathione peroxidase. DR effects on retinal and copper suggest that they are not regulated as closely by liver storage as in most other species(Reference Stowe, Lawler and Kealy43). Additionally, because the implications of antioxidant assays are not explored well in physiological fluids of the dog, the possibility that daily food intake levels may influence outcomes of at least some of these variables should be considered, pending further research. Thus, caution with interpretation is indicated at this time.
Protein and lipid status: clinical chemistry
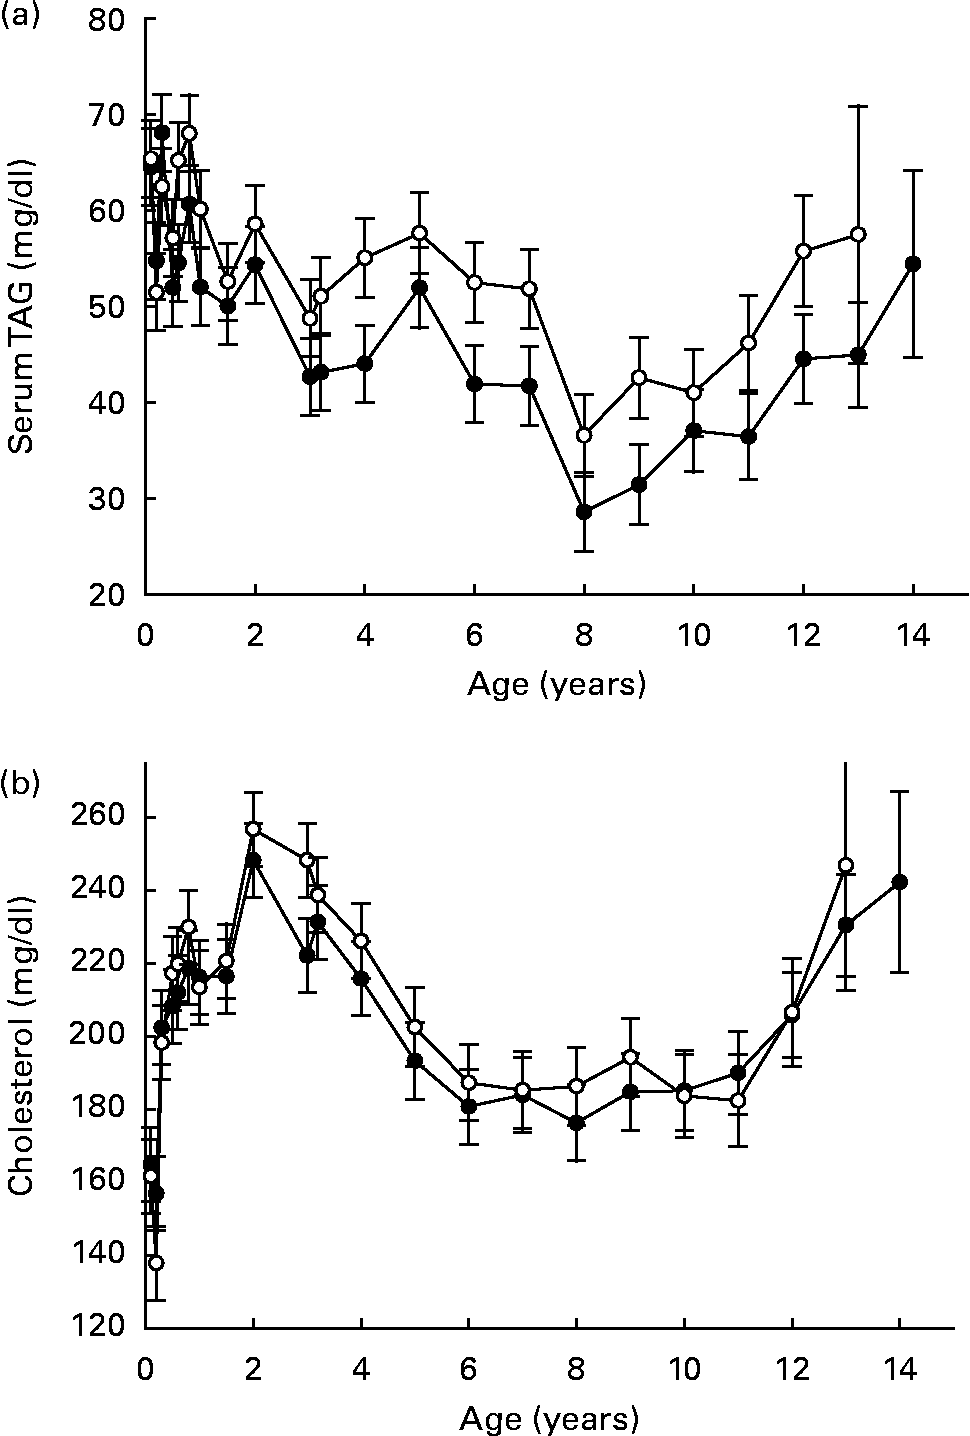
Across species, data suggest that DR lowers circulating TAG (Fig. 4 (a)) as a consistent response, while the influence on total circulating cholesterol (Fig. 4 (b)) is more variable and is somewhat dependent on species and degree of DR(Reference Lawler, Ballam, Meadows, Larson, Li and Kealy44–Reference Choi, Goto, Ikeda and Sugano48). Even when DR provides for generally similar metabolic responses across species, however, the biological implications of those responses may differ. For example, cholesterol-associated atherosclerotic changes represent serious threats to cardiovascular health in man, but this is an uncommon health threat in dogs. The importance of species- and strain-specific aspects of DR effects, despite the robust nature of the overall DR response, is therefore quite clear.
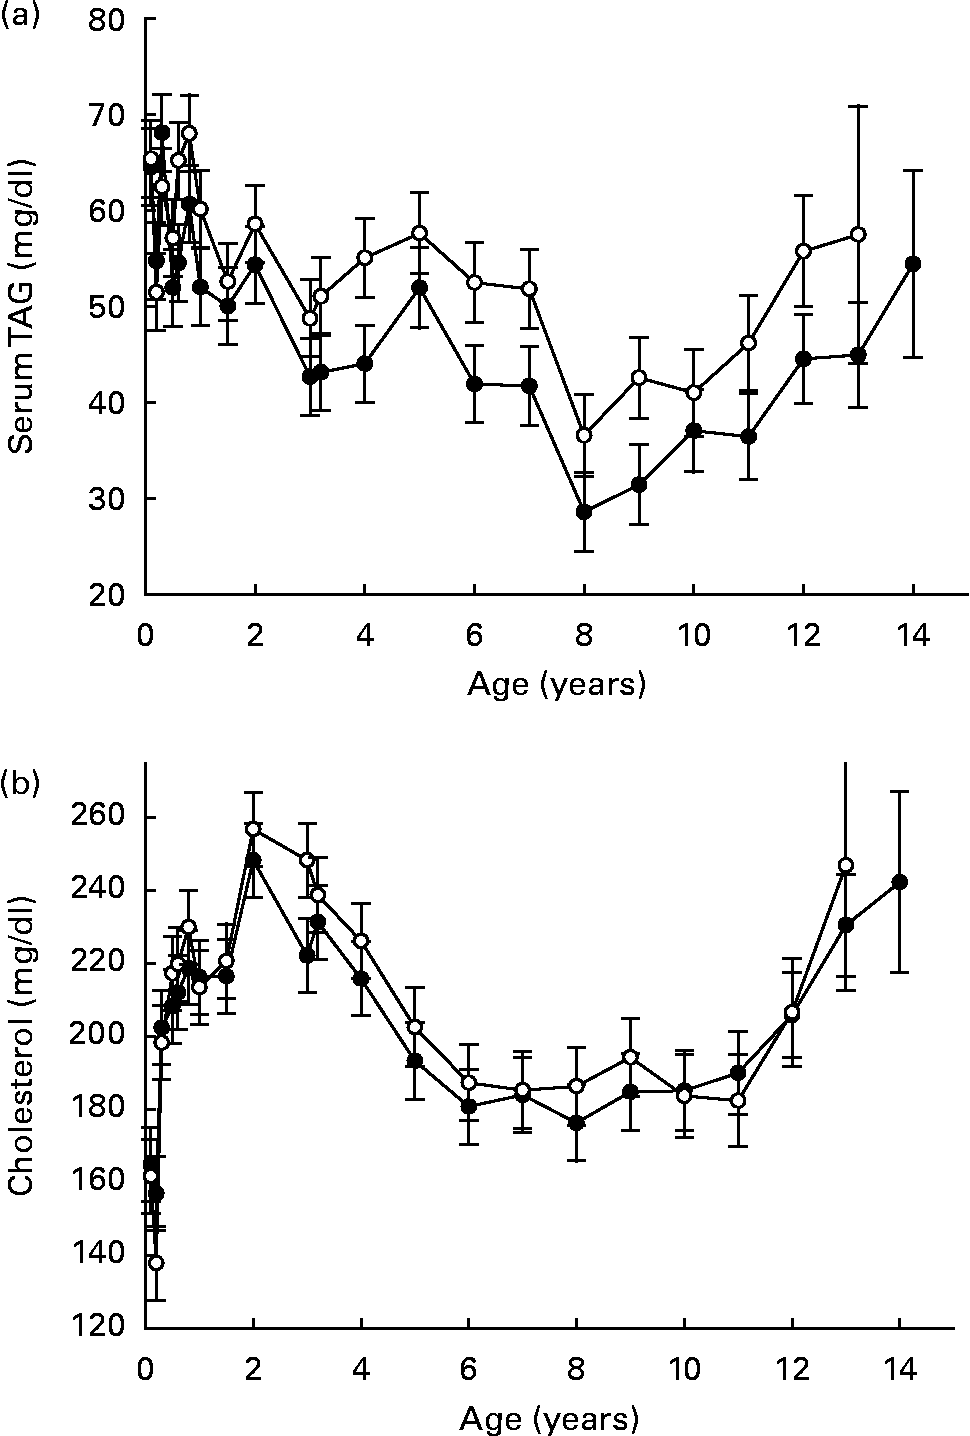
Fig. 4 Clinical chemistry variables (serum means): TAG (a) and cholesterol (b) of diet-restricted (●) and control-fed (○) dogs. Values are means with their standard errors depicted by vertical bars.
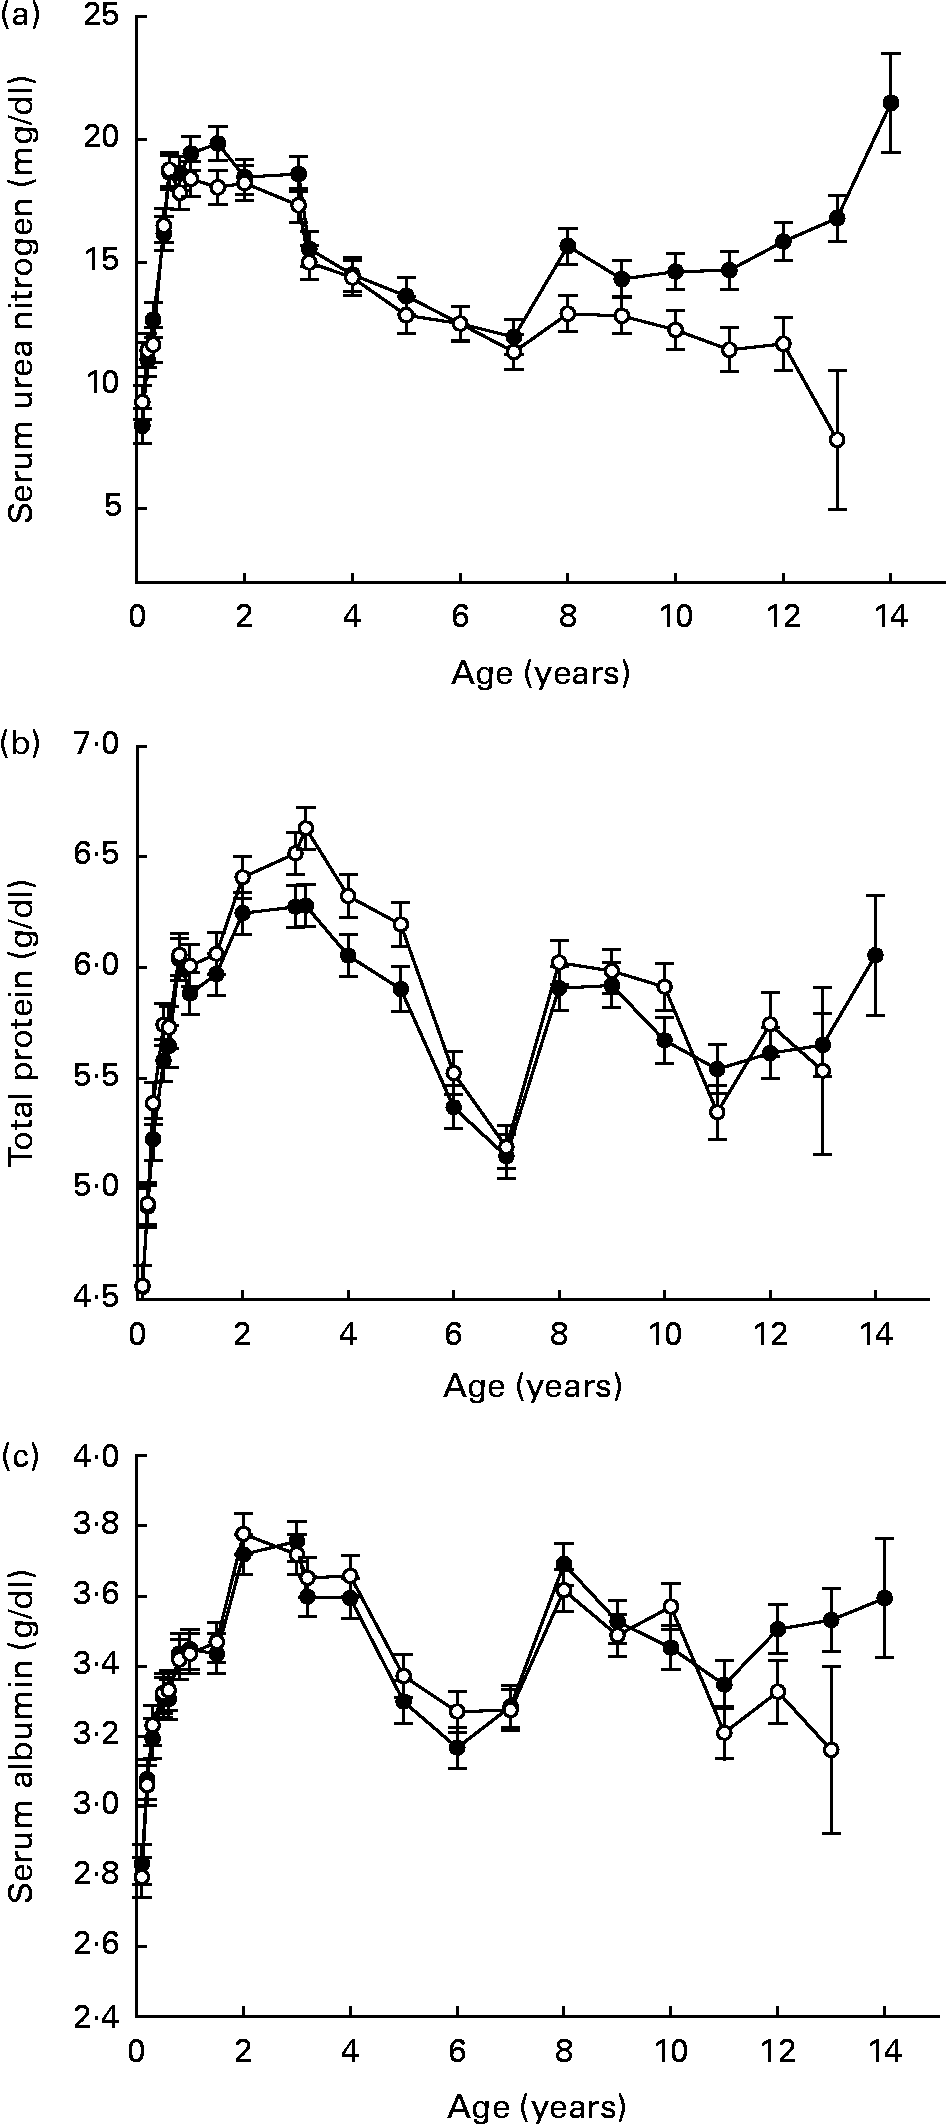
Serum urea nitrogen, total protein and albumin did not strongly reflect changes in lean body composition during late life (Fig. 5 (a–c)). While these three clinical chemistry variables have been used in community practice veterinary settings as an indirect gauge of body protein status during many illnesses, the present data suggest that they might limit the clinician's ability to identify early functional decline in dogs. By comparison, decreasing serum albumin over a 3-year period was a strong predictor of functional decline in older human subjects(Reference Schalk, Visser, Penninx, Baadenhuijsen, Bouter and Deeg49). Mechanisms that are responsible for this apparent species-related difference are not clear at this time.
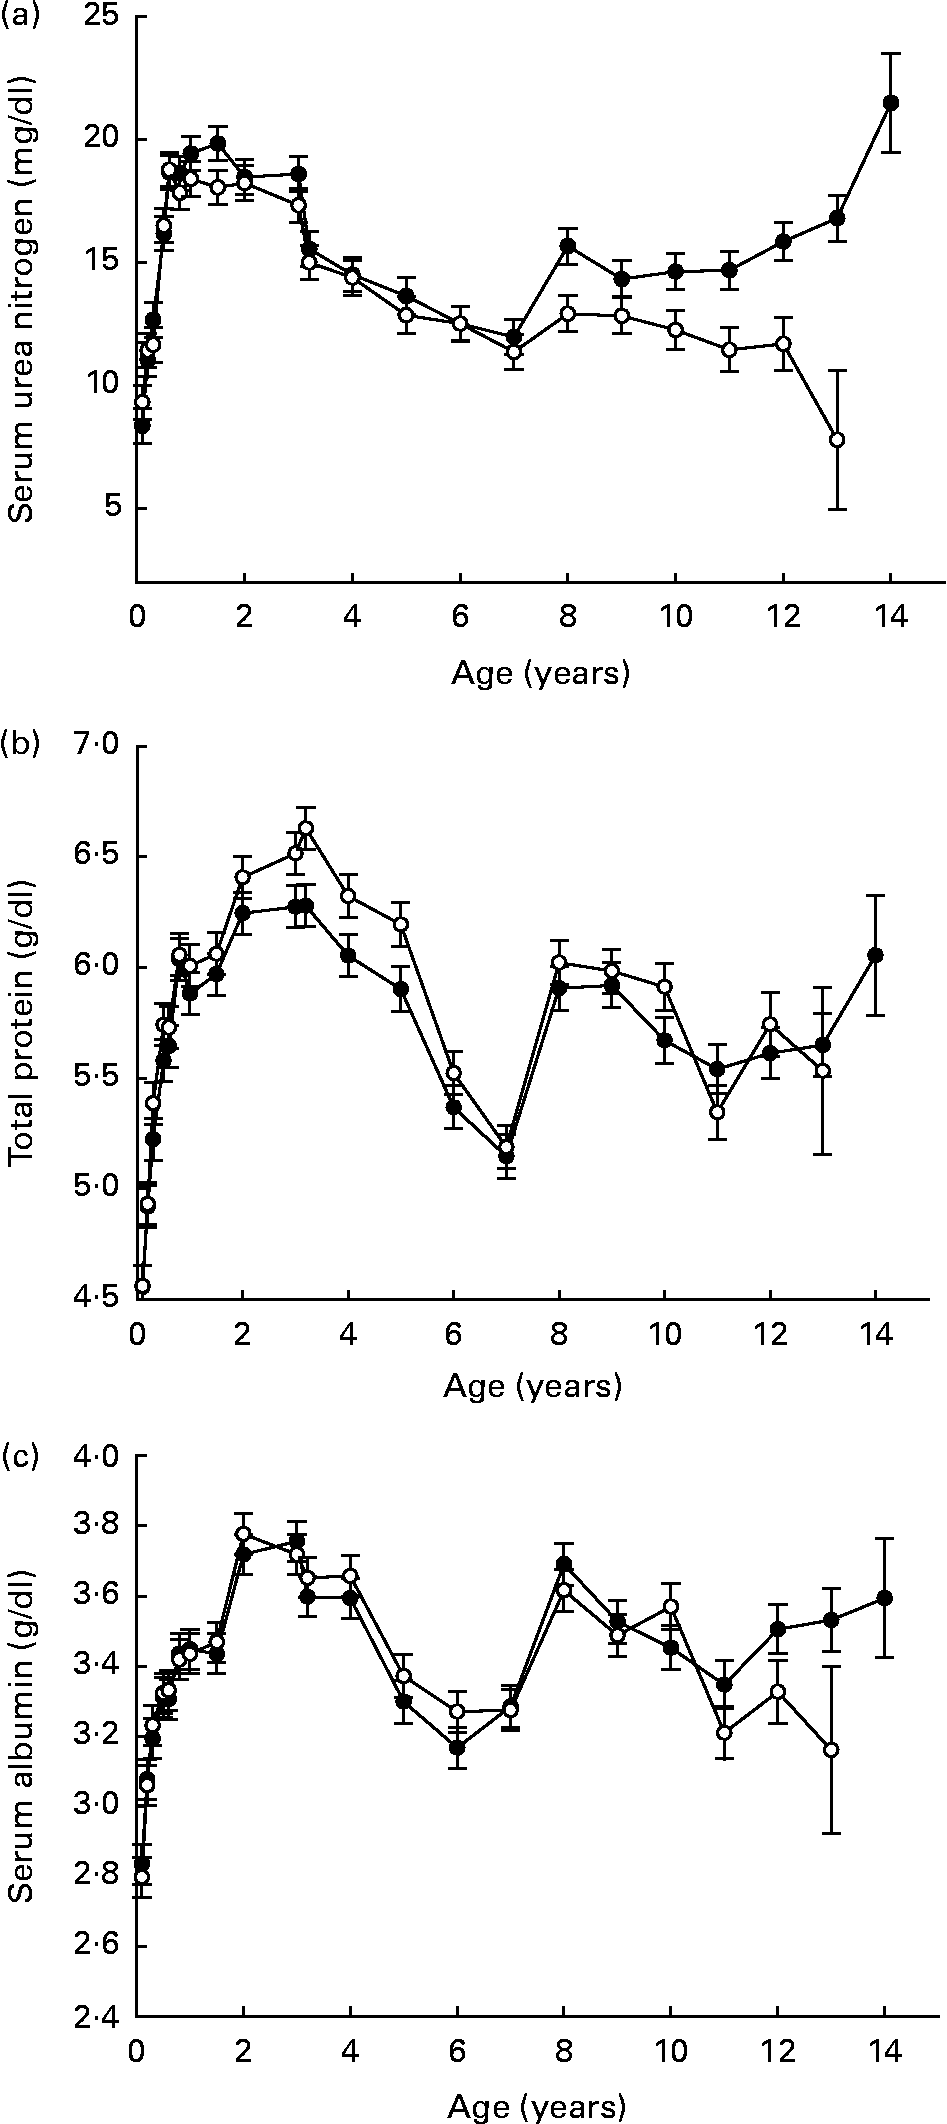
Fig. 5 Variables for assessment of protein status (serum means): urea nitrogen (a), total protein (b) and albumin (c) of diet-restricted (●) and control-fed (○) dogs. Values are means with their standard errors depicted by vertical bars.
In our database, lifetime trends for several serum variables suggested shifting trends at midlife, including glucose, TAG, total protein and albumin. These changes occurred in both feeding groups and were not associated with laboratory equipment, analytical methods, personnel or other experimental procedures, suggesting that the mid-life years could represent a normal period of physiological readjustment in the dog. Overall, within limits of species-specific interpretations, the observations of serum protein and lipid status suggest a hypothesis that, over a lifetime of years, even small numerical changes may represent a cumulative reflection of quantity and quality of life that should not be ignored but may need to be refined in some instances by further research.
Female reproductive system
The normal oestrous cycle of the bitch is unique in several respects, one of which is prolonged function of the corpus luteum after ovulation, resulting in dioestrus of approximately 60 d, nearly as long as gestation. Following regression of the corpus luteum in the non-pregnant state, a pseudopregnant period also is a normal physiological event that may be silent or may be accompanied by a constellation of overt signs that include mammary gland development and discharge, personality change, anorexia and sometimes nesting behaviour. Prolactin levels are higher in serum during the pseudopregnant period, which seems to reflect an inverse relationship between serum progesterone decline and increasing posterior pituitary activity. It is not known whether prolactin production is solely responsible for pseudopregnancy, whether covert or overt(Reference Lawler, Johnston, Keltner, Ballam, Kealy, Bunte, Lust, Mantz and Nie50).
Mean annual frequency of oestrous cycles and interoestrus intervals were not different between CF and DR groups, each of which contained fifteen initially intact bitches. Inflammatory uterine disease, which also is common in the bitch, was not associated with oestrus frequency, interoestrus interval or expression of the pseudopregnancy phenotype. However, frequency of overt (i.e. not silent) pseudopregnancy was significantly greater among CF females. There are very few reports in the literature that define clear nutritional influence on the reproductive physiology of the non-pregnant bitch, and the present observations are significant in that respect(Reference Lawler, Johnston, Keltner, Ballam, Kealy, Bunte, Lust, Mantz and Nie50).
The degree of DR appears generally to influence reproductive physiology, but with apparent species specificity. For example, 40 % DR has been shown to prevent follicular development in female mice(Reference Nelson, Gosden and Felicio51), but the effect on female rats at 40 % DR appears to be less dramatic(Reference McShane and Wise52). Fertility of the domestic bitch declines noticeably after about the sixth year, and then declines dramatically after about the eighth year (somewhat later in the male). While the bitch does not undergo a menopause, markedly declining fertility during mid-life suggests an underlying complexity that includes a relatively long post-reproductive life span. While complicated to some degree by varying energy nutrition among different studies, these observations suggest that DR effects on female reproductive physiology do not constitute a simple exchange mechanism for longer survival.
Male reproductive system
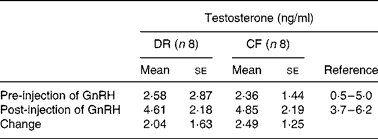
Gonadal steroidogenesis was assessed in intact males at age 6·5–7·0 years, using a gonadotropin releasing hormone dose–response protocol for testosterone estimation in serum samples obtained while fasted for 0 time and 1 h post-gonadotropin releasing hormone intramuscular injection. There were no differences between CF and DR dogs for pre-injection, post-injection or amount of change in mean serum testosterone(Reference Lawler, Johnston, Ballam and Kealy53) (Table 5).
Table 5 Gonadal steroidogenesis in intact diet-restricted (DR) and control-fed (CF) male dogs
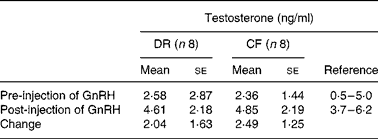
GnRH, gonadotropin releasing hormone.
A study of Norway rats (Rattus norvegicus) indicated an initial decline in testosterone production by Leydig cells in young DR males (36 % at age 5 months) compared to controls. However, by age 25 months, testosterone production in DR rats exceeded that of controls. Thus, the DR-related initial Leydig cell suppression was transient(Reference Chen, Luo, Liu, Brown and Zirkin54). In another study of male Norway rats, investigators noted that DR attenuated age-related declines in epididymal gene expression, suggesting a reduction of age-related dysfunction of epididymal mitochondria and improved epididymal protein synthesis(Reference Jervis and Robaire55). Thus, existing physiological data do not confirm that male reproductive metabolism is likely to be affected negatively by moderate DR. It is worth noting, however, that physiological responses may or may not correlate to actual fertility, and therefore the present state of knowledge does not support definitive conclusions.
Survival v. sex and reproduction
DR-related observations of canine reproductive physiology are compatible with the apparently successful reproduction rate of feral or stray dogs that seldom are overweight and that may suffer from variable periods of undernutrition. In addition, it has been shown that incremental positive effects on survival accrue with progressively increasing DR in rodents, short of starvation that would violate the DR premise of restriction without malnutrition(Reference Weindruch, Walford, Fligiel and Guthrie56). Taken together, these data again suggest that the longevity effect of DR is not a simple ‘survival versus reproduction’ exchange(Reference Kirkwood and Shanley57).
Sex-related survival status also is difficult to interpret from the canine study because of therapeutic application of orchiectomy and ovariohysterectomy, even though pair-mates underwent the same procedure to maintain uniformity within pair. DR-related fecundity could not be judged from the present study, which did not include mating trials. Interestingly, however, sex may influence outcomes of some DR feeding studies. For example, in a study using WAG/Rij rats, 30 % DR started at age 10 months influenced female survival after age 30 months. However, a change in the slope of the survival curve was noted, suggesting altered ageing trajectory within the population. In male rats, when DR was started at age 10 months, 10 % increased longevity was observed, but without a change in slope of the survival curve. When male rats were restricted after age 20 months, survival was not influenced(Reference Teillet, Gouraud and Corman58).
An early question with respect to reproductive effects of DR was whether DR simply represents a ‘return to wild-type feeding’, and is therefore little more than a correction for dietary indiscretion that is common in many modern societies. One important response is that DR delays puberty in rodents, but wild-type feeding does not(Reference Weindruch and Walford59). There is no recognizable survival advantage to conservation of responses that delay reproduction when resources are at least adequate. Thus, the multiple metabolic effects of DR appear to reflect more complex and more broadly conserved survival mechanisms that extend beyond reproductive life span.
Health observations
Activity of the dogs in the present study was neither restricted nor controlled. Except for specific work activities, such as hunting or field trials, the Labrador retriever is not particularly active during adulthood and advanced life. Not surprisingly, therefore, assessment of activity of DR v. CF dogs via motion monitors and videotaping indicated little difference between the two feeding groups. The DR dogs exhibited no tendency toward aggressiveness, which may be a species- or breed-related response.
A study of racing greyhounds indicated that mild (15 %) energy restriction over a 9-week period resulted in a significant increase in sprint time(Reference Hill, Lewis, Randell, Scott, Omori, Sundstrom, Jones, Speakman and Butterwick60). In DR studies of male Long-Evans rats, investigators concluded that survival effects of DR with exercise did not appear to be additive or synergistic(Reference Holloszy61). DR rhesus monkeys (Macaca mulatta) were reported to be more active than CF counterparts, measured by gross motor behaviour, pacing, grooming and stereotypic behaviours(Reference Weed, Lane, Roth, Speer and Ingram62). The outcomes of these studies indicate that the effect and safety of long-term DR with exercise are by no means clear, in light of apparent species- or strain-related differences in responses.
Considering all health conditions associated with ageing, the age at initiation of long-term supportive treatment for any chronic condition ranged from 4·6 to 12·9 years (median 9·9 years) among CF dogs and from 4·0 to 14·1 years (median 12·0 years) among DR dogs(Reference Kealy, Lawler, Ballam, Mantz, Biery, Greeley, Lust, Segre, Smith and Stowe3). From examination of all of the data on causes of death, it is evident that diseases that led to death and body systems that were affected tended to be generally similar between the two feeding groups; principally, the timing of events differed(Reference Lawler, Evans, Larson, Spitznagel, Ellersieck and Kealy4).
Various species- and strain-related pathologies of ageing(Reference Masoro63) have been influenced in DR studies, including nephropathies in Fischer 344, Sprague–Dawley, Osborne-Mendel and Wistar rats(Reference Saxton and Kimball64–Reference Maeda, Gleiser, Masoro, Murata, McMahan and Yu67), cardiomyopathies in F344 and Sprague–Dawley rats(Reference Berg and Sims65, Reference Maeda, Gleiser, Masoro, Murata, McMahan and Yu67), gastric ulcer in F344 rats(Reference Berg and Sims65), osteodystrophy in F344 rats(Reference Shimokawa, Higami and Hubbard68), hypertension damage in SHR and Rapp-Dahl salt-sensitive rats(Reference Lloyd69, Reference Natelson, Ottenweller, Servatius, Drastal, Bergen and Tapp70), autoimmunity in NZB × NZW F1 mice(Reference Fernandes, Friend, Yunis and Good71), cataracts in Emory mice(Reference Taylor, Zuliani, Hopkins, Dallal, Treglia, Kuck and Kuck72), lymphoproliferative disease in MRL/mp-lpr/lpr mice(Reference Kubo, Day and Good73), mammary tumours in DBA mice(Reference Tannenbaum74), lung tumours in ABC mice(Reference Tannenbaum74), leukaemias in Ak mice and F344 rats(Reference Saxton, Boon and Furth75, Reference Shimokawa, Yu and Masoro76), lymphomas in C3B10RF1 mice(Reference Rehm, Rapp and Deerberg77), and pituitary adenomas in Han: NMRI mice(Reference Rehm, Rapp and Deerberg77), Sprague–Dawley rats(Reference Ross and Bras78) and F344 rats(Reference Shimokawa, Yu and Masoro76), pancreatic adenoma in Sprague–Dawley rats(Reference Ross and Bras78), pancreatic islet fibrosis, islet carcinoma and islet adenoma, in Sprague–Dawley rats(Reference Molon-Noblot, Keenan, Coleman, Hoe and Laroque79), mammary fibroadenoma, testiclular interstitial cell tumour and pituitary tumours in F344 rats(Reference Thurman, Bucci, Hart and Turturro80), and immune-mediated glomerulopathy in NZB × NZW F1 (B/W) mice(Reference Safai-Kutti, Fernandes, Wang, Safai, Good and Day81). An interesting recent study of male Sprague–Dawley rats revealed a dose-dependent favourable effect on the onset of cardiomyopathy and nephropathy, diseases to which this strain is genetically susceptible. At age 110 weeks, the incidence of cardiomyopathy was 95 % in CF rats, 75 % at 10 % DR, 45 % at 25 % DR and 15 % at 40 % DR. Nephropathy was observed in 55 % of CF rats, 20 % at 10 % DR, 15 % at 25 % DR and 0 % at 40 % DR(Reference Duffy, Lewis, Mayhugh, Trotter, Thorn, Feuers and Turturro82).
Lifetime DR studies involving primates are in progress, but available data to date indicate that species-specific diseases such as obesity, diabetes mellitus and hypertension are delayed or prevented by DR(Reference Bodkin, Alexander, Ortmeyer, Johnson and Hansen24, Reference Lane, Black, Ingram and Roth83, Reference Hansen, Bodkin and Ortmeyer84). Taken together, these observations again suggest that a part of the DR effect involves modulation of the phenotypic expression of broadly conserved genes that relate to stress response, ageing programming and late life diseases, with species- and strain-specificity being the general rule(Reference Sinclair28).
Musculoskeletal observations
Among CF dogs at age 2 years, 42 % had radiographic evidence of hip OA, compared to 4 % hip OA among DR dogs(Reference Kealy, Lawler, Ballam, Lust, Smith, Biery and Olsson2). By age 5 years, 52 % of CF dogs had radiographic evidence of hip OA, compared to 13 % of DR dogs. Body weight at age 5 years correlated moderately with OA (r 0·4), suggesting that body weight alone might not be the primary driving force for development of hip OA in the dog(Reference Kealy, Lawler, Ballam, Lust, Smith, Biery and Olsson2).
Radiographic hip OA in the whole group of forty-eight dogs had increased in linear fashion over the 14·5-year period of feeding and data collection, from a prevalence of 15 % at age 2 years to 67 % by age 14 years. By the end of the study, 83 % of CF dogs had developed radiographic hip OA, compared to 50 % of the DR group that had a longer median life span(Reference Smith, Lawler, Powers, Biery, Shofer, McKelvie, Paster and Kealy85). DR also resulted in lower prevalence and severity of OA in the shoulder and elbow joints; at age 8 years, the prevalence of OA in two or more joint types was 77 % among CF dogs and 10 % among DR dogs(Reference Kealy, Lawler, Ballam, Lust, Biery, Smith and Mantz86).
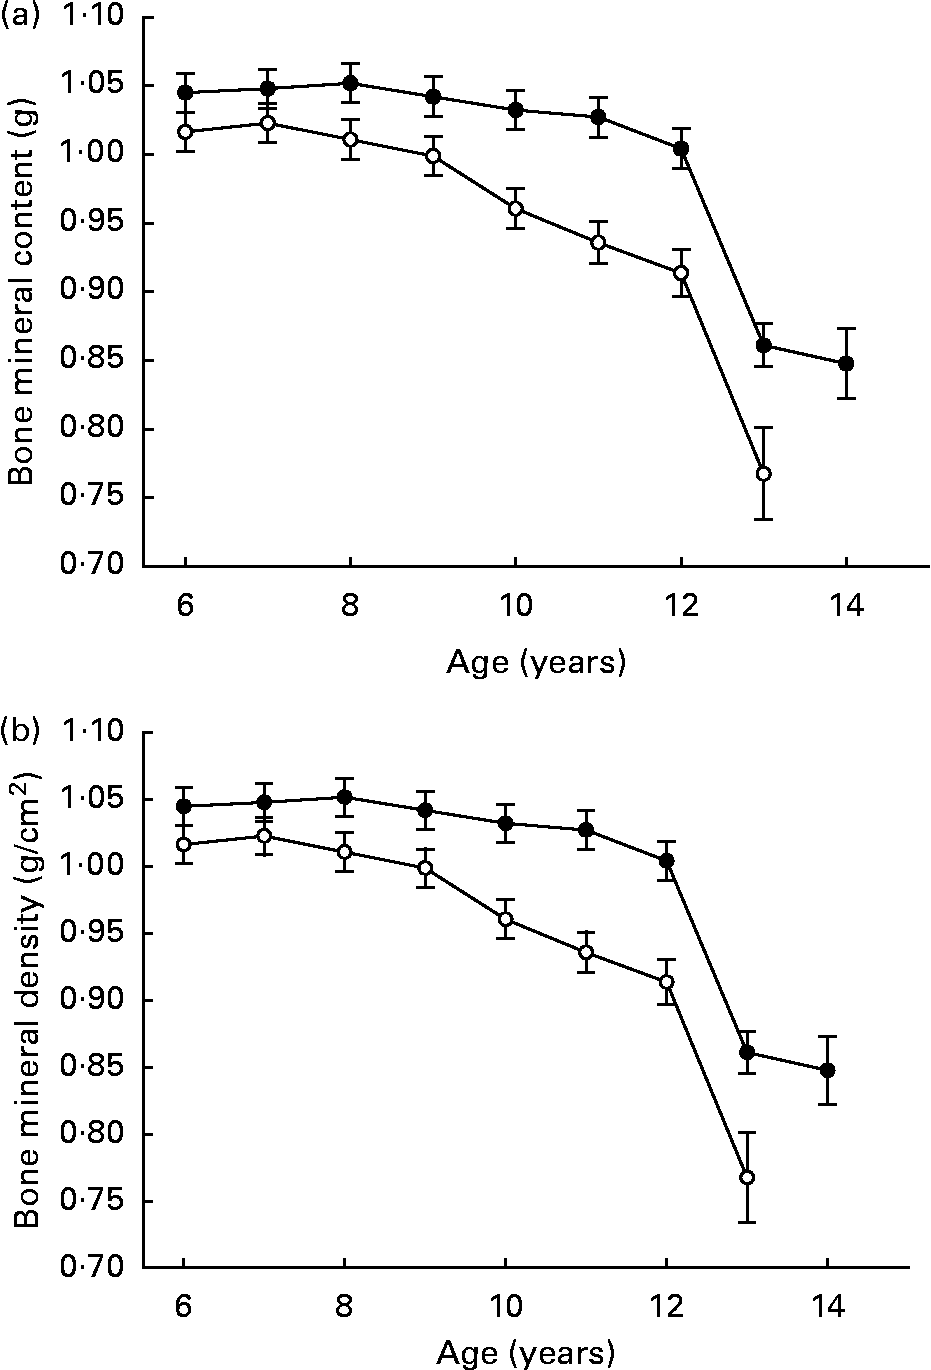
Lifetime 25 % DR did not negatively affect skeletal maturation, structure or metabolism (Fig. 6 (a, b)), although it should be noted that clinical osteoporotic bone disease during late life is very uncommon in dogs. Total bone mineral content and density decreased slightly over ages 6–12 years in CF but not DR dogs. Bone mineral density was greater in DR dogs over ages 6–12 years, while bone mineral content was greater in CF dogs over ages 6–10 years. However, the numerical differences all were slight, there were no associated clinical or histological changes(Reference Lawler, Larson, Lust, Smith, Biery, Evans, Spitznagel and Kealy87), and bone mineral trends were not hazard-predictive of death or disease. The slight age-related declines that were noted in bone mineral density occurred in parallel to lean mass decline, suggesting that they might be related physiologically(Reference Kealy, Lawler, Ballam, Mantz, Biery, Greeley, Lust, Segre, Smith and Stowe3).
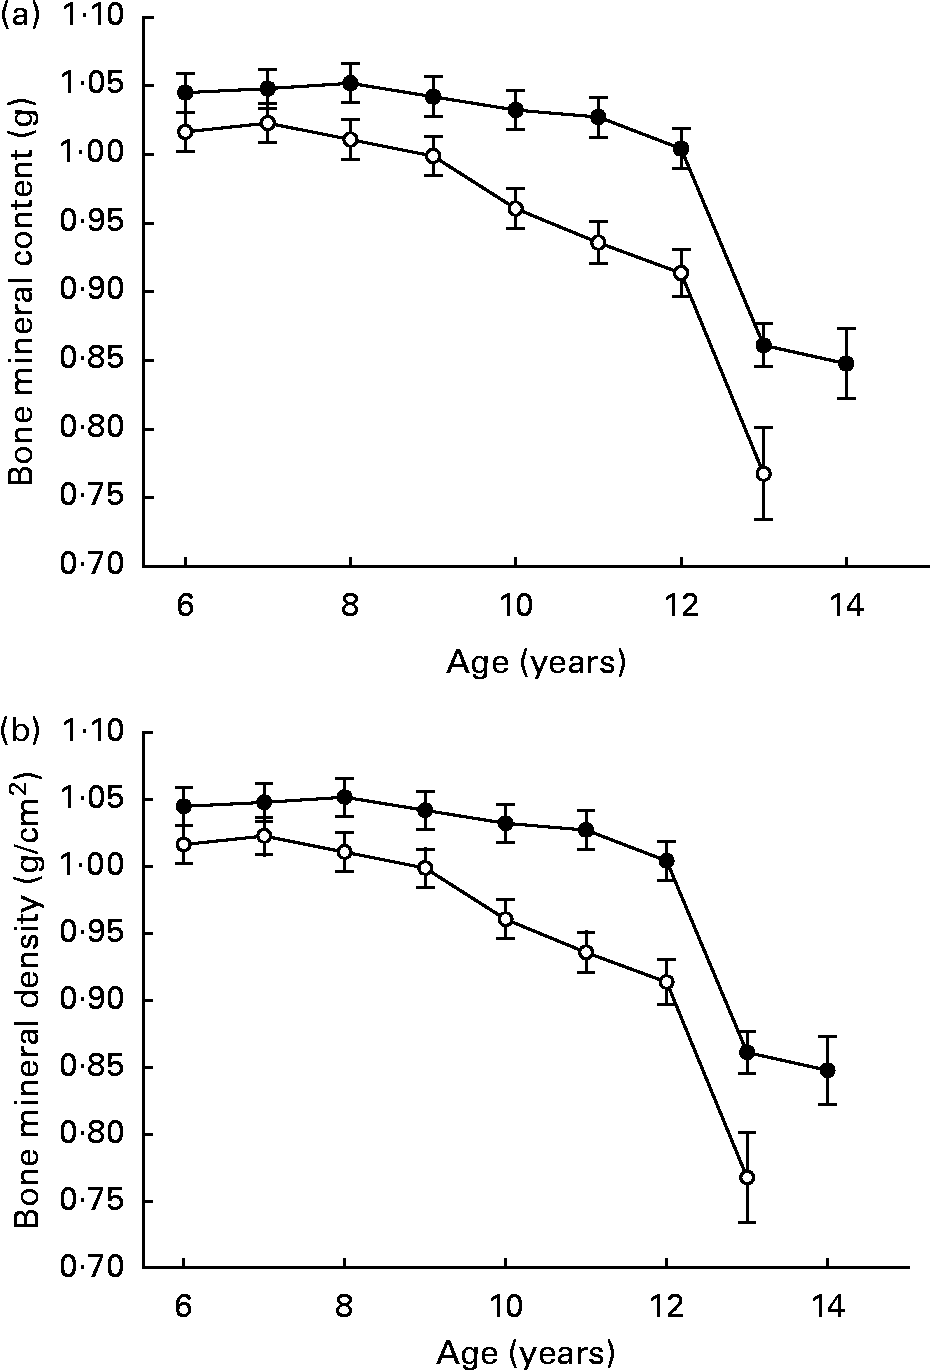
Fig. 6 Bone mineral content (a) and bone mineral density (b) of diet-restricted (●) and control-fed (○) dogs. Values are means with their standard errors depicted by vertical bars.
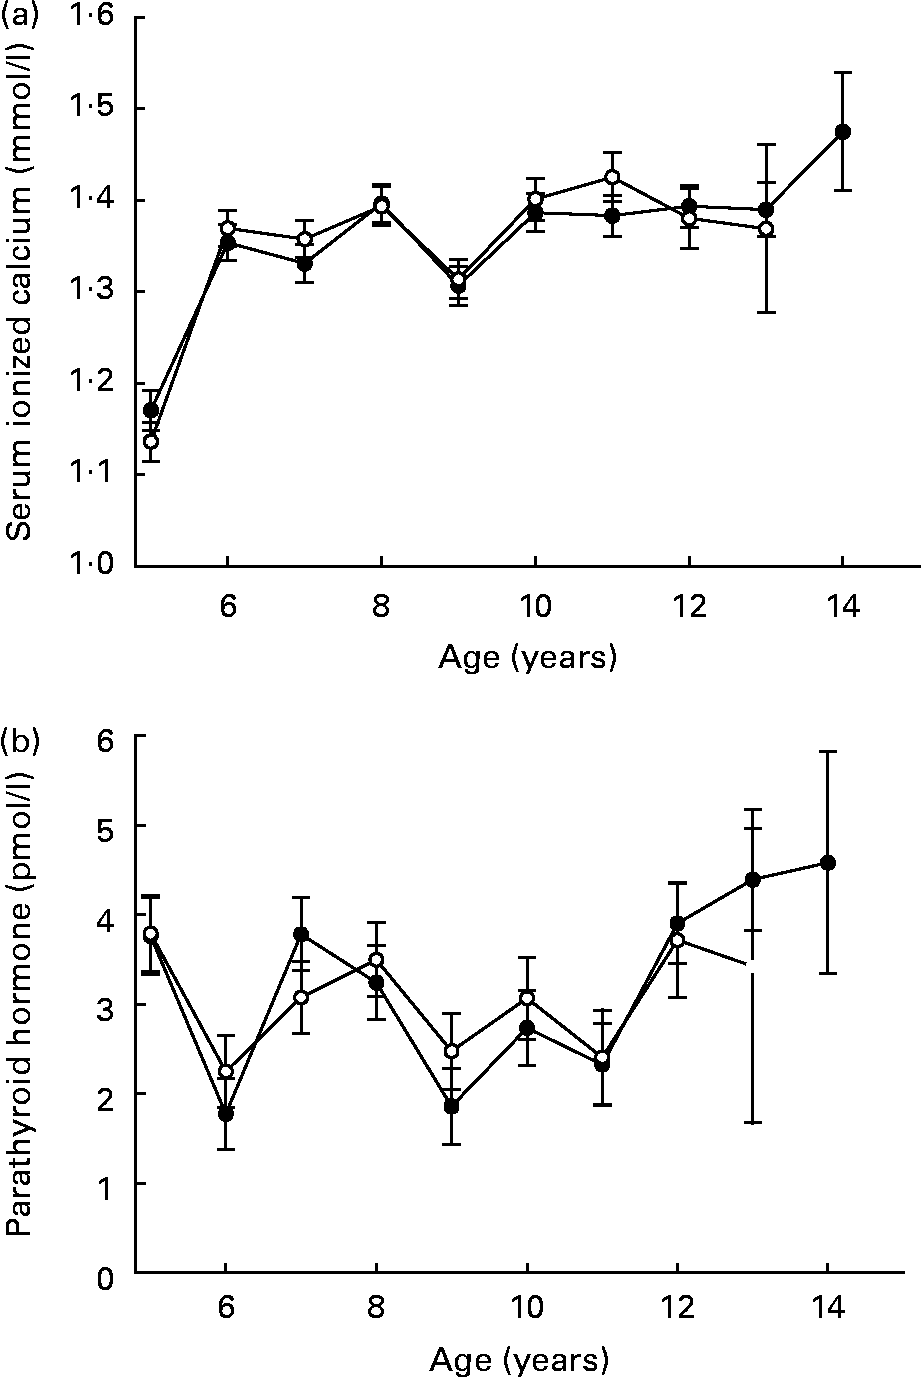
Serum ionized calcium increased in both groups over time, a probable result of the lower initial evaluations at year 5 (Fig. 7 (a)). Serum parathyroid hormone was unaffected by feeding regimen or time (Fig. 7 (b)). Lifetime linear trends for other bone-related serum observations (calcium, phosphorus and alkaline phosphatase) resulted from the expected elevated serum levels during growth and maturation(Reference Lawler, Ballam, Meadows, Larson, Li and Kealy44).
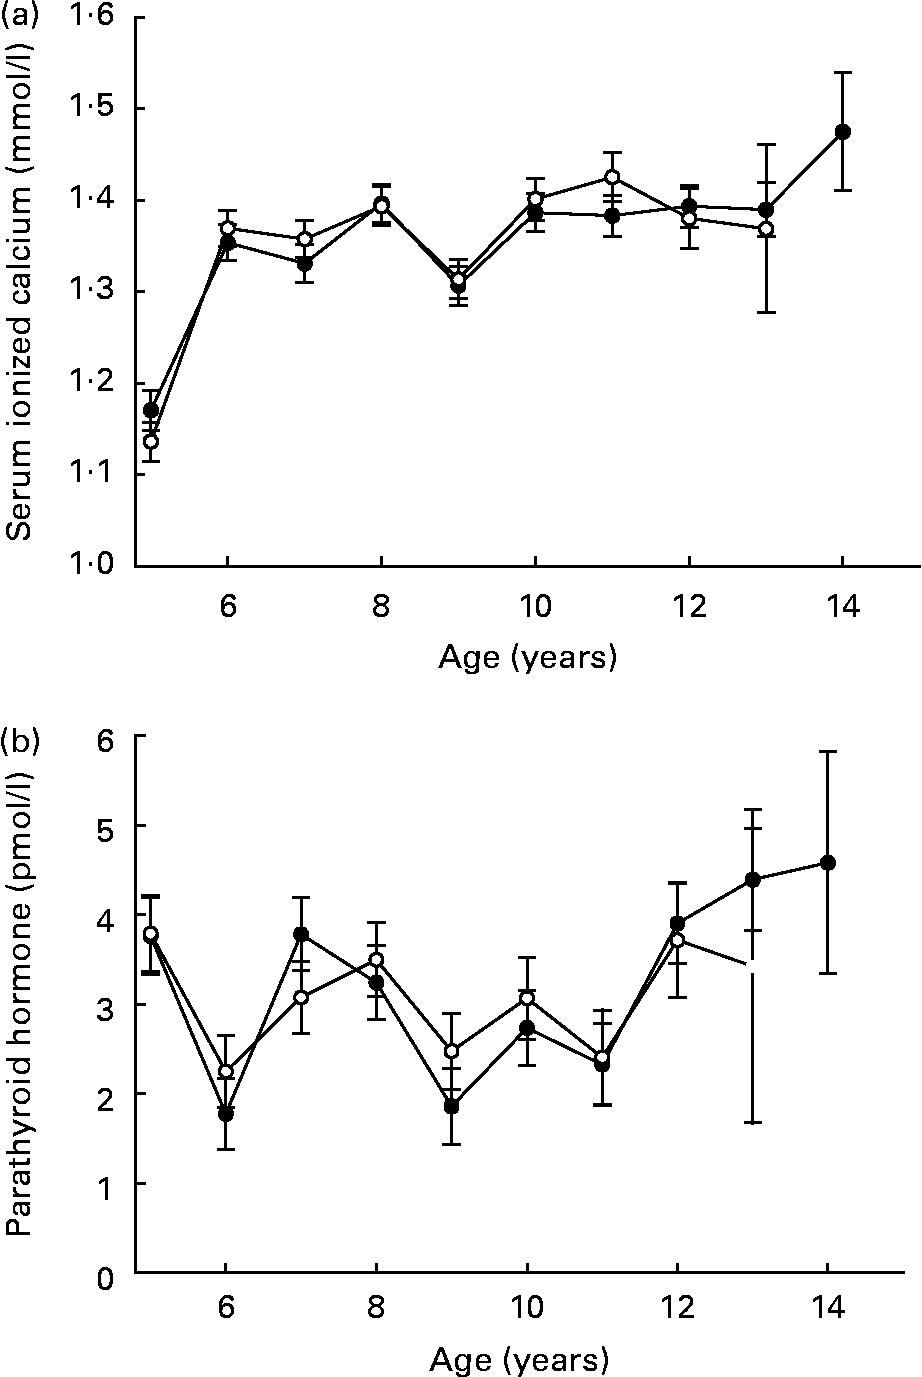
Fig. 7 Mean serum ionized calcium (a) and parathyroid hormone (b) of diet-restricted (●) and control-fed (○) dogs. Values are means with their standard errors depicted by vertical bars.
In a similar study of 30 % DR in rhesus monkeys, lean body composition predicted bone mass in the CF and DR groups. Biochemical markers of bone turnover and metabolism also were not influenced by DR(Reference Black, Allison, Shapses, Tilmont, Handy, Ingram, Roth and Lane88). The similarity of 30 % DR responses in monkeys to those of 25 % DR in dogs is striking. On the other hand, in a study of 40 % DR in F344BN rats, investigators reported changes in tibial properties that were independent of body mass, but negative in their biological direction(Reference LaMothe, Hepple and Zernicke89). These observations again indicate that DR lifetime effects are species-, strain- and ‘dose’-dependent.
Neoplasms
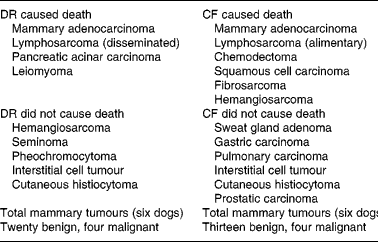
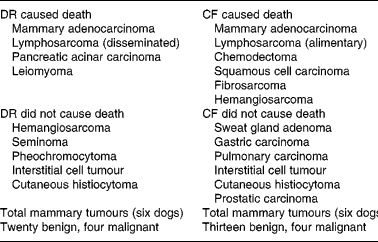
Evaluation of neoplastic diseases has been an important component of many nutritional studies involving rodent strains, in which death from specific types of tumours often occurs at high frequency. Neoplasms that caused death among the dogs were distributed over several body systems, ultimately involving 23 % of the study population. The mean ages at death among five DR (11·6 years) and six CF (9·7 years) dogs that died from malignancies were nearly 2 years apart, although the small size of this cohort and the wide variation in their ages at death prevented finding statistical significance. When all tumours are evaluated together, considerable commonality of tumour type was evident between the DR and CF groups; the principal change was the trend toward delayed time of death from neoplastic causes in the DR group(Reference Kealy, Lawler, Ballam, Mantz, Biery, Greeley, Lust, Segre, Smith and Stowe3) (Table 6).
Table 6 Types of neoplasms diagnosed in forty-eight diet-restricted (DR) and control-fed (CF) dogs, by diagnosis, feeding group and cause of death v. not cause of death
Many but not all rodent tumours are delayed or prevented by diet restriction, and the effects are not always uniform. For example, DR in F344 rats delayed both pituitary adenoma and a form of leukaemia, but with differing degrees of effectiveness(Reference Shimokawa, Yu and Masoro76). In an early study, urinary bladder papilloma, fibroma, fibrosarcoma, some carcinomas, especially those of endocrine origin, were not favourably influenced by DR(Reference Ross and Winick90). Therefore, it should not be assumed that all neoplastic diseases respond similarly to DR in all species.
Another component of tumour effects relates to the method of DR. For example, early-life DR for 7 post-weaning weeks permanently influenced the rat growth pattern and lowered tumour risk, even though it was followed by a return to ad libitum feeding(Reference Ross and Bras78). In a related report, it also was suggested that varying approaches to energy restriction might lead to different outcomes with respect to tumour prevention(Reference Thompson, Zhu and Jiang91).
Declining ability to detect DNA damage during ageing and to signal repair has been associated with mutagenesis and cancer. DR slows the age-related decline of this critical function(Reference Li, Li, Singh, Cowan, Buffinton and Hart92). More efficient maintenance of DNA repair mechanisms, along with fewer errors in DNA replication, should be expected to alter tumorigenesis(Reference Hart, Dixit and Seng93). Thus, the observable effect of DR on tumour occurrence is not surprising.
Additional possible mechanisms underlying the DR effect of reducing tumorigenesis may involve decreased production of reactive oxygen species, more efficient antioxidant metabolism and modulation of apoptosis. A large literature now exists about these mechanisms. However, the primary point to be made is that multiple biochemical mechanisms, reflecting activity and perhaps interactions among numerous genes and gene–environment combinations, appear to be involved in the life-extending effect of even moderate DR(Reference Hursting, Lavigne, Berrigan, Perkins and Barrett94).
Summary
While many metabolic processes are influenced by DR, the underlying molecular mechanisms that are most influential for the longevity effect are not yet understood fully(Reference Partridge, Pletcher and Mair95). The contours of the survival curves in the present populations of CF and DR dogs were parallel, indicating no difference in rate of ageing. Rather, the data support the idea that key effects of DR may involve delays of multiple threshold events that lead to adverse health events, and to an ultimate death trajectory. This, in turn, suggests that molecular mechanisms that influence risk for threshold effects may be important components of the DR longevity effect(Reference Partridge, Pletcher and Mair95). NMR-based urine metabolite trajectories reflected DR-related differences suggesting that gut microbiota may be involved in the DR longevity and health responses.
The DR longevity effect is recognizably robust, and likely involves broadly conserved stress-response genes(Reference Sinclair28). Results of many studies also demonstrate that substantial species- and strain-related variation in the detail of the responses should be expected. Therefore, caution must accompany interpretation of studies that suggest ‘mimic’ effects for drugs or nutritional agents on various metabolic pathways that can be modulated by DR. Given the frequency with which species- and strain-specific metabolic effects and diseases are influenced by DR, the ‘dose-related’ effect of graded degrees of DR, and variation in responses for procedural (experimental) reasons, it is important that cross-species extrapolations should be limited and done very cautiously. It is critical that life-cycle studies of potentially beneficial interventions be done with the species of interest.
Acknowledgements
This work was funded by The (Ralston) Nestle Purina Company, and it was conducted at the (Ralston) Nestle Purina Research Facility at Gray Summit, MO, USA. This work was conducted with the approval and supervision of the Institutional Animal Care and Use Committee. None of the authors has conflicts of interest with respect to this work. Contributions to this work were as follows: clinical sciences (D. F. L.), pathology (D. F. L., R. H. E.), statistics (J. M. B.), nutrition and insulin metabolism (B. T. L.), nutrition and oxidative metabolism (H. D. S.), immunology (E. H. G., M. S.), nutrition and study design and study oversight (R. D. K., D. F. L.), orthopaedics (G. K. S.), and radiology (D. N. B., D. F. L.).


