You praise the firm restraint with which they write –
I'm with you there, of course:
They use the snaffle and the curb all right,
But where's the bloody horse?
Roy Campbell (Reference Campbell1930, p. 104), (1901–1957)
On Some South African NovelistsFootnote 1
1. Introduction
This paper discusses and contrasts existing frameworks for research on institutions and compiles an original dataset. Although many theoretical institutional descriptions are in use and are suitable for general institutional debates, they are applicable to data to different degrees. Our evaluation of existing institutional definitions and frameworks with the end goal of connecting them to the data in mind allows us to propose which institutional matrix is best for operationalization. We proceed by showing how, on this basis, a comprehensive institutional quality dataset can be constructed, which is readily available for other uses.
With the aim of finding good empirical counterparts to theoretical concepts, we choose a specific institutional classification system based on subject category, defining formal institutions as legal, political and economic, and operationalize them with existing institutional proxies. We depart from the literature, which tends to use one or another institutional proxy, and show how to capture the true latent institutional quality within each group. We extract the underlying relative quality of legal, political and economic institutions for every country in the world in every year in the period 1990 to 2010 and rank the countries each year on a World Institutional Quality Ranking (WIQR). This allows us to examine the countries in the world from a comparative institutional perspective. Both the relative institutional dynamics of a country with its relative institutional quality scores, most useful in panel data cross country applications, as well as absolute institutional quality variables and other statistical measures from this paper are freely available in a dataset on the author's webpage http://sites.google.com/site/aljazkuncic/. The data can be used for further research, especially from an institutional perspective or as an inclusion in terms of explanatory variables in other economic applications.
The importance of this paper is in that mainstream economics in the form of neoclassical economics is not generic and self-standing. It cannot uniformly be applied to any given situation or environment produce viable results. Social interactions or any other interactions in an economic system do not happen in a vacuum, even though they may be mostly studied in such a way, neatly exogenizing other factors, which nevertheless govern or have an effect on interactions of economic agents (be it individuals, organizations or firms or even countries). The study of these factors is the core idea of our paper and the field of New Institutional Economics (NIE), which, amongst others, is built on the contributions of Coase (Reference Coase1937, Reference Coase1960), North (Reference North1981, Reference North1990, Reference North2005b), Ostrom (Reference Ostrom1990, Reference Ostrom2005) and Williamson (Reference Williamson1975, Reference Williamson2000).
If the importance of institutions today is well acknowledged and extensively used in growth and cross-country income levels studies (Acemoglu et al., Reference Acemoglu, Johnson and Robinson2001; Easterly and Levine, Reference Easterly and Levine2003; Hall and Jones, Reference Hall and Jones1999; Rodrik et al., Reference Rodrik, Subramanian and Trebbi2004), as well as assiduously within the general research program of NIE, there still lacks a common sense of what institutions are and how can they can be classified. This is not so much a consequence of different definitions, but a consequence of different frameworks used to study institutions, which have not yet been, to our knowledge, evaluated and discussed in relation to one another, with which we start in our paper.
The paper is structured as follows. Section 2 defines institutions, presents institutional classifications and relates our work to the rest of the literature. Section 3 describes the empirical proxies used and offers a basic empirical overview. Section 4 describes the construction of the dataset and presents some directly applicable empirical uses, such as the WIQRs. Finally, Section 5 summarizes and concludes the paper.
2. Institutions, classification systems and other work
The most common and widely used definition of institutions can be attributed to Douglas North, who defines institutions as formal and informal rules of the game, and their enforcement characteristics (North, Reference North1990, Reference North1993, Reference North and Ménard2005a). North (Reference North1993) also demarcates institutions from organizations, which are the players of the game, be it individuals, firms, organizations or any other definable social construct. The game, in this respect, is any social interaction.
Often, the definition of institutions will include the provision that institutions are all rules or forms of conduct, which are devised with the intention of reducing uncertainty (as a consequence of imperfect information and limited rationality), controlling the environment/game and lowering transaction costs (Menard and Shirley, Reference Menard, Shirley and Ménard2005).
Yet another, less succinct but equally important definition of institutions offers Ostrom (Reference Ostrom1990):
‘Institutions’ can be defined as the sets of working rules that are used to determine who is eligible to make decisions in some arena, what actions are allowed or constrained, what aggregation rules will be used, what procedures must be followed, what information must or must not be provided, and what payoffs will be assigned to individuals dependent on their actions. (Ostrom, Reference Ostrom1990, p. 51)
In Ostrom's definition, the concept of arena or action arena (Ostrom, Reference Ostrom2005) is analogous to North's concept of a game. If the definitions of institutions have a lot of common ground and are widely accepted by the scientific community, there are still more variations in terms of how to correctly sum up or classify everything that can be considered to be part of the institutional environment.
We discuss three commonly known classifications of institutions: subject category, degree of formality and degree of embeddedness, which each in a different way try to capture the institutional matrix (North, Reference North1993, Reference North and Ménard2005a) or action arena (Ostrom, Reference Ostrom2005). Regardless of the type of classification chosen, the groups of institutions are almost always intersecting, both within and between the system of classification, which must be kept in mind, as it implies that there exist more ways than one to classify institutions, even within a chosen type of classification. This holds especially for the marginal institutions from the point of view of classifications, which have characteristics of more than one group, and can so be classified as belonging to one group, the other group or both.
In respect of subject category, we can classify institutions as being legal, political, economic and social institutions (Joskow, Reference Joskow, Brousseau and Glachant2008), while it would be perfectly sensible to place the organizational institutions within firms (also called modes of governance) into a separate group. Legal institutions are the most omnipresent type of institutions, for some or another form of legislature can be found in practically any kind of, but most primitive or intimate, social interactions. They vary from public- or state-devised legal institutions, to private legal institutions, which are realized in contracts. Legal institutions are a large part of what is called formal institutions in the degree of formality classification. The range of issues where legal institutions are important is vast, some of the grave issues involve property rights, the origins of legal systems and their effects, and enforcement of legislation. We can talk about political institutions at any time, when we discuss polity in a broad meaning, the voters, electoral rules, political parties and rules of and limits of a government or state. Economic institutions are being intersected to a large extent by legal institutions and are institutions needed to secure a properly working market, such as the legal system, enforcement of property rights, some parts of regulation, etc. Social institutions are concepts such as norms, beliefs, trust and civic cooperation, and coincide largely with informal institutions in the degree of formality classification. The literature on social institutions also examines and researches social capital and social networks. Lastly, institutions within a firm or modes of governance are the micro-organizational-type institutions, which rest directly on transaction costs concepts. The issues researched within this last group of institutions are what kind or types of organizations (ranging from a free market to a perfectly integrated firm) are most appropriate.
Classification on the degree of formality is the simplest, as there are only two, largely distinct groups: formal and informal institutions. This classification follows directly from North's definition of institutions and is often used in general applications. Formal institutions are largely laws (statute or common law or a combination of both), regulations and any other rules to which people explicitly subscribe, while informal institutions are norms, conventions, codes of conduct, trust, etc. and are the rules which are not explicitly written down and are below the social surface. There is also an earlier similar distinction of institutions as being either constitutional rules (such as the constitution and basic legislation), operating rules (legislation) and behavior rules (aimed at legitimizing the first two groups) (North, Reference North1981). The first two groups can thus be considered as formal institutions, and the third as informal institutions.
The degree of embeddedness or Williamson's (Williamson, Reference Williamson2000) classification of institutions is one of the most interesting, as it is able to describe the interlinking nature between formal and informal institutions with the concept of the embeddedness of institutions. In this classification, institutions are ordered in four levels. Because lower levels of institutions are more embedded, they change more slowly than higher levels of institutions. Level 1 institutions are mostly informal institutions, such as customs, traditions, norms and religion. Less embedded are level 2 institutions or institutional environment, defined as the formal institutions or formal rules of the game, especially property rights, polity, judiciary and bureaucracy. Level 3 are the institutions of governance, where governance structures are aligned with transactions, especially contracts with their transaction costs. Finally, level 4 institutions present the rules that govern resource allocation and employment, that is using the neoclassical marginal principles to maximize certain objectives. Each lower level evolves more slowly than a higher level. The proposed frequency of change for the first level is from 100 to 1,000 years, 10 to 100 years for the second and 1 to 10 years for the third, while changes at the fourth level can happen on a continuous basis. Additionally, since levels are embedded in each other, each institutional level is constrained by the immediately preceding lower (more embedded) level. There can be feedback from higher to lower levels as well, although the first constraining relationship is much stronger.
Apart from the suitability of theoretical classification for a chosen area of investigation, for any empirical application one must take into account the possibilities for the conceptualization of chosen theoretical constructs. With that in mind, we proceed with the subject category classification (Joskow, Reference Joskow, Brousseau and Glachant2008) and concentrate on three relatively homogeneous groups of institutions: legal, political and economic. The reason for excluding social and organizational institutions is that the institutions which could be grouped into the first or the second groups are still too heterogeneous for the groups to be thought of as representing a common underlying dimension. Additionally, for the first three formal subject groups, the availability of indicators both across countries and in time is much better than for the social and organizational institutions, for which there are few empirical proxies, and even fewer that are internationally comparable.
One of the advantages of our approach is that it is based on NIE theory. In that respect, we are providing the link between theoretical constructs and their empirical counterparts. We can compare and contrast our paper and the resulting dataset to three well-known projects, which are in the same track as ours, but different in their objectives, methodology and goals. First, perhaps the best known effort at capturing the institutional environment of countries, among many other things, is the Global Competitiveness Report of the World Economic Forum (Sala i Martin et al., Reference Sala i Martin and Greenhill2011). Second, a project following a more similar logic as ours is the Quality of Government project, compiled by the Quality of Government Institute at the University of Gothenburg (Teorell et al., Reference Teorell, Charron, Samanni, Holmberg and Rothstein2011). And, third, the CESifo Group in Germany has been constructing an institutional climate index (Eicher and Röhn, Reference Eicher and Röhn2007), which is the most similar to our paper.
The Global Competitiveness Report examines the competitiveness of economies around the world on 12 pillars. It was initiated in 1979 and the 2011–2012 report covers 142 developed and emerging economies. Since 2004, the report offers the global competitiveness index, which ranks countries based on their scores in all pillars, which are based on more than 100 different measures. The focus of the report are not institutions per se, but the competitiveness and productivity of economies, albeit some pillars, especially the first pillar: institutions, are directly related to the topic of this paper, and many indicators used by them are also used in this paper. However, the report has a different stated focus, which is much broader than only institutions, has a very short available time span, and does not try to capture the institutional environment of countries in the same capacity as the theory would imply. The aggregated global competitiveness index, as well as its major construction blocks, also goes against the logic that in terms of institutions, aggregation is tricky and only the measures with a clear common underlying dimension should and can be aggregated together.
Avoiding aggregation altogether, the Quality of Government Institute at the University of Gothenburg compiles a comprehensive cross-sectional and time-series dataset with global coverage varying in time and countries, depending on the variables included. They comb the literature for an impressive amount of indicators related to the quality of government, and offer them in a merged dataset for easier use. The variables are collected in three groups: ‘WII (What It Is) variables, that is, variables pertaining to the core features of QoG (such as corruption, bureaucratic quality, and democracy)[,] HTG (How To Get it) variables, that is, variables posited to promote the development of QoG (such as electoral rules, forms of government, federalism, legal and colonial origin, religion and social fractionalization)[,] WYG (What You Get) variables, that is, variables pertaining to some of the posited consequences of QoG (such as economic and human development, international and domestic peace, environmental sustainability, gender equality, and satisfied, trusting and confident citizens)’ (Teorell et al., Reference Teorell, Charron, Samanni, Holmberg and Rothstein2011, p. 36). The variables from the first two groups are used extensively also in this paper, the difference being the theoretical underpinning and aggregation of variables, which they do not attempt.
In terms of the spirit of this paper, the final product – the Institutional Quality Dataset – is most related to a dataset offered by the CESifo Group in Munich (Eicher and Röhn, Reference Eicher and Röhn2007). They compose an institutional climate index for Organisation for Economic Co-operation and Development (OECD) countries from 1994 onward. The index, composed out of eight parts, is primarily intended ‘to assess the extent to which individual OECD countries possess the institutional quality to achieve economic growth’ (Eicher and Röhn, Reference Eicher and Röhn2007, p. 39), which also means that its ‘components are selected and weighted based on their predictive power’ (Eicher and Röhn, Reference Eicher and Röhn2007, p. 40). First, their focus and weighting on the predictive power of indices for economic growth with the focus on only OECD countries is the first main difference between the dataset constructed in this paper and their work. Our dataset has from 94 to 109 complete institutional country values for each year from 1990 to 2010 and is not restricted to the OECD countries. Second, we start from the theoretical foundations of institutions and thus do not weight institutional proxies by their gross domestic product (GDP) predictive power, but rather show how NIE theory can be operationalized to capture the bulk of what is known as the institutional environment. We do not believe in the possibility of forming a single variable that could adequately describe the entire institutional environment of a country, as in Eicher and Röhn (Reference Eicher and Röhn2007). Although several indices used by the authors such as some from the Polity IV Project, International Country Risk Guide, Freedom House, Fraser Institute and the World Bank are also used in our paper, others are different and most do not coincide. Moreover, comparing our three institutional measures with parts of the institutional climate index, the difference is that most parts of the institutional climate index would actually not be called institutions in our work [using North's rules of the game definition; North Reference North1990), as they also represent policy choices, market outcomes, preferences and their interactions. Our work thus contributes to the literature both in terms of country and year coverage and in terms of linking the theoretical institutional concepts with the empirical counterparts, without biasing the composition of the institutional measures with a particular end-game in mind.
3. Institutional measures and empirical overview
The important issue in empirical research is how to conceptualize the theoretical constructs. Institutions are latent factors within the economic system, and it is hard to find one proxy which would suitably represent the quality of the institutional environment. A composite indicator which combines the information of several empirical measures is a better solution. It can be based on a simple average of more variables or better yet, extracted as the latent factor with factor analysis, so that it truly represents the underlying institutional dimension, which the institutional proxies share.
After a careful review of the available empirical institutional indices which correspond to the above-stated definition of an institution, we compose a table of the ones that have the longest time coverage, that is a coverage starting at least in the 1990s, and include the bulk of the countries in the world. If this was the case and indicators are poor either in terms of the cross-sectional coverage (including less than 100 countries), or in terms of time coverage (starting from only with the year 2000 or later), it was not included in our analysis. As an additional criterion, we give preference to the indicators with a proven track record in the literature and to the original source.
In the 2000s, the availability of institutional proxies has increased dramatically. We do not, however, include the more recent indicators, as that would limit the sample to a much shorter period, or make the results hard to justify and compare on the time dimension. Not ideally, but necessary for our purposes, excellent indicators with either only a cross-sectional coverage or starting only in the 2000s, such as democracy and dictatorship dataset (Cheibub et al., Reference Cheibub, Gandhi and Vreeland2010), regulation of labor (Botero et al., Reference Botero, Djankov, Porta and Lopez-De-Silanes2004), doing business indicators (The World Bank, 2013), Global Competitiveness Index (Sala i Martin et al., Reference Sala i Martin and Greenhill2011), and political constraints index (Henisz, Reference Henisz2013), cannot be included in the dataset. Most of them are, however, collected within the Quality of Government Institute's project at the University of Gothenburg in their raw form (Teorell et al., Reference Teorell, Charron, Samanni, Holmberg and Rothstein2011). At the end of the next section, we also discuss the sensitivity of the dataset to the inclusion and exclusion of raw institutional indicators.
A further note on the empirical institutional measures available in the literature is that some institutional measures provide a clear ordinal ranking, which are the measures that we use in this paper, while others such as Cheibub et al. (Reference Cheibub, Gandhi and Vreeland2010) are more focused on the classification of different institutional frameworks. Those measures correspond more to the varieties of capitalism (VOC) approach, originated by Hall and Soskice (Reference Hall and Soskice2001). ‘The key notion here is institutional complementary: put simply, institutions across different areas must be consistent with one another in order to support economic development. There is no a priori assumption that market or strategic coordination is intrinsically better’. (Kunčič and Šušteršič, Reference Kunčič, Šušteršič, Šabič and Drulák2012, p. 241). Putting it differently, with the VOC, there is no assumption that pro-market institutions are better than some other combination of institutions, which is the underlying notion of the ordinal institutional measures we select and analyze in this paper.
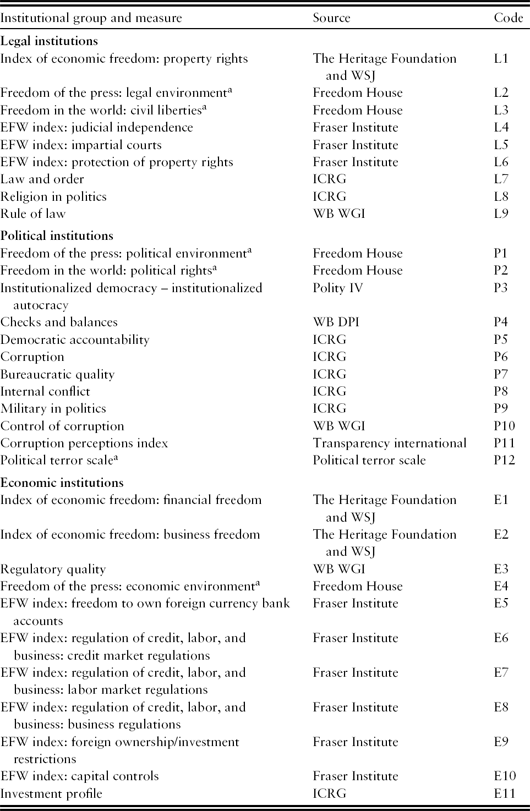
With time coverage, geographic coverage and suitability of established indicators in mind, we collect the empirical proxies. The list, however, is not exhaustive and it is, admittedly, subjective to some degree, although the number of indicators used and the technique of extracting the latent institutional factor goes a long way to capturing the true underlying institutional quality, which is not dependent on only a couple of included or excluded institutional proxies. We group the empirical proxies into three relatively homogeneous groups of formal institutions: legal, political and economic, as shown in Table 1, which also includes the coverage and source of the indicator, while the name of the indicator itself represents what the indicator is capturing. The institutional measure includes most countries in the world with various coverage and are predominantly available on a yearly basis in the period from 1990 to 2010. Authors and sources of the data are, as follows in the table, Miller et al. (Reference Miller, Holmes, Roberts and Kim2010), Freedom House (2012a, 2012b), Gwartney et al. (Reference Gwartney, Lawson and Hall2012), The PRS Group (2013), Kaufmann et al. (Reference Kaufmann, Kraay and Mastruzzi2013), Marshall et al. (Reference Marshall, Jaggers and Gurr2013), Keefer and Stasavage (Reference Keefer and Stasavage2003), Transparency International (2013), and Gibney et al. (Reference Gibney, Cornett and Wood2013). Most indicators are available from 1990 to 2010, while some begin in the early or mid-1990s. Specifics for the availability of institutional proxies are further discussed in Appendix A.
Table 1. Institutional proxies

aScale is inverse, a higher number implies lower quality.
Source: As noted in the table.
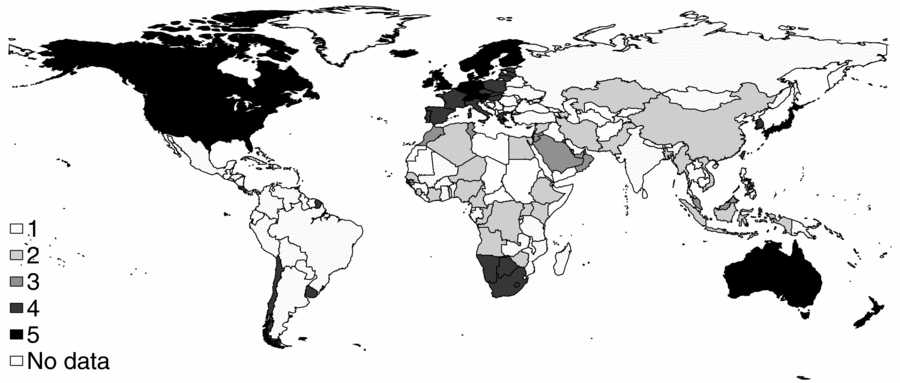
A quick look at the general quality of institutional environments around the world can be taken with a cluster analysis. We condense all the information on institutional proxies to one time period to get an overview of how similar countries are. The cluster analysis allows us to cluster similar countries in terms of institutional quality together and forms homogeneous groups. We use hierarchical clustering with Euclidean metric and Ward's error sum of squares method. We take the average of institutional proxies for the entire period, which yields 111 countries with average values for all institutional proxies.Footnote 2 We first standardize the average institutional measures not to be dependent on the scale used in further calculations. To enlarge the sample, we use a variant of the nearest-neighbor matching within each institutional group to determine which countries are closest to each country, and then substitute the missing values of countries which are missing less than one-third of their institutional proxies within each group with the average of the value of the two closest neighbors. This leaves us with 126 countries on which we continue the cluster analysis.Footnote 3 The dendrogram (available upon request), where the length of vertical lines shows dissimilarity between groups, implies a big divide into two large groups of countries, one with better general quality of the institutional environment and another with worse, or, more interestingly, a clustering solution into five groups of countries, which is also shown on a world map in Figure 1.

Figure 1. New institutional world order.
Source. Own calculation.
The quality of institutional proxies within each group is best examined when comparing the average values for each proxy between clusters for legal, political and economic institutions, respectively (tables available upon request). Based on that, we can also interpret the average cluster characteristics. Cluster 1 is really bad, as it scores consistently around one standard deviation below the average in all three institutional groups. In contrast, cluster 5 is doing extremely well, as it scores consistently one or more standard deviations above the average. Cluster 4 is also good, with having most of the institutional proxies well above the average. The two more interesting clusters are clusters 2 and 3. In terms of the legal environment, cluster 2 scores poorly on the quality of courts and protection of property rights, and reasonably well on freedom of the press, civil liberties and interference of religion; the opposite goes for cluster 3. In terms of the political environment, clusters 2 and 3 mostly have average scores, with the exception of cluster 3 doing very badly on the autocracy versus democracy measure, checks and balances and democratical accountability, but very well on the corruption measure. Finally, in terms of economic institutions, cluster 2 is bad, with scores significantly below the average, while cluster 3 is doing well, with the same exception as before, that is the oppression of the press.
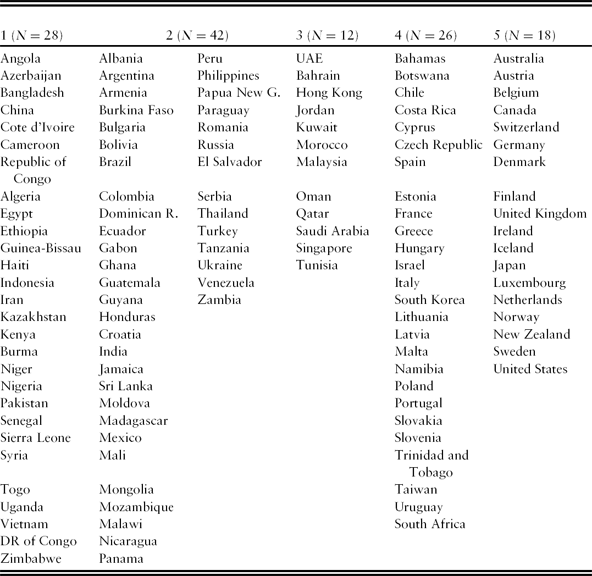
Table 2 lists the countries belonging to each of the clusters. A look at the average GDP per capita, literacy rate and life expectancy for each cluster points to the average state of the world in those countries. The 28 countries in cluster 1 have extremely hard living conditions, as they have an average GDP per capita of only 933 USD, a life expectancy of less than 58 years and a literacy rate of less than 67%. All in all, they are underdeveloped, poor, and sometimes even politically unstable, and have a large intersection with Paul Collier's bottom billion countries (Collier, Reference Collier2007), although the group is three times as large, with almost three billion people living there. The 18 countries in cluster 5 are the complete opposite and are the so-called developed world, with a high income of over 34,000 USD, life expectancy of 78 years and almost perfect literacy rate at 99%. Those are in fact the best living conditions one could hope for, but only 700 million people get to enjoy them. The highest number of countries is clustered into cluster 2, where we can find 42 countries. Their average income is still very low, but more than twice the one of cluster 1, and they have a significantly higher life expectancy and literacy, at 66 years and 82%, respectively. Institutionally however, they are not doing that well, especially on legal and economic institutional quality. Cluster 4 with 26 countries and 400 million people, which prevalently consists of reasonably developed countries, along with some very developed countries, has an average GDP per capita of over 11,000 USD, but high life expectancy at 73 years and extremely good literacy rate of 95%. The most mixed group is in fact cluster 3, where there are only 12 countries with a sum of 133 million people. What makes them similar outside of the variables in question is the fact that they are, apart from Hong Kong, all countries with a majority of Muslim population. In terms of their average GDP per capita and life expectancy, they even exceed cluster 4, but are behind it for more than 10 percentage points in literacy. The specific institutional system in these countries seems to be one in which countries tend to oppress certain groups in their populations. It seems that countries in cluster 3 seem to be reasonably well off, with the exception of providing certain civil liberties (which might depend also on gender and religion), democratic accountability and free media, which is problematic for some more than for others.
Table 2. Cluster memberships (number of countries)

Source. Own calculation.
Returning to the world map in Figure 1, the quality of institutional environment data of the last 21 years is clearly implying a geographical division of the world, in terms of the quality of institutions. The highest quality of the institutional environment can be found in North America, Australia, central and northern Europe or Japan. At the other extreme of countries with extremely poor quality of the institutional environment and high on the not to move there institutional list are countries in Central America, Asia and most of South America and Africa.
4. Building up the dataset and examples of applications
We proceed with a description of dataset construction and some applications in terms of a comparative institutional analysis of all the countries in the world, which is based on results of a confirmatory factor analysis. Factor analysis allows us to calculate the latent underlying factor in each institutional group, which represents what the institutional proxies have in common within each group. It enables us to arrive at three country-level institutional quality variables: legal, political and economic, which form the heart of our institutional dataset and can then be used also in other economic applications. In this section, we also show the usefulness of our calculated institutional quality measures by showing institutional rankings of countries and display changes in countries’ institutional rankings throughout the period.
There are two options for cluster analysis, we could calculate the latent factors within each institutional group either for every country separately throughout the observed period (intra country) or for every year separately for all the countries (inter-country). The intra-country factor analysis is not optimal due to a poor intersection of institutional indicators, and since we have more full observations for each yearly factor analysis when taking the second route, we proceed with the inter-country factor analysis, one for every viable year in the sample.
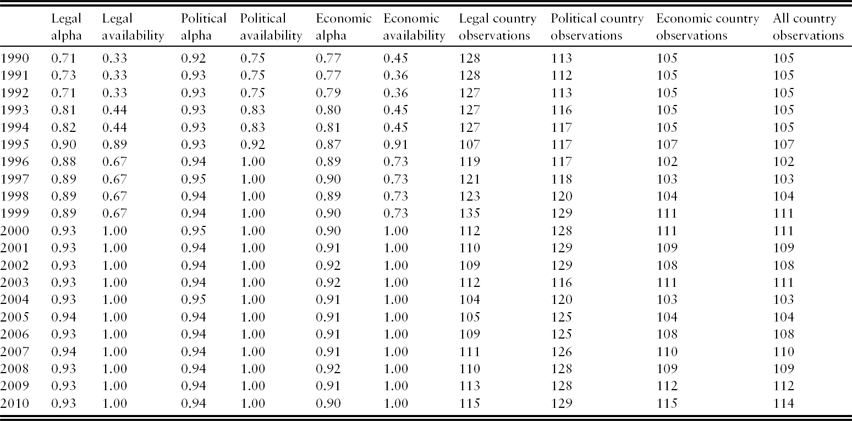
Table 3 shows both the coverage of countries with institutional proxies and their internal consistency within each institutional group, using two measures: Cronbach's alpha (Cronbach, Reference Cronbach1951) (calculated on raw variables) and a simple measure of our own. Cronbach's alpha tells us whether the variables within each group are internally consistent, that is, measuring the same thing. The values range from 0 to 1, and a rule of thumb generally used is that anything above 0.7 is acceptable (Nunnally, Reference Nunnally1978), while values above 0.8 are good and above 0.9 excellent. The legal, political and economic availability indicator is simply the number of usable indicators in a given year as a share of the maximum possible indicators. The calculations based on more indicators are more sound than the calculations based on an available subset; however, less than one-third of the maximum of proxies is never used, which is at least three within legal and economic institutions, and at least four within political institutions. Finally, the last four columns show the number of observations (countries) in each year, which have values for the usable institutional proxies. The last column shows the good coverage of the dataset, as every year, more than 100 countries have full observations for all three institutional groups: legal, political and economic.
Table 3. Internal consistency, reliability and coverage

Source. Own calculation.
We start the factor analysis by first standardizing the variables across countries for each year. When an indicator has a very poor coverage in certain years, that indicator is excluded for those years, as it would otherwise severely limit the coverage of the factor analysis for those years. The factor equation, which breaks the total variance of each institutional indicator on the variance of the common latent factor – communality and indicator-specific variance – is estimated in two steps. First, we estimate the communalities with the principal factor method, which is most appropriate for smaller samples. Next, since we are searching for only one latent factor within each institutional group and thus are not constrained with within factor correlations, we use the orthogonal rotation with the Varimax method, which is most suitable when we want to explain every indicator with one or a minimal number of factors. Factor analysis is very suitable for our purposes, as it allows us to test the hypothesis that each of the institutional groups is homogeneous and can be explained by only one latent factor. This implies that the eigenvalue of the first factor in each group should greatly exceed the eigenvalues of other factors (also, the Kaiser criterion suggests keeping only factors with eigenvalues of greater than one). Putting it differently, the variance of each indicator within each group should be explained well with only one latent factor, if all the indicators in fact point to the same underlying latent institutional quality. The statistics imply that we are right in our assumption that each of the three groups is in fact homogeneous, as the eigenvalue of the first latent factor is always much higher than the eigenvalue of the second factor, in fact, the first eigenvalue exceeds the second one every year by a factor of at least four in legal and political institutions, and at least six in economic institutions.
Additionally, the rule of thumb tells us that every good indicator for the latent factor should have a communality of 0.2 or more (a lower communality implies the indicator is capturing something else than the others), which allows us to test the strength and usefulness of indicators within each group. Practically always the majority of the variance of indicators is explained with the first latent factor, leading us to believe that the first factor is performing well in capturing the latent quality of legal, political and economic environments, respectively, as already Cronbach's alpha would imply. With the exception of ICRG religion in politics indicator and some years for the Labor Market Indicator from the Fraser Institute, all indicators are very strong, implying that overall the indicators chosen do in fact capture the same underlying factors. The factor loadings, that is Pearson correlations of each indicator with the latent factor, point to the fact that the first factor is always highly correlated with the indicators within each institutional group (with the exception already mentioned) and, moreover, that the indicators with the inverse scale load the factor negatively, which implies that the latent factors do in fact represent the quality of the underlying institutional environment monotonically, a higher value of the latent factor thus always implies a better quality of the institutional environment.
The most useful result of the factor analysis are the standardized factor scores, which are generated within each institutional group and year for all the available countries. These values are directly comparable across countries and thus can be used in any international economics application. The yearly coverage with these new measures of institutional quality span for 21 years for all three institutional groups – legal, political and economic, respectively. Wanting to control for all formal institutional quality dimensions in a panel, for instance, leaves us with a 21-year time period and a coverage from 102 to 113 countries, which is a reasonable amount of panel data, as it amounts to 2,251 full country observations.
When interested only in the within-country dynamics, the data regrettably do not facilitate factor analysis. Instead, we take all available indicators and express each country value as a share of the maximum, then compute a country average for every institutional group. This way, we also arrive at three indicative absolute measures of legal, political and economic institutional quality, which reflect solely internal institutional changes, that is how the country is doing in time in relation to itself, not others. For indicators with an inverse scale, the scale is first adjusted. The raw institutional scores are then, in order to adjust for different ranges, recalculated as ![]() $\frac{s-\text{min}_s}{\text{max}_s-\text{min}_s}$, where s stands for an institutional score or value. This procedure neutralizes the scale effects of different indicators, constraints all indicators to the range between zero and one, and thus allows each indicator to be weighted equally when taking the country–year means. Furthermore, not to allow disproportionate impact of any single factor within each institutional group, the means are calculated only for country–years when at least one-third of possible indicators have non-missing values. Since all in all this is a considerably cruder statistical approach compared with the factor analysis for the first set of relative institutional quality measures, it warrants for a careful use of the calculated indicative absolute institutional quality measures.
$\frac{s-\text{min}_s}{\text{max}_s-\text{min}_s}$, where s stands for an institutional score or value. This procedure neutralizes the scale effects of different indicators, constraints all indicators to the range between zero and one, and thus allows each indicator to be weighted equally when taking the country–year means. Furthermore, not to allow disproportionate impact of any single factor within each institutional group, the means are calculated only for country–years when at least one-third of possible indicators have non-missing values. Since all in all this is a considerably cruder statistical approach compared with the factor analysis for the first set of relative institutional quality measures, it warrants for a careful use of the calculated indicative absolute institutional quality measures.
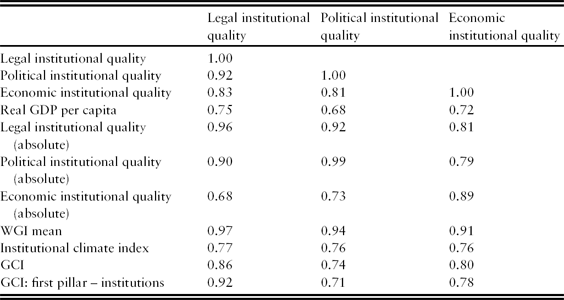
Institutional factor scores are correlated with each other, as shown in Table 4. The legal institutional quality indicator correlates with the political and economic indicators at 0.92 and 0.83, respectively, and the political and economic institutional quality indicators are correlated at 0.81. The remaining factor-specific variance in all three indicators thus implies that they nevertheless capture different dimensions of the institutional environment.
Table 4. Correlations of institutional quality measures

Notes. WGI: Worldwide Governance Indicators; GCI: Global Competitiveness Index.
Source. Kaufmann et al. (Reference Kaufmann, Kraay and Mastruzzi2013); Eicher and Röhn (Reference Eicher and Röhn2007); own calculation.
The calculated institutional quality variables, not surprisingly, also correlate strongly with real GDP per capita (in 2000 USD), with the strength of correlation in the order of legal, economic and political institutional quality, and with other institutional quality measures. Table 4 shows the pairwise correlations between our relative institutional quality measures based on factor analysis, the absolute institutional quality measures, real GDP per capita, the institutional climate index, the mean of the world governance indicators, global competitiveness index and the institutional subpart of the global competitiveness index. All correlations are strongly significant and positive, at a significance level of less than 0.1%, implying a common ground to all institutional quality variables, but at the same time clearly reveal that some variation is specific to our calculated institutional quality variables, which also cover the widest time span compared with other institutional measures. The calculated institutional quality variables can thus easily be used in panel data international economics application.
The quality of the institutional environment by the country and institutional group can also be presented as a ranking of factor scores for all countries and years, which we call WIQR. This ranking for legal, political and economic institutions can simply be constructed for every year of the sample in two ways. The first set of WIQRs is constructed by only including the countries which have all observations on the quality of institutions available in the studied period, which yields 84 countries for legal WIQR, 88 countries for political WIQR and 84 countries for economic WIQR. The second set of rankings is again constructed year by year, but with the inclusion of all available countries in each year. The second set represents the maximal coverage for WIQR in each year, but cannot be straightforwardly compared from year to year, as movements up and down WIQR can be caused either by a country's own changes in the relative quality of the institutional environment or by the inclusion or exclusion in the rankings of other countries. The dataset does, however, facilitate a user with an interest in following a country on rankings which does not have all the values available, to form new WIQRs based on only the sample of countries including the country of interest. This way, the specific WIQRs are then consistent for looking at how the rankings of this specific country change through time.
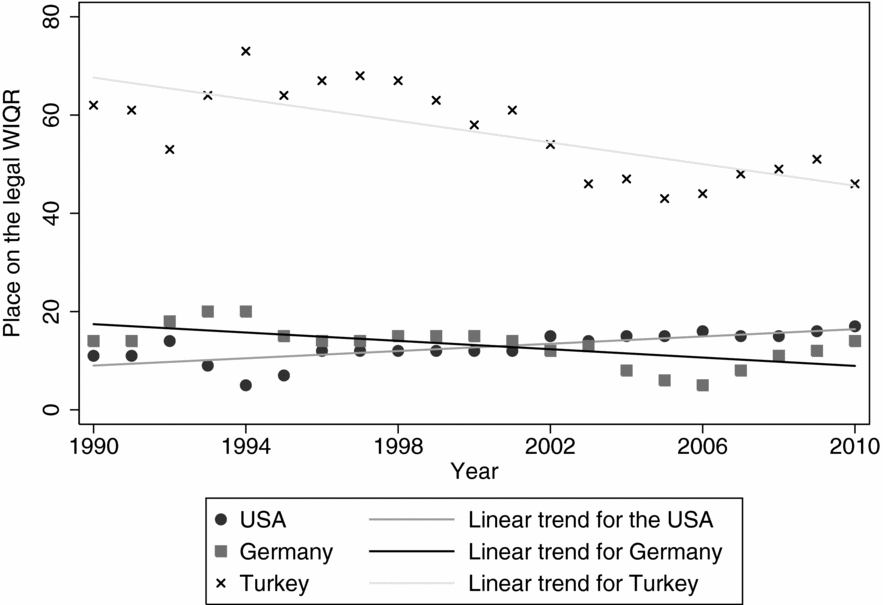
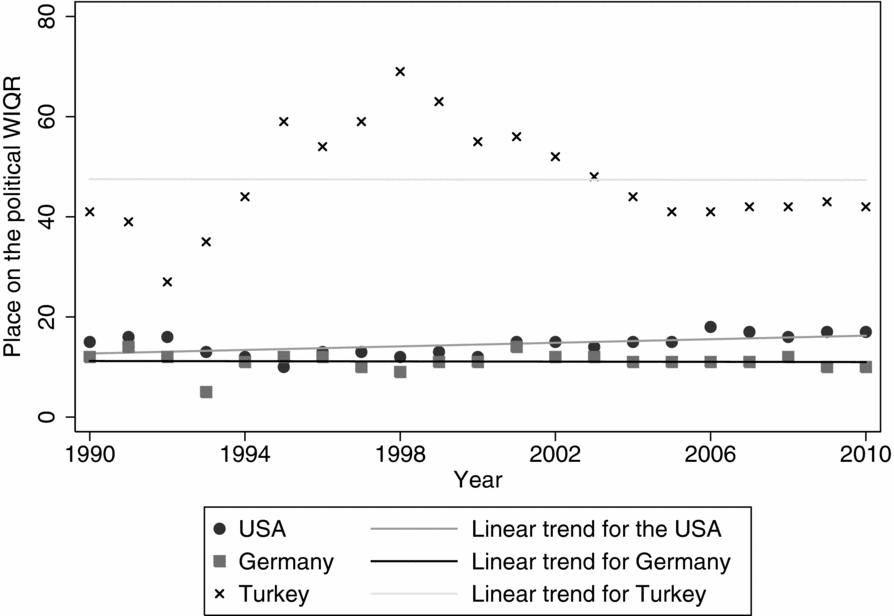
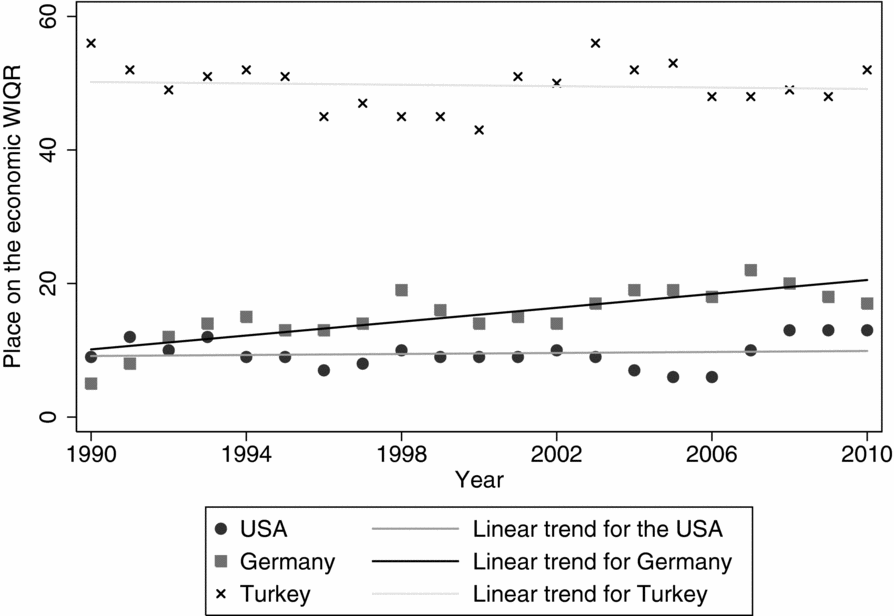
For every country, the ranking in each year for each institutional group can be presented on a graph, which shows how the country is progressing, in terms of institutional quality, relative to other countries in the world. Place on the WIQR for the USA, Germany and Turkey, which all have observations for the entire sample, can be seen in Figure 2 for legal institutions, in Figure 3 for political institutions and in Figure 4 for economic institutions. A negative trend indicates that a country is improving the quality of a given set of institutions through time, relative to the others (climbing the institutional quality ladder), while a positive trend implies a country is losing its institutional competitiveness. The graphs imply that in terms of the relative quality of the legal environment, Germany has been increasing it, overtaking the USA in 2002, which has been losing on the legal front slightly. Turkey, although at a different level – signifying a much worse overall state of the legal environment – shows fastest improvements. In terms of the relative quality of the political environment, Germany has been keeping its place throughout the sample, the USA shows slight regression, while Turkey has been very volatile in this respect, balancing out after 2004 at a slightly better position than it started. Finally, in terms of the relative quality of the economic environment, the USA and Turkey have both been sustaining their position, but on considerably different planes, while Germany has been losing its economic institutional quality, although finally converging with the USA at the end of the period.

Figure 2. Place on the legal WIQR.
Source. Own calculation.

Figure 3. Place on the political WIQR.
Source. Own calculation.

Figure 4. Place on the economic WIQR.
Source. Own calculation.
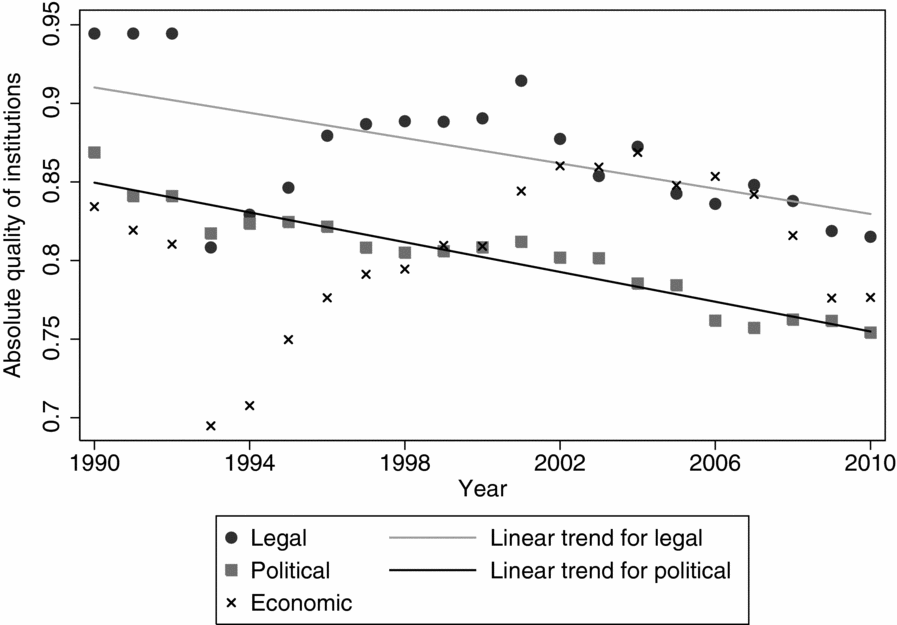
Looking at the relative institutional dynamics of any country in the world, say, the USA depicted in the graphs, the question remains whether the USA is digressing on its legal and political institutional fronts only relative to other countries in the world, that is, other countries are improving their institutional quality faster than the USA, or also in absolute terms. Digressing in absolute terms would imply that the absolute quality of institutions is digressing within the country. A graph of within-USA institutional dynamics with all three institutional absolute quality values is shown in Figure 5. The graph first implies, as have the relative rankings, that the USA is very high up the quality ladder with institutions. Second, it also reveals that the absolute quality of economic institutions does not show a clear trend as it is too volatile, while both legal and political institutional quality seem to be deteriorating. To put it differently, the USA is not digressing on its political and legal institutional quality only because of others, but because of itself.

Figure 5. Absolute quality of institutions.
Source. Own calculation.
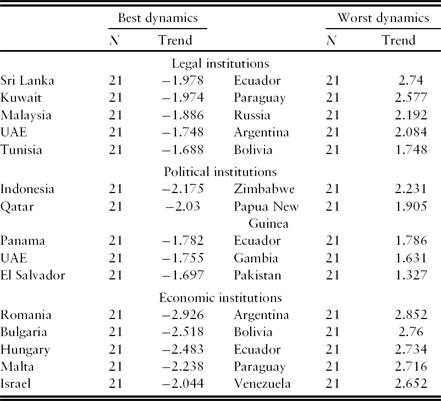
Moreover, we can see who the winners and losers are in terms of institutional dynamics, by comparing country-specific institutional linear trends in all three WIQRs. The bottom five countries with worst dynamics and top five countries with best dynamics are shown in Table 5 for each institutional group, based on the WIQRs for countries with observations in all years. The countries that made the highest strides in terms of the improvements in their relative institutional qualities are the countries that started quite low with the absolute quality of their institutions in the beginning of the 1990s. The progression is quite remarkable, looking, for instance, at the United Arab Emirates reveals that the country took over 22 and 24 countries in the quality of legal and political institutions, respectively. On the other extremes are countries that worsened their institutional systems relative to others. Ecuador, for instance, was in the period beaten by 54, 33 and 42 countries in the quality of legal, political and economic institutions, respectively.
Table 5. Trend changes in World Institutional Quality Rankings

Source. Own calculation.
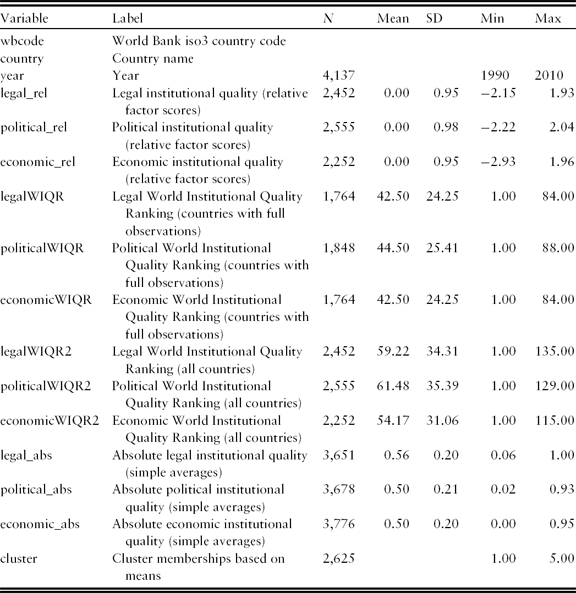
The availability of the factor-analysis-based calculated institutional quality values as well as the simple within-country absolute institutional quality averages is from 1990 to 2010, and ranges from the minimum of 2,252 observations for the relative economic institutional quality, to 3,776 observations for the absolute economic institutional quality. These data are freely available on the author's webpage, as the relative institutional quality values are especially useful in panel data cross-country applications. The dataset includes the world bank iso3 country codes, country names and years, the three institutional quality measures based on relative factor scores, the adjunct WIQRs for all three sets of institutions (one triplet only ranking countries with observations in all periods, one triplet ranking all countries), the three absolute quality of institutions measures and countries’ cluster memberships, as presented in this paper. Appendix B shows the variable names, labels and some basic summary statistics in a table.
Besides the use as controls in panel data applications, some other possible uses of the Institutional Quality Dataset include, but are not limited to, the following research tracks. Using cluster analysis, it is possible to examine whom to look up to and whom not to in terms of institutions, researching institutional role models and rotten apples by looking at the world from an institutional perspective in several different time points, clustering the countries according to the quality of their institutional environment and then highlighting the countries which switched from worse to better clusters, the role models, and countries which switched from better to worse clusters, the rotten apples. Cluster analysis and the use of multiple indicators is a necessity, as the use of only one indicator can often be misleading, especially in country groupings, rankings or comparisons. A natural prerequisite and a research topic on its own is the institutional structure of the world and how it changes, an extension to the static New Institutional World Order map in this paper. A similar and interesting line of research includes the question of institutional convergence, where the data allow for researching whether countries in different regions in the world converge on the quality of their institutional environment or not. From the available data, institutional risk, change and contagion can also be extracted, where one can look at how institutional changes across countries and time are connected to each other, examining patterns of institutional change around the world and quite possibly using these institutional risk measures as international business risk indicators. The applications are plentiful, and the dataset is constructed with keeping these issues in mind, and making the data as user friendly as possible.
To test the robustness of the calculated latent qualities of legal, political and economic institutions, we compare the calculated values of this paper with the values from the first working version of the paper available as Kuncic (Reference Kunčič2012), where some indicators used are different, as well as the procedure before factor analysis includes some additional data modifications. Comparing the Institutional Quality Dataset of this paper with the working version dataset, four legal institutional proxies are dropped and one added, three political institutional proxies are dropped and one added, and one economic institutional proxy is dropped and four added. The pairwise Pearson correlation coefficients between the ‘old’ and the ‘new’ extracted latent institutional qualities are 0.98 for legal, 0.98 for political and 0.94 for economic institutional quality. This serves as a robustness check that in fact including or excluding some particular institutional measures from our analysis does not change the calculations much. As the list of the proxies used in the analysis depends on some argumentative choices, and could, in some respects, be either expanded or reduced, this reassures us that the procedure used in this paper and the resulting dataset has a certain measure of robustness.
As a final note, since the dataset has been constructed out of many sources, using several statistical aggregation procedures, the choice when deciding for a criterion for the inclusion of some calculated statistic was always between the inclusion of more values and higher volatility with outliers on one side, and less data and a more stable data series, but also much poorer in terms of time and country coverage, on the other. The decision was predominantly in favor of the first one, which also implies that outliers are bound to occur in the dataset. These statistical artifacts should thus be discounted when discovered.
5. Conclusion
The aim of this paper is to first define and discuss different classification systems of institutions, and then to bring an appropriate institutional classification system to the data and compose a dataset of underlying institutional quality for every country in the world and for a longer time period. We collect more than 30 institutional indicators widely used in the literature that have a reasonable time span and coverage, and use the institutional classification based on subject category to group them into three sets of formal institutions: legal, political and economic. We then extract the true underlying institutional qualities for legal, political and economic institutions and show how the results can be used for social science research.
Looking at how countries cluster together in terms of their average institutional quality in the studied period reveals that countries can be clustered into five clusters, which roughly correspond with levels of development. The most developed countries in terms of income, longevity and literacy are also ahead in the quality of all three sets of institutions. The second most developed group follows both in terms of development and quality of institutions. The following two clusters are more mixed. One is composed of almost exclusively Muslim countries, which have reasonably good institutions with the exception of oppression of the press and some other groups in the society, as well as poor democratic accountability. The other cluster is reasonably bad on all three institutional fronts, with a slightly better result in the quality of political institutions. The last cluster of countries is the least developed countries of the world, having worst quality of all three sets of institutions, facing the failed or failing state problem at one point or another and currently include almost three billion people.
Turning from a snapshot picture of the world to how the quality of institutional environment changes in time on a country level, we search for a common latent dimension within each institutional group and each year. First, factor analysis confirms that our three groups of institutional indicators are very homogeneous within, as the first latent factor within each group of institutions captures the large majority of the total variance. Second, the empirical indicators chosen perform well and share a reasonable amount of variance in each year within each institutional group. Within each institutional group, we calculate the latent factor scores for every country in the world and each year, which capture the relative institutional quality. Although the legal, political and economic latent institutional qualities are correlated, they vary enough to capture three different dimensions of the formal institutional environment. All the countries are ranked on all of the three institutional quality measures in every year, yielding a set of rankings we call WIQR. WIQR for legal, economic and political institutions shows the relative competitiveness of every country in the world and every year, in terms of the quality of the underlying institutional environment. As a demonstration, we track the evolution of ranking on all three WIQR scales for the USA, Germany and Turkey, and display the use of calculated latent institutional variables.
Additionally, using scaled averages of raw institutional indicators within each group, we also calculate the within-country, absolute values for the quality of legal, political and economic institutions. This allows us to track the dynamics of a country first relative to other countries in the world using the relative calculations based on factor scores, and then also in absolute terms. A country digressing in terms of institutional quality relative to other countries might simply be progressing slower than others in absolute terms, or, it might also be digressing in absolute terms, which can be checked with the comparison of relative and absolute institutional qualities.
In terms of panel applications of the calculated relative quality of institutions variables, values for all three institutional groups at the same time are available in a 21-year time period and cover more than 100 countries each year, which is a reasonable amount of data. The calculated latent institutional quality variables can easily be used in panel data international economics applications when formal institutions should be controlled for, thus the data are publicly available at the author's website http://sites.google.com/site/aljazkuncic/. The dataset also includes the yearly place on the WIQR for every country, indicators of absolute quality of institutions (more appropriate for tracing institutional quality changes within a country), and also average countries’ cluster memberships.
Our aim is to contribute to the formation of a solid source for a social science analysis where institutions are either the center of attention or should be taken into account. Institutional Quality Dataset is an honest attempt in this direction and should be explored, critiqued and improved in the future.
Appendix A. Data
There are some specifics in terms of the availability of institutional proxies. Economic freedom of the world indicators have been produced on a yearly basis from 2000 onward, while earlier they were computed on a 5-year basis. Instead of imputing the values for the period from 1991 to 1994 and 1996–1999, we opt for having an unbalanced panel for those indicators except for three economic institutions indicators (E5, E6 and E10), where linear imputation is used in order to have enough observations in the early 1990s for later calculations. With the Rule of Law index from the World Bank WGI (L9), the missing years (1997, 1999 and 2001) are imputed as the average values of the year before and after. With the Freedom of the Press indicators from the Freedom House (L2, P1, E4), there is a significant break in the series due to a changed methodology from 1995 to 1996 and from 2000 to 2001. This does not represent a problem in cross-country comparison though, since the same break is present for all the countries, but caution is needed when dealing with within-country aggregation in time, which is taken into account. Finally, in all cases of Serbia and its adjoined states from 1990 to 2010, the country code assigned to the entity (which varied in its geographical coverage) is Serbia, since it was the dominant country in the entity throughout the period.
Appendix B. Dataset variables
Table B1. Institutional Quality Dataset variables


