INTRODUCTION
Cytomegalovirus (CMV) infection may be the cause of mental retardation and deafness in newborns, infectious mononucleosis syndrome in young adults, and also pose a threat for immunosupressed individuals. CMV becomes latent after primary infection.
CMV infection presents distinct phases of transmission with a different age-dependence from other directly transmitted viral diseases. Seroprevalence data from high-incidence CMV communities revealed that CMV infection occurs initially during the first 3 years of life, stabilizing until the beginning of adolescence, when seroprevalence increases again [Reference Almeida1, Reference Fang2]. These observations suggest that the force of infection, defined as the per capita rate at which susceptible individuals acquire infection, may be represented by a bimodal pattern. The increase in seroprevalence in teenagers may be related to sexual activity [Reference Coonrod3]. Immunization strategies should consider infants and teenagers whenever CMV vaccine is first introduced in a population.
An average of 1% of all infants are infected with CMV in utero, and it appears that more infants were damaged by CMV infection than by infections such as rubella or Haemophilus influenzae type b meningitis before vaccination reduced the incidence of these infections [Reference Plotkin4].
It has long been demonstrated that routine immunization of healthy women aged 15–25 years is cost-effective even in populations with CMV seroprevalence as high as 87% [Reference Porath5], but at present there is no available CMV vaccine. It is, however, likely that a vaccine will be available in the near future [Reference Pass6] and therefore optimal immunization strategies should be considered based on the population dynamics of CMV.
Griffiths et al. [Reference Griffiths, McLean and Emery7] have modelled CMV population dynamics and control by vaccination assuming lifelong immunity and a constant force of infection, which is a limitation when considering optimal strategies for vaccine introduction into a population.
The aim of this study is to develop a mathematical model for CMV dynamics in order to evaluate the impact of vaccination in congenital cases and infection in individuals, estimating an age-dependent force of infection from seroprevalence data using mathematical modelling, and analysing the effects of different scenarios: varying age of vaccination, immunity waning, vaccine efficacy and mixing patterns.
METHODS
Serological data
Serological data from São Paulo, Brazil, were used do determine the age-dependent seroprevalence (0–40 years age group) [Reference Almeida1].
Mathematical model
The model proposed has five state variables dependent on age a: proportion susceptible, s(a); harbouring and incubating CMV, h(a); infectious, i(a); latent, l(a); and vaccinated, v(a) individuals (Fig. 1), solved by the following differential equations:
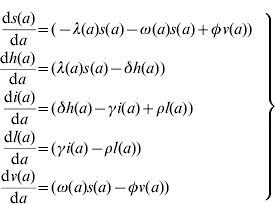
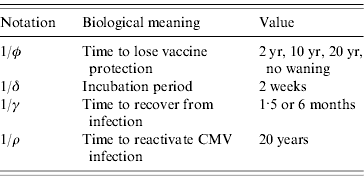
where ω(a) is the force of vaccination (rate of vaccination as in [Reference Amaku8]), δ is the inverse of the incubation period, γ is the inverse of time to recover from infection to become latent, φ is the inverse of time taken to lose the protection given by vaccine (immunity waning), ρ is the rate latent individuals reactivate CMV infection. Values for constant rates like δ, γ, φ and ρ are not well known. The evidence available in the literature is related to severe cases and is not representative of the average infection. There is some controversy regarding the time to recover from CMV infection. Therefore two different values for γ were used in the simulations (Table 1). The Appendix shows how the system of equation (1) is derived from the number of individuals in each compartment.
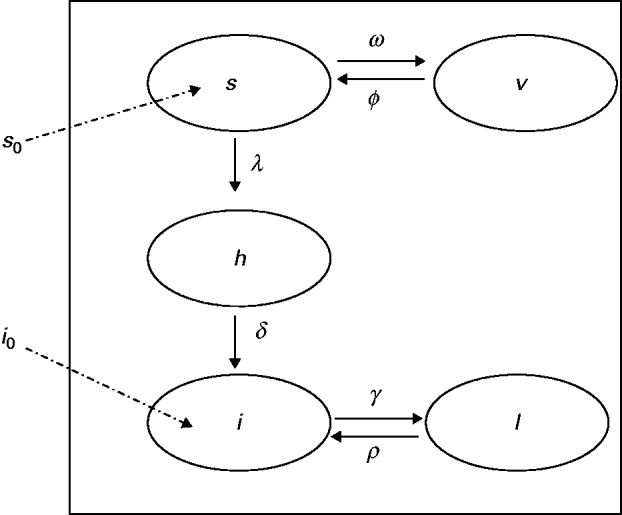
Fig. 1. Compartmental model showing the proportion of individuals in relation to CMV infection status, namely: s, susceptible; h, harbouring and incubating CMV; i, infectious; l, latent and v, vaccinated individuals. The transition rates in compartments are indicated (Greek letters; see text for details). The proportions of newborns susceptible (s 0) and infected (i 0) are also indicated.
Table 1. Notation, biological meaning and values assumed of the parameters used to simulate scenarios with the mathematical model
The force of infection λ(a), defined as the per capita rate at which susceptible individuals acquire infection, is given by [Reference Amaku8]:
where β(a, a′) is the contact rate for individuals of age a with individuals of age a′. From seroepidemiological data published previously [Reference Almeida1], it was observed that seroprevalence increases in two distinct phases separated by an almost stable plateau.
In order to fit the seroprevalence profile above, the contact rate matrix may be represented by combining age groups in the following manner: children–children (peak 1), adults–adults (peak 2), children–adults (peak 3) and adults–children (peak 4).
Based on this profile, we selected a composition of gaussian functions to represent β(a, a′). The resulting ad hoc function is the following:
![\eqalign{ \beta \lpar a\comma a'\rpar \equals \tab b_{\rm \setnum{1}} \exp \left\{ { \minus {{\rm 1} \over {\rm 2}}\left[ {\left( {{{a \minus \bar{x}_{\rm \setnum{1}} } \over {\sigma _{\rm \setnum{1}} }}} \right)^{\rm \setnum{2}} \plus \left( {{{a' \minus \bar{x}_{\rm \setnum{1}} } \over {\sigma _{\rm \setnum{1}} }}} \right)^{\rm \setnum{2}} } \right]} \right\} \cr \tab \plus b_{\rm \setnum{2}} \exp \left\{ { \minus {{\rm 1} \over {\rm 2}}\left[ {\left( {{{a \minus \bar{x}_{\rm \setnum{2}} } \over {\sigma _{\rm \setnum{2}} }}} \right)^{\rm \setnum{2}} \plus \left( {{{a' \minus \bar{x}_{\rm \setnum{2}} } \over {\sigma _{\rm \setnum{2}} }}} \right)^{\rm \setnum{2}} } \right]} \right\} \cr \tab \plus b_{\rm \setnum{3}} \exp \left\{ { \minus {{\rm 1} \over {\rm 2}}\left[ {\left( {{{a \minus \bar{x}_{\rm \setnum{1}} } \over {\sigma _{\rm \setnum{3}} }}} \right)^{\rm \setnum{2}} \plus \left( {{{a' \minus \bar{x}_{\rm \setnum{2}} } \over {\sigma _{\rm \setnum{3}} }}} \right)^{\rm \setnum{2}} } \right]} \right\} \cr \tab \plus b_{\rm \setnum{4}} \exp \left\{ { \minus {{\rm 1} \over {\rm 2}}\left[ {\left( {{{a \minus \bar{x}_{\rm \setnum{2}} } \over {\sigma _{\rm \setnum{4}} }}} \right)^{\rm \setnum{2}} \plus \left( {{{a' \minus \bar{x}_{\rm \setnum{1}} } \over {\sigma _{\rm \setnum{4}} }}} \right)^{\rm \setnum{2}} } \right]} \right\} \cr}](https://static.cambridge.org/binary/version/id/urn:cambridge.org:id:binary:20160921000736986-0409:S0950268811000343:S0950268811000343_eqn3.gif?pub-status=live)
where b 1, b 2, b 3 and b 4 are parameters related to the amplitude; ![]() and
and ![]() are the average ages of transmission for children and adults, respectively; and σ1, σ2, σ3 and σ4 are the standard deviations related to the width of the function in each peak.
are the average ages of transmission for children and adults, respectively; and σ1, σ2, σ3 and σ4 are the standard deviations related to the width of the function in each peak.
In the model, we tested three different mixing patterns regarding the combination of those peaks: pattern I – peaks 1 and 2 (assortative matrix); pattern II – peaks 2 and 3 and peak 4 (CMV is not transmitted among children); pattern III – the four peaks contributing to CMV transmission.
In order to estimate the parameters of β(a, a′), a continuous seroprevalence function, given by i(a)+h(a)+l(a), was used to fit the seroprevalence data by an iterative algorithm that minimizes the residuals between the curve and the observed proportion of seropositives in each age group to reproduce the observed seroprevalence curve.
The boundary conditions are s(0)=s 0, i(0)=i 0, h(0)=l(0)=v(0)=0, with
and
where s 0 and i 0 are the proportions of susceptible and congenitally infected newborns, respectively, s 0+i 0=1, keeping the population constant, Ψ0([a i, a f]) and Ψv([a i, a f]) are the proportions of new infections between ages a i and a f before and after vaccination, respectively, estimated by [Reference Amaku and Azevedo9]:
and
The age interval a i=10 years to a f=40 years corresponds to the fertile period when vertical transmission is likely [Reference Fernandes10], introducing infected newborns to compartment i(a). It is accepted that 1% of newborns are infected in utero by CMV [Reference Plotkin4]. In our model we assumed that with vaccination a decrease in incidence of infected newborns will occur, expressed in equation (5).
Vaccine characteristics assumptions
Candidate vaccines under phase 2 trials are live-attenuated or recombinant vaccines [Reference Plotkin, Plotkin, Orenstein and Offit11]. From a theoretical perspective, live-attenuated virus vaccines have the potential capacity to mutate and regain virulence as they replicate in the vaccinee, as observed for poliomyelitis oral vaccine [Reference Sutter, Kew, Cochi, Plotkin, Orenstein and Offit12]. Another safety issue, when dealing with a herpes virus like CMV, is the fact that such viruses become latent in their hosts, being able to cause disease by reactivation some time in the future [Reference Kenneson and Cannon13]. Considering such characteristics, our study proposes the modelling of immunization strategies using the efficacy profile of a recombinant vaccine against CMV already tested in phase II trials.
In a phase II clinical trial carried out by Pass et al. [Reference Pass6], recombinant subunit vaccine of CMV envelope glycoprotein B (gB) with MF59 adjuvant was able to prevent maternal CMV infection between pregnancies in a high-risk population of women of childbearing age, with an estimated efficacy of 50% (95% CI 7–73) after a three-dose immunization schedule. Considering this product as a plausible candidate for use in the near future, it is reasonable to simulate four different efficacy scenarios, namely: 10%, 30%, 50% and 70% of vaccine efficacy resulting from the three-dose schedule.
Another aspect for evaluation is how immunity waning derived from vaccination will affect the epidemiology and control of CMV in the population. In this sense, the waning of immunity was varied from no waning to the loss of protection in time intervals of 2, 10 and 20 years after vaccination. The inverse of immunity waning time is the rate φ, in equation (1).
Vaccination strategies
To run the model, we fixed the vaccination coverage against CMV at 90%, assuming the WHO Executive Board minimum target vaccination coverage for measles elimination [14].
There is a special interest in determining the optimal age of vaccination in planning the introduction of a new vaccine. In this sense, we departed from past experience and considered the following age intervals already in the immunization calendar of many countries: 2–6 months combined with IPV or DPT vaccines; 12–15 months with MMR vaccine; 10–11 years close to HPV vaccine.
RESULTS
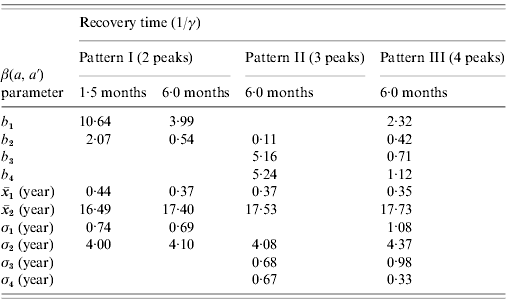
The fitting parameters for each ad hoc contact rate β(a, a′) function are presented in Table 2, considering hypothetical and plausible mixing patterns. The three-dimensional graphs of β(a, a′) are shown in Fig. 2 for recovery time of 6 months. These figures describe the intensity of transmission contacts between susceptible and infected children and adults. Peak 2 (adult–adult) appears in all patterns, being less evident in pattern II (three peaks), when children–adult mixing is considered for the transmission of CMV. If children–children (peak 1) is assumed an important means of CMV transmission, peaks 3 and 4 (children–adult mixing) lose amplitude, contributing less to the infection spread.
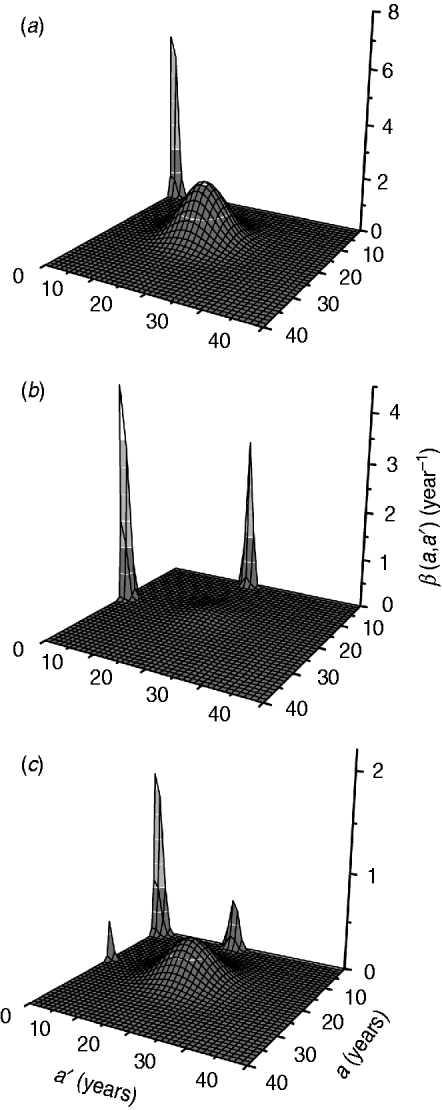
Fig. 2. Contact rate β(a, a') obtained by fitting the model to the seroprevalence data from Caieiras, São Paulo, Brazil, for a recovery time of 6 months and different mixing patterns: (a) pattern I; (b) pattern II; (c) pattern III.
Table 2. Fitting parameters of ad-hoc contact rate functions β(a, a′) according to hypothetical different mixing patterns of children and adults
The combined gaussian functions (mixing patterns) are used to estimate the outcomes of different vaccination scenarios, beginning with pattern I (two peaks).
The first scenario explored the optimal age of immunization considering vaccine efficacy of 50% and vaccination coverage of 90%, which combined results in an effective immunization of 45% of susceptible individuals, with no immunity waning. The results of three different age intervals (2–6 months, 12–15 months, 10–11 years) for the introduction of CMV vaccine are shown in Fig. 3, considering mixing pattern I.
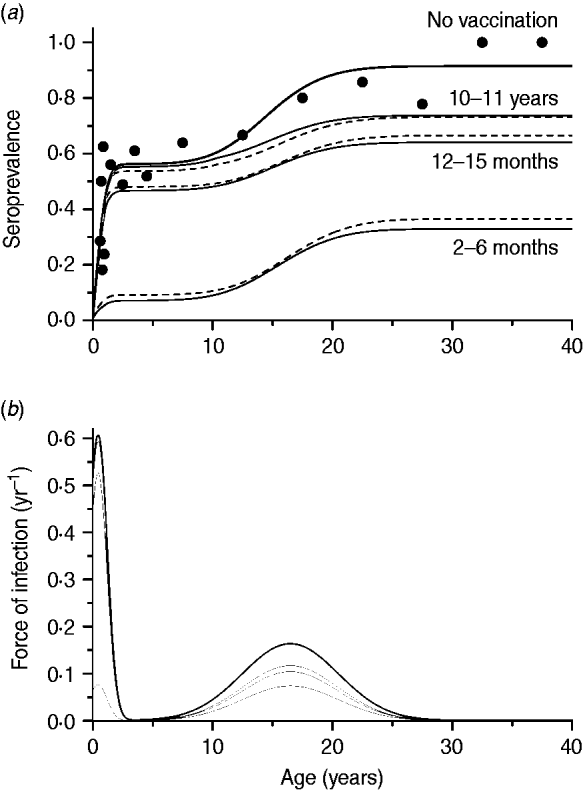
Fig. 3. (a) Seroprevalence of CMV derived from natural infection for three different immunization schedules considering a vaccine efficacy of 50% and a vaccination coverage of 90%, compared to no vaccination (solid and dashed lines for recovery time of 1·5 and 6·0 months, respectively) and serological data from Caieiras, Brazil (•). (b) Age-dependent force of infection related to the strategies above for a recovery time of 1·5 months, assuming mixing pattern I.
The second scenario, using the optimal age of vaccination as 2–6 months, evaluated the impact of immunity waning varying as follows: 2, 10 or 20 years to lose immunity after vaccination, and no immunity waning. The same effective immunization (45%) was used in this simulation as well as mixing pattern I. The resulting curves are shown in Fig. 4.
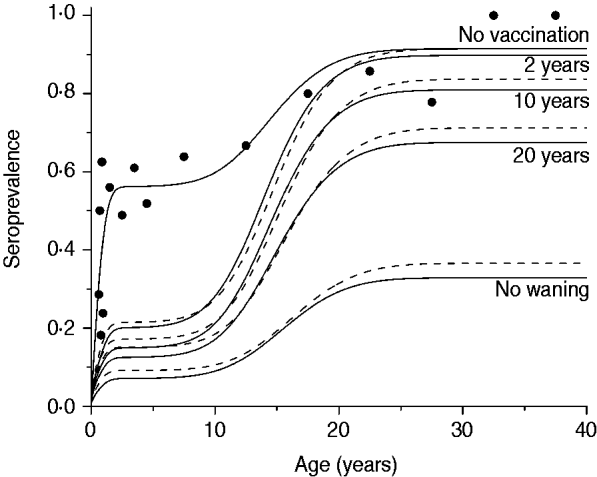
Fig. 4. Seroprevalence of CMV derived from natural infection considering four possible scenarios of vaccine immunity waning (time to lose protection in years) for immunization from 2 to 6 months with 50% efficacy and 90% coverage, compared to not introducing CMV vaccine (solid and dashed lines for recovery time of 1·5 and 6·0 months, respectively), assuming mixing pattern I. Serological data are presented as dots (•).
The third scenario shows what would happen if the vaccine efficacy varied from 10% to 70%, according to the confidence interval estimated by Pass et al. [Reference Pass6], with no immunity waning and the age of vaccination between 2 and 6 months. Results of this simulation for mixing pattern I are shown in Fig. 5.
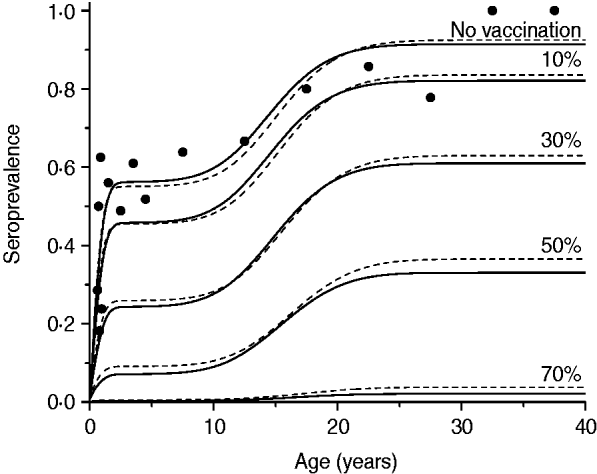
Fig. 5. Resulting CMV seroprevalence considering four vaccine efficacy values (10%, 30%, 50%, 70%) immunizing 90% of the population aged 2–6 months compared to no vaccination at all (solid and dashed lines for recovery time of 1·5 and 6·0 months, respectively). Mixing pattern I was assumed. Caieiras serological data are plotted as dots (•).
The last scenario for mixing pattern I considers the impact of immunity waning on the proportion of new congenital cases (i 0) for three immunization schedules, namely: 2–6 months, 10–11 years, and the combination of both (Fig. 6).
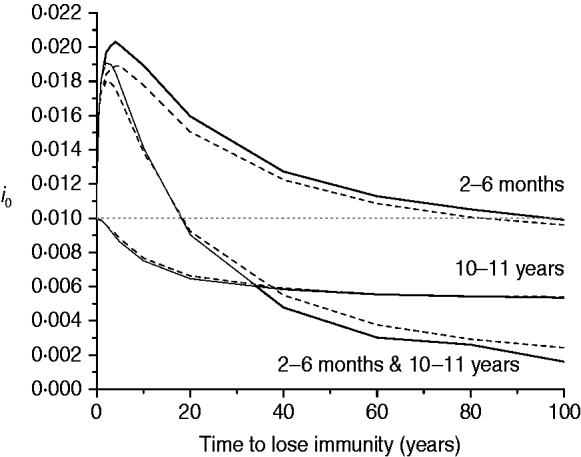
Fig. 6. Proportion of new congenital infections (i 0) estimated for immunity waning (time to lose immunity in years) considering three immunization schedules (2–6 months, 10–11 years, and both combined) with 50% efficacy and 90% vaccination coverage (solid and dashed lines for recovery time of 1·5 and 6·0 months, respectively), assuming mixing pattern I.
It is worth noting that when recovery time is varied between 1·5 and 6 months there is a small variation in the seroprevalence profile after immunization as seen in Figures 3–6. Therefore, for evaluating patterns II and III compared to pattern I an average recovery time of 6 months will be adopted for CMV infection.
Taking the seroprevalence in adults (aged >30 years) as an endpoint of successful CMV transmission in the population, it is possible to compare how the transmission pattern affects immunization according to vaccine characteristics.
Finally, we calculated the proportion of new congenital cases (i 0) for three immunization schedules (2–6 months, 10–11 years, and a combination of both) related to immunity waning for the three mixing patterns (Fig. 7).
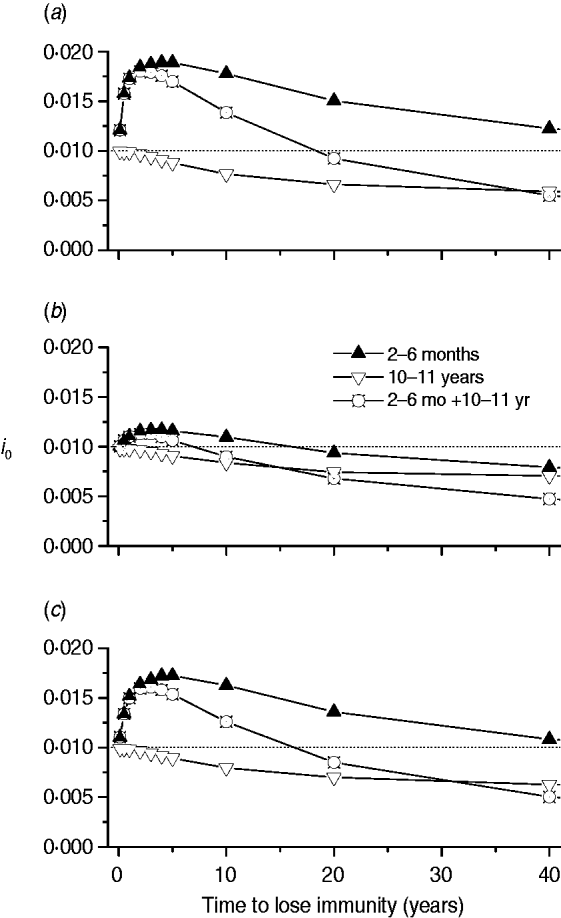
Fig. 7. Proportion of new congenital cases (i 0) for three immunization schedules (2–6 months, 10–11 years, and both combined) according to immunity waning for the three mixing patterns, namely: (a) pattern I; (b) pattern II; (c) pattern III.
DISCUSSION
The development of a CMV vaccine has been a challenge for decades. Recently, some candidate products were tested in clinical trials revealing promising results, although efficacy is still around 50% and no evaluation of immunity duration is currently available.
The present work simulates different scenarios departing from the characteristics currently known for existing vaccines, and varies age at vaccination, immunity waning, vaccine efficacy and mixing patterns. From those quantitative calculations the impact on congenital infections was verified.
The age-dependent force of infection is usually modelled using unimodal functions [Reference Farrington15]. To analyse CMV infection dynamics in a more appropriate way, considering that the force of infection observed in some countries [Reference Almeida1, Reference Fang2, Reference Lübeck, Doerr and Rabenau16] exhibits a biphasic age-related rise, we used a bimodal force of infection instead. The first rise reflects inter-family contacts and also contacts with other children at school, and the second rise is probably related to sexual activity [Reference Almeida1, Reference Coonrod3, Reference Lübeck, Doerr and Rabenau16].
Our results indicate that the optimal age for a single vaccination interval is from 2 to 6 months if there is no immunity waning (Fig. 3). Congenital infection may increase if immunity waning occurs before 20 years, as can be seen in Figures 6 and 7. This is an important issue to consider when planning the introduction of a partially efficacious vaccine, like the one being considered here. There is a perspective that vaccine efficacy may be enhanced by the induction of epithelial entry-specific neutralizing antibodies [Reference Cui17].
Immunity duration of <10 years may lead to an increase of congenital disease when immunization is administered to lower ages, e.g. 2–6 months (Figs 4, 6, 7). If this is the case, natural immunity conferred by CMV infection is more efficacious than a vaccine with short-immunity duration administered to children. This result from the model is supported by the observation made by Fowler et al. [Reference Fowler, Stagno and Pass18] that naturally acquired immunity reduces the risk for congenital CMV infection by 69%.
On the other hand, considering the case of short-duration immunity conferred by the vaccine, it is better to introduce CMV vaccination to 10-year-old individuals which may reduce neonatal infection as predicted by the model presented (Figs 6, 7).
It is possible to reduce CMV incidence with 50% vaccination coverage (Fig. 5), in agreement with other authors [Reference Griffiths, McLean and Emery7] who assumed lifelong vaccine protection and immunization of newborns. Our model considered that a potential immunity waning could lead to a risk of infection in young people of fertile age, thereby increasing congenital infection incidence. Therefore it is important to be aware of this characteristic before planning a mass immunization programme.
Even with 90% immunization coverage, vaccine efficacy combined with immunity waning may generate counter-intuitive outcomes, making it necessary to explore each alternative using quantitative tools.
Congenital disease increased when the mixing pattern included transmission among children with a short-protection duration vaccine (Fig. 7). This may be due to the fact that natural infection is postponed until the fertile age when applying an immunization schedule between ages 2 and 6 months.
Mixing patterns I and III, which include transmission among children, generate similar outputs regarding congenital disease, showing that immunity waning is a critical characteristic of a CMV vaccine to be considered before introduction of a control strategy. If CMV transmission in a population follows mixing pattern II (children–adults and adults–children), the impact on congenital disease control is better than for the other two mixing patterns if vaccine immunity duration is <20 years.
Some other aspects related to CMV and human interactions are not fully understood at present. For example, recent work has shown that different strains of CMV circulate in the population causing congenital infection in newborns of women previously known to be seropositive for another CMV strain [Reference Yamamoto19]. This evidence will open another front of work and development both for the vaccine and immunization strategies, modelling included.
In conclusion, vaccination strategies evaluated by the present model were optimal when vaccination is scheduled before age 1 year combined with a second dose at 10–11 years if immunity is sustained for at least 20 years, surpassing the second peak of the force of infection. Therefore, revaccination should be considered in the immunization calendar.
APPENDIX
Here, we show how to derive the system of equation (1). S(a), H(a), I(a), L(a) and V(a) are the number of Susceptible, Harbouring and incubating, Infectious, Latent and Vaccinated individuals with age a. The following system of differential equations can be used to describe the dynamics of human CMV infection in a population (Fig. 1) in steady state:
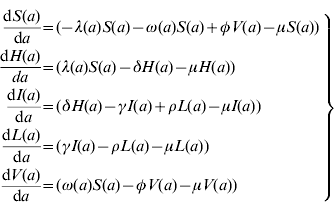
where μ is the natural mortality rate and the other rates are as defined in the main text. Note that the force of vaccination, ω(a), acts only in the susceptible compartment and no vaccine effect is expected on the individuals in the latent state.
Considering that the total number of individuals with age a is given by
we have
We can define the proportions of susceptible s(a), harbouring and incubating CMV h(a), infectious i(a), latent l(a), and vaccinated v(a) individuals as

Considering the definition for s(a), we have S(a)=s(a)N(a). Differentiating S(a) with respect to a (age) gives
and, using equation (10), we find

Dividing the first equation of system (8) by N(a), and taking into account the definitions for the proportions [equation (11)] and equation (13), we obtain the equation for the proportion of susceptible individuals with age a
which is the first differential equation of system (1). Note that equation (14) does not depend on mortality rate μ.
The differential equations for h(a), i(a), l(a), and v(a) can be derived analogously.
ACKNOWLEDGEMENTS
We are grateful for the support of Conselho Nacional de Desenvolvimento Científico e Tecnológico–CNPq.
DECLARATION OF INTEREST
None.


