Introduction
Estimation of the role of wind in mass exchange between surface and atmosphere is important for various fields of atmospheric and environmental sciences. Even in the case of soils, such exchange is believed not to be limited to heat fluxes. Calculations have been made showing that under specific conditions the heat balance of the soil surface, at least in deserts, requires an additional term, which is likely to be related to wind propagation into sand (Reference Kazanskiy and ZolotokrylinKazanskiy and Zolotokrylin, 1994).
In the case of snow, with its high porosity, such propagation is to be expected. Though the measurements (Reference DubrovinDubrovin, 1965; Reference Ōura, Ishida, Kobayashi, Kobayashi, Yamada and ŌuraŌura and others, 1967; Reference KobayashiKobayashi, 1969) show air-flux velocities of l0–2 to 10–1 m s–1 inside snow, the data could not be considered as evidence of the process, because recalculation of the air discharge from a borehole or results of measurements by hot-wire anemometers situated in cavities were not necessarily related to the air flux in the pore space. However, the above-mentioned results led Reference YosidaYosida (1977, Reference Yosida1978a, b, c) to model the process, and it was shown that wind over the snow surface could produce horizontal air flux in the pore space of snow.
The mechanism responsible for the appearance of air flux inside snow was later accepted to be variations in surface air pressure (windpumping). Three scales of such ˚pumping" are suggested: (1) barometric, or related to large-scale atmospheric-pressure variation; (2) topographic, or caused by pressure difference around sastrugi or dunes; and (3) turbulent pressure perturbations, related to conditions in the near-surface ˚boundary layer". The theoretically calculated air-flux velocity caused by topographic wind-pumping is about 3.5 × KT2 m s–1 (Reference ColbeckColbeck, 1989). The other two kinds of windpumping are accepted to be negligibly small for air flux in pore-space formation.
The air flux is believed to form specific air-convection patterns in snow, the size of which depends on the scale of pressure variation over the surface. Snow layering reduces the importance of the process for the whole snow cover, but it remains important for the near-surface snow (Reference AlbertAlbert, 1996; Reference ColbeckColbeck, 1997). Air-flux modeling has mainly featured in work on paleoclimatic reconstruction from glacier ice cores. It is believed that the air flux could have a significant effect on two processes: the chemical and isotopic transfer in firn (Reference Cunningham and WaddingtonCunningham and Waddington, 1993; Reference Harder, Warren, Charlson and CovertHarder and others, 1996; Reference Waddington, Cunningham, Harder, Wolff and BalesWaddington and others, 1996), and heat production caused by viscous friction (Reference Clarke, Fisher and WaddingtonClarke and others, 1987), related in this work to turbulent pressure perturbations.
The influence of air flux on the temperature field in snow was first estimated from the viewpoint of possible thermal natural convection in natural snow cover. Overwinter temperature field observations (Reference SturmSturm, 1991) suggested the presence of convective air moving in snow, which involved both vertical and horizontal air fluxes, with an air velocity of 2 × 10⁻⁴ to KT3 m s–1 Modeling done on the basis of an experimental study of the thermal-convection mechanism (Reference Powers, Colbeck and O’NeillPowers and others, 1985) gave an air velocity of 4 × 10⁻³ ms–1. Even such small values were expected to be very important in the construction of temperature distributions and energy balance in snow cover (but cf Reference KleverKlever, 1985), and of course much higher values of air flux, expected in the presence of wind over the snow surface, had to be noticeable in results of temperature-distribution measurements in natural conditions.
A field experiment with imposed wind over a light, new seasonal snow surface showed clear evidence of temperature change throughout the snow-cover depth (30 cm) when wind appeared (Reference Albert and HardyAlbert and Hardy, 1995). The data were in agreement with modeling of a horizontal air flux possibly caused by horizontal pressure difference (Reference AlbertAlbert, 1993). However, the temperature measurements in polar firn showed that the vertical temperature distributions were more likely related to horizontal conduction than to windpumping (Reference Brandt and WarrenBrandt and Warren, 1997). Such a small amount of observed data does not allow the validity of existing models to be checked or conclusions to be made about the scale and mechanism of the wind propagation to snow.
The present paper shows the first results of laboratory measurement of the temperature field in artificial snow cover situated in a wind tunnel with and without wind over the snow surface. The purpose of the experiments was to find out whether wind forms air fluxes in the pore space of snow, and, if so, what mechanism might be responsible for forming such fluxes.
Experimental Procedure
The wind tunnel had dimensions of 1 m × 1 m × 14 m Snow for the experiment was produced in a cryospheric environmental simulator at the National Research Institute for Earth Science and Disaster Prevention, Shinjo, Japan (Reference Higashiura, Izumi, Nakamura and SackHi-gashiura and others, 1997) (the snowflakes were grown from water vapor), and settled for 3 days (the final depth being 0.4–5 m). After that, without disturbance, the artificial snow cover was cut into 0.8 m × 0.8 m snow blocks and placed in the wind tunnel. Gaps between the blocks were filled with sifted snow, and snow occupied the last 7 m of the wind tunnel. The vertical sides of the snow body formed in this way, except those that were to face the wind, were closed by cardboard plates, and snow >0.30 m from the bottom of the wind tunnel was removed. The snow-cover surface was made as flat as possible. The front face of the snow cover was cut to make a 20° slope, and water was sprayed onto the slope until an ice layer formed. The snow density was 280 kg m–3 and crystals were in the first stage of new-snow metamorphism. The experimental set-up is schematically shown in Figure 1.
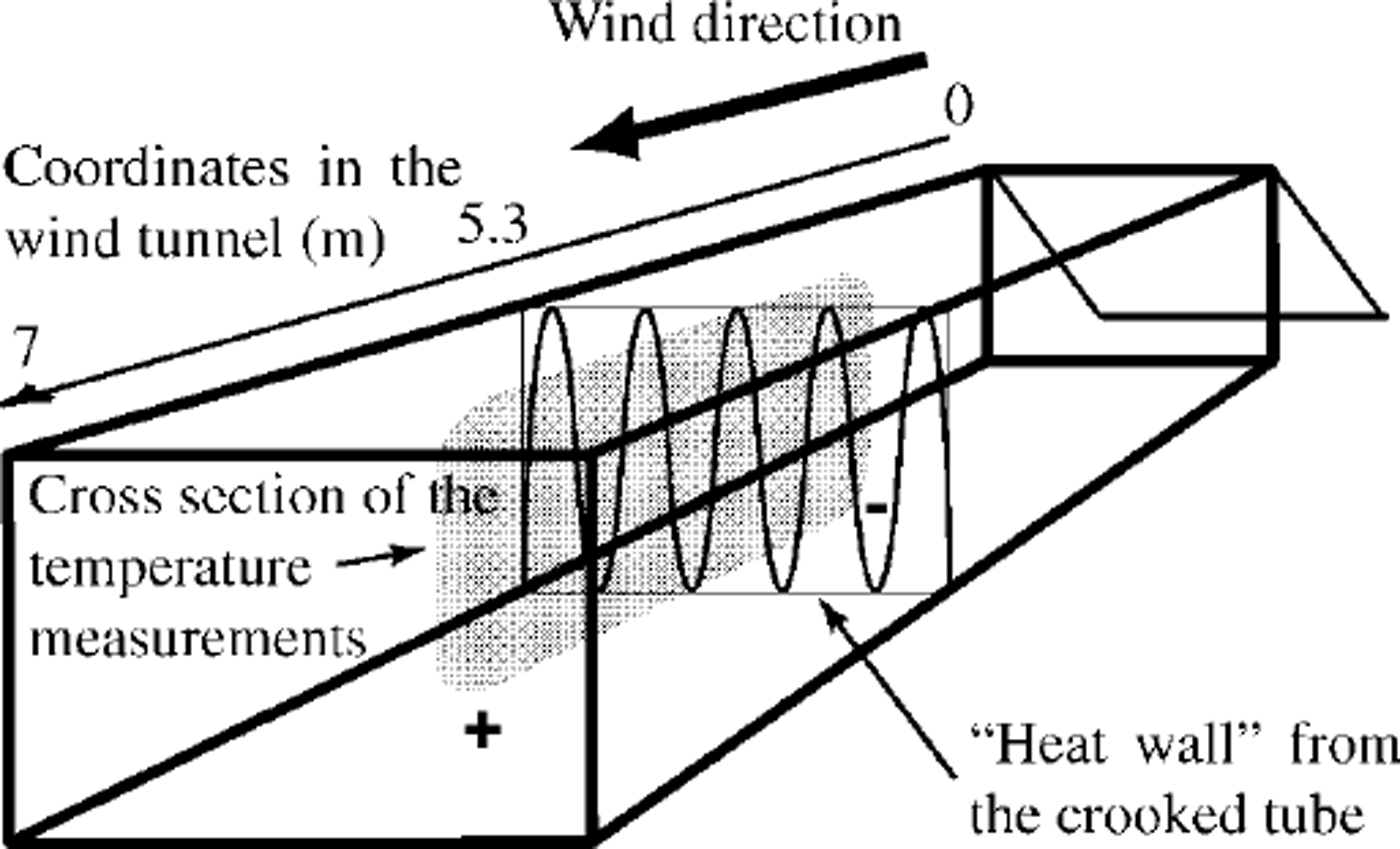
Fig. 1. Scheme of the experimental set-up. The ˚wind tunnel-coordinate 0 is the top edge of the slope (see text). ˚Heat wall" position is the horizontal coordinate 0, and + and- represent the corresponding × coordinates in Figure 3
A crooked tube connected to a thermostat was situated about 1.5 m from the ˚end" of the snow cover, perpendicular to the wind direction over the entire snow-cover depth and width ("heat wall") (Fig. 1). The temperature field around the ˚heat wall" in ˚geometrical" interpretation was expected to be symmetrical without wind (temperature approximately the same at the same depth and distance, but ˚before" and ˚after" the ˚heat wall" relative to the selected coordinates). In case of a horizontal air-flux presence in the pore space, the total heat-flux non-symmetry related to the opposite conductive heat-flux direction ˚before" and ˚after" the ˚heat wall" could form observable non-symmetry of the temperature field. The ˚heat wall" was thus required to be perpendicular to the expected horizontal air flux in the pore space, though such conditions would not be found in Nature.
The wind characteristics were as follows: The turbulent intensity in the near-surface 0.10–0.15 m layer could be up to 15%. The frequency of wind-speed fluctuation was on the order of 100 Hz. Examples of wind profile at several wind-measurement positions are shown in Figure 2. It can be seen that the maximum near-surface wind speed is on the top edge of the slope (position 0 in Fig. 1). It then decreased, probably because of the air-pressure change related to the ˚wind-propagation" process, and increased again to the temperature-measurement position (5.3 m). For further calculations, we assumed that at the temperature-measurement position it was already in equilibrium with snow conditions, especially as the near-surface wind speeds at 0 and 5.3 m were almost equal. However, it is possible that the wind was accelerated at the temperature-measurement position, which could influence the air flux in the pore space of snow.
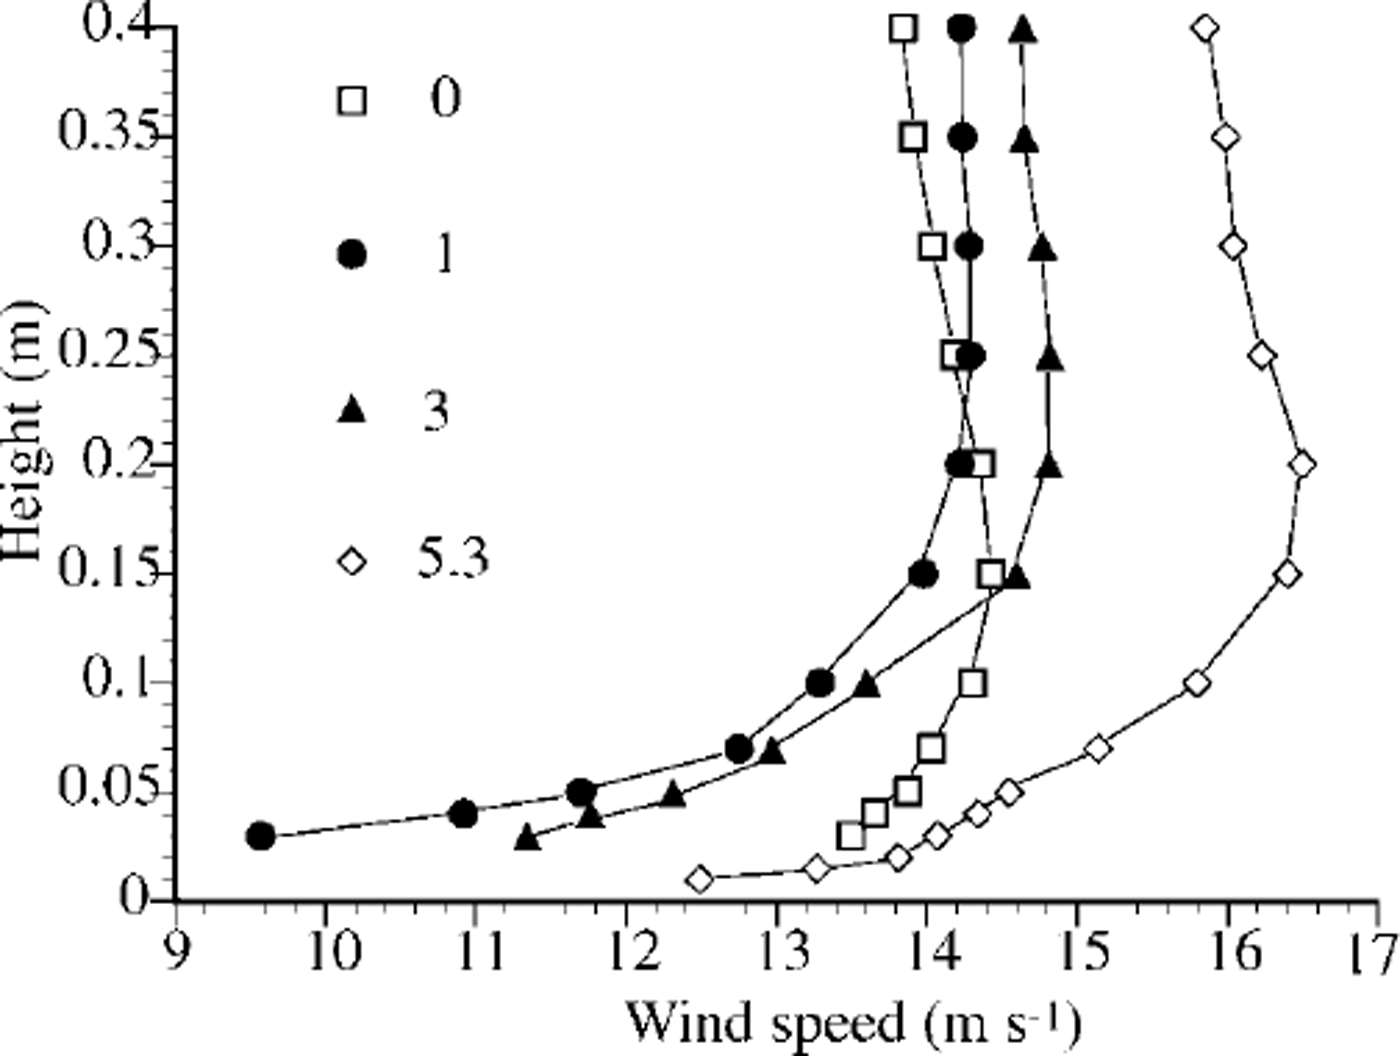
Fig. 2. Wind profiles over snow surface. The numbers show distance from top edge of the slope, in m (see Fig. 1).
Temperatures were measured by 30 thermocouples situated in a central cross-section, schematically shown in Figure 1, parallel to the wind direction. Thermocouples were positioned around the crooked tube before the surrounding space was filled with snow, and their positions were determined at the end of the experiment. Figure 3 presents the coordinate system of thermocouples used in further calculations. 0 on the × axis corresponds to the position of the ˚heat wall". The y axis presents the depth of the thermocouples.
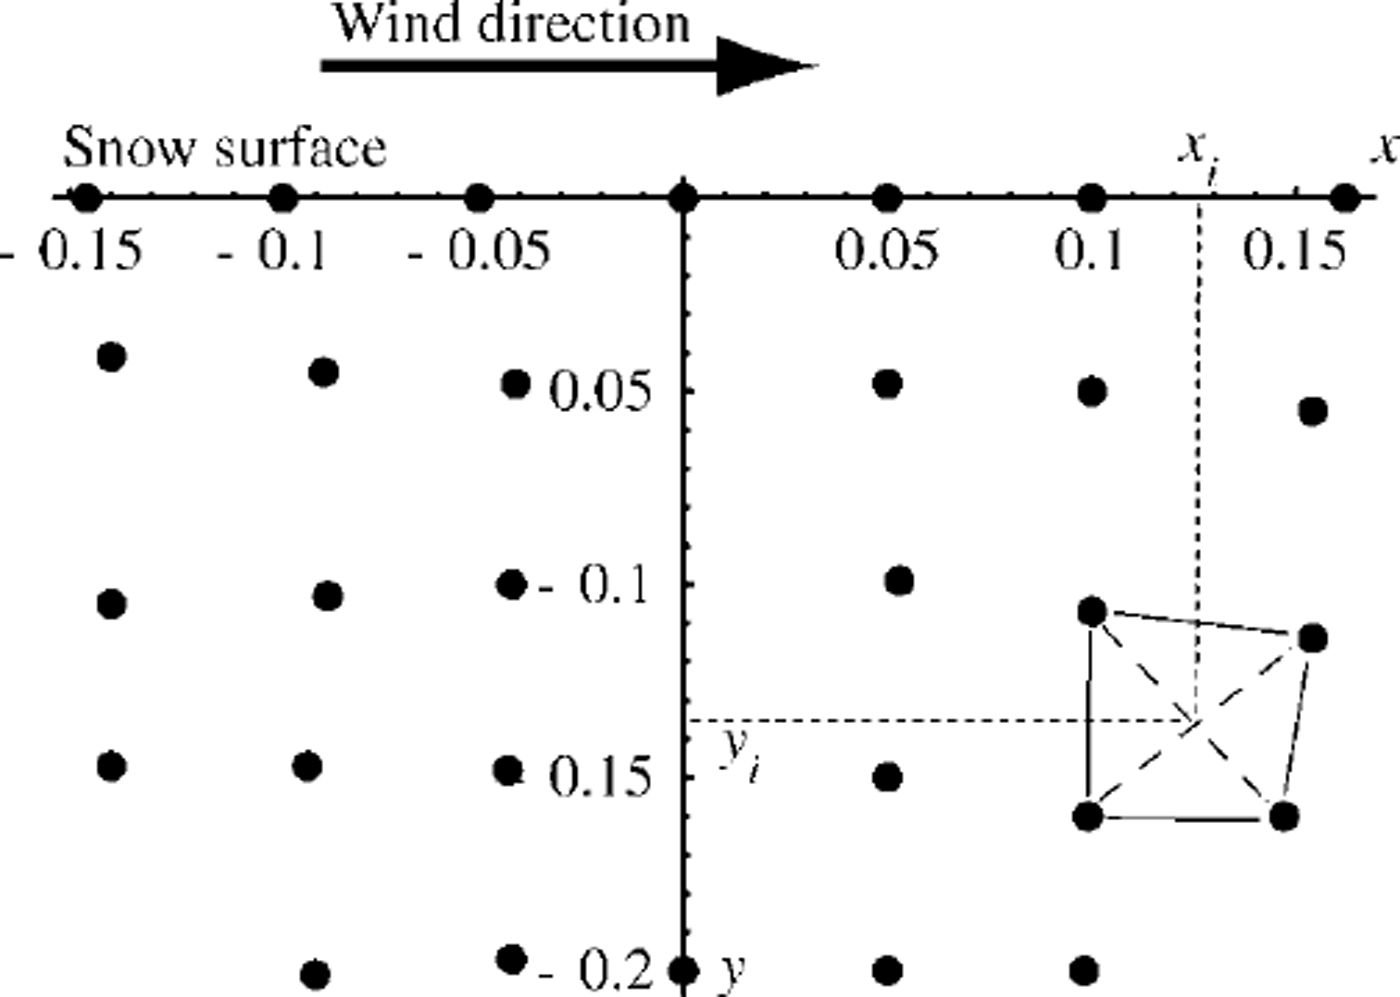
Fig. 3. Positioning of thermocouples around the ˚heat wall" in experiment presented here, and illustration of the ˚temperature surface" construction.
All of the thermocouples were calibrated relative to one another by temperature measurements using a thermostat. The difference between them did not change with temperature (in accuracy of thermocouple, being ±0.1 °C), though the data differed up to 1.5°C between them. It was related instead to the way the logger interpreted the data from each thermocouple. The average value from all the thermocouples for each thermostat temperature during calibration was accepted to be the real temperature, and difference from this average value was considered as a necessary ˚correction coefficient" for each thermocouple. The temperature used in calculations was the result of adding the ˚correction coefficient" to the value actually obtained. The air temperature of the cold room ("outside" temperature and thus the temperature of the wind) was –14°C.
The experiment was done as follows: When the temperature of the snow became uniform and equal to the temperature ˚outside", the thermostat for the ˚heat wall" was set to another temperature (-32°, –23° or –4°C) and the change of temperature field in the snow was observed. After 12–18 h the temperature measured by the thermocouples no longer visibly changed. This situation was assumed to be a ˚quasi-steady state without wind". The wind was then switched on in the wind tunnel (7, 10.5 or 14 ms–1) and temperature change was again observed until no temperature change took place. This was assumed to be a ˚quasi-steady state with wind". The wind was switched off, and when a new quasi-steady-state condition without wind was attained for the same or another temperature in the thermostat a new run of measurements with wind was started.
The snow surface had to be renovated after each run, because of continuous settling of snow and the influence of wind on the micro-relief of the snow surface. The snow cover was therefore not exactly the same from run to run.
Experimental Data
As the neighboring thermocouples were not at exactly the same depth or distance from the ˚heat wall", the horizontal and vertical temperature gradients required for heat-conduction consideration could be calculated only for ˚temperature surfaces" between neighboring thermocouples. To have only one T value for each x/y pair in the cross-section of temperature measurements, we had to construct ˚mean temperature surface" between all the thermocouples. When considering positioning of the thermocouples in two dimensions, each of the four neighboring thermocouples represented a quadrangle of unrestricted form (Fig. 3). The two diagonals of the quadrangle intersected at a specific point with coordinates Xi/yi. In three dimensions, the same thermocouples represented four possible x/y/T planes which gave two possible T values for the xi/yi6 position. The mean of these two values Ti was used to construct the ˚mean temperature surface-between each of the four neighboring thermocouples.
Some examples of the observed temperatures are shown in Figures 4a and 5a for windless conditions, and Figures 4b and 5b for conditions with wind, in corresponding experimental runs. Figure 4 shows the results of measurements when the thermostat was colder, and Figure 5 when the thermostat was warmer, than the ˚outside" temperature. The x/y coordinates correspond to those in Figure 3. The third axis shows the measured temperature. The range of the temperature axis T corresponds to the maximum and minimum observed values in each case. The temperature gradients used in the present calculations were calculated for the three-dimensional triangles shown in Figures 4 and 5, each having at the top two x/y/T thermocouples and one corresponding xi/yi/Ti, point.

Fig. 4. Example of experimental data.Thermostattemperature –32°C; "outside"temperature –14°C. Coordinates × and y correspond to those in Figure 3 (a) Conditions without wind; dots show the positions of thermocouples; (b) conditions with wind (14 m sȡ1 ); dots are at the same level as in (a); (c) temperature difference between (a) and (b).

Fig. 5. Example of experimental data. Thermostat temperature –4°C; ˚outside" temperature –14°C. Coordinates × and y correspond to those in Figure 3. (a) Conditions without wind; dots show the positions of thermocouples; (b) conditions with wind (10.5 msȡ1 ); dots are at the same level as in (a); (c) temperature difference between (a) and (b).
The difference between the level of the thick dots in Figures 4b and 5b and the observed ˚temperature field" shows the change of quasi-steady temperature distribution related to the presence of air flux in the pore space. The same data in term of ˚fields" are presented in Figures 4c and 5c. The vertical axis in this case shows the temperature difference between conditions with and without wind ΔT in the observed range of such difference. It can be seen that the temperature change was relatively large and could only be the result of the presence of wind over snow. The data presented here and other experimental data show that the temperature change from the initial quasi-steady-state temperatures without wind was proportional to the difference between the ˚outside" and the controlled ˚heat-wall" temperatures, and that the higher the wind speed the larger was the observed temperature change.
The temperature difference between conditions without and with wind clearly shows the prevalence of horizontal air movement in snow. No evidence was found of convective cells constructed by wind, in contrast to what would be expected in case of stable air-pressure difference over the snow surface (vertical positioning of the ˚heat wall" did not allow the appearance of cells of natural convection). Data did not show changes of vertical temperature gradients comparable with those of horizontal temperature gradients.
It can be also seen that the air temperature in the pore space was different from that presented by thermocouples. The latter seems more likely to present the ice-matrix temperature, or at least to be closer to it than to the pore-air temperature. This conclusion was reached after realizing that even ˚after" the ˚heat wall", the ice matrix was still heated by the air flux when the thermostat temperature was lower than those of wind (positive temperature change in Fig. 4c); or still mostly cooled, or at least not heated, when the thermostat temperature was higher than the temperature ˚outside" (Fig. 5c).
Data Interpretation
We confined our attention to the horizontal component of the air flux because, as discussed above, this could be assumed to be the main process changing the observed temperature fields in our experiment. The step from the two-dimensional temperature data to a one-dimensional interpretation does of course reduce the accuracy of the final results. However, omitting the vertical components of the air flux would not be expected to change the order of the calculated values of the air flux in the pore-space velocity. The main purpose of the present experimental work was to determine whether or not air flux in snow appears in windy conditions. That is why the possibility of calculating a range of air-flux velocities to compare with previously published theoretical ones, without the need to construct a complicated physical model of the process, was attractive in presenting the first results of such experimental work.
The data interpretation used below required the selection of pairs of triangles (temperature gradients) at approximately the same depth and distance from the ˚heat wall", but one ˚before" and the other ˚after" the ˚heat wall". The pair for a triangle ˚before" was a triangle ˚after" (Figs 4 and 5), whose geometrical mass center (taking × with opposite sign) was inside the triangle ˚before", and which had maximal intersection of x/y area among others triangles ˚after". Not every triangle could have a pair. A total of 15 or 20 pairs could be selected (15 when one thermocouple did not work).
The horizontal air-flux velocity in the pore space of snow was calculated as follows: Each triangle on temperature-field graphs represented two temperature gradients: the horizontal (∂T/∂x) and the vertical (∂T/∂y). The actual air flux in snow was three-dimensional, but as the temperature distribution was measured in the central cross-section of snow parallel to the wind direction, the influence of wind was expected to be approximated by these two-dimensional characteristics.
In quasi-steady-state conditions without wind over the snow surface, these temperature gradients had to describe the heat flux q in the direction to or from the ˚heat wall" as:


where kc is the heat conductivity coefficient due to pure conduction, Lv is the latent heat of vaporization, F is the water-vapor flux, D∊ is the effective water-vapor diffusion coefficient, C is the water-vapor concentration, subscripts "h" and "v" present the horizontal and vertical directions respectively, and superscript "i" corresponds to conditions without wind. Simple geometrical interpretation leads to the following combination of Equations (1) and (2) for describing the overall heat flux:

At the same depth and the same distance from the heat wall, but on opposite sides from it ("symmetrical positions"), the initial quasi-steady-state heat fluxes had to be equal in absolute value if snow was uniform.
For the quasi-steady-state conditions when wind was involved in the heat-transfer process (superscript "w" in further equations), the heat-flux description included an additional term: heat transported by air flux.
Thus, when assuming the air flux in the pore space to be horizontal:

where V is the volume of air transferred in the pore space, related to the horizontal air-flux velocity U as

p is the air density (superscript ˚a" corresponds to temperature conditions in porous air), cp is specific heat and </> is the snow porosity.
The temperature gradients in the pore space were smaller than those measured, allowing the water-vapor flux presented in Equation (3) to be described as driven mostly by horizontal air flux:
where Cs is the saturated water-vapor concentration in the pore space. The modeling presented in Reference Albert and McGilvaryAlbert and McGilvary (1992) supports such simplification. The water-vapor flux in the vertical direction (Equation (4)) in the presence of wind should be related to even smaller vertical temperature gradients in the pore space and could be safely equated to 0.
On this interpretation the temperature gradients presented by each triangle could be considered as characteristics of the conductive part of the heat flux, not necessarily being in the same direction as the overall heat flux.
When horizontal air flux was involved, the absolute values of the heat fluxes in symmetrical positions became different because the air flux had different directions ˚before" and ˚after" the ˚heat wall" than those of conduction. This total heat-flux difference partly explains the non-symmetry of the temperature field (Figs 4 and 5). Change in the heat content of the horizontal air flux from a position ˚before" to one ˚after" the ˚heat wall" also contributed to the observed non-symmetry
Not knowing the heat produced on the ˚heat wall", it was not possible to calculate the horizontal air flux directly from such a difference. However, the difference between remainders
![]() and
and
![]() ders and A (the negative subscript indicates positions ˚before" the ˚heat wall", and the positive subscript positions ˚after" it relative to the wind direction) in symmetrical positions, when assuming V to be uniform for the same depth, could only be due to difference in heat content of the horizontal air flux. For all the assumptions used above, the following equation can be written (based on Equations (1), (3) and (6)):
ders and A (the negative subscript indicates positions ˚before" the ˚heat wall", and the positive subscript positions ˚after" it relative to the wind direction) in symmetrical positions, when assuming V to be uniform for the same depth, could only be due to difference in heat content of the horizontal air flux. For all the assumptions used above, the following equation can be written (based on Equations (1), (3) and (6)):

where v could be recalculated to the horizontal air-flux velocity by Equation (5).
The righthand side of Equation (7) could be calculated directly from the measured temperatures. We took the heat conductivity of the ice-matrix value from the relationship presented in Reference Sturm, Holmgren, Konig and MorrisSturm and others (1997) for the corresponding density range. The effective water-vapor diffusion coefficient was accepted to be close to those of free air. The error in temperature-gradient calculation produced by inaccurate determination of thermocouple coordinates could be neglected in calculations using Equation (7) when selected symmetric temperature triangles were compared.
However, the lefthand side of Equation (7) produces, not a value, but a range of possible heat content in air-flux differences. The following assumptions were made for this range calculation: The higher the horizontal air-flux velocity, the lower is the air-content difference between symmetrical positions. The air-flux temperature decreases on its way through the ˚heat wall" when the thermostat temperature is lower than the outside temperature, and increases when it is higher than the outside temperature. The pore air temperature ˚before" the ˚heat wall" is in the range between the measured and the outside temperatures, while the air temperature ˚after" the heat wall is in a wider range, between the thermostat and outside temperatures.
The requirement for a successful air-flux velocity calculation was the same sign for the right- and lefthand side of Equation (7) for all the selected pairs. Analysis shows that the righthand side of Equation (7) was mostly positive for the ˚cold" thermostat run and negative for the ˚warm" thermostat run, which was accepted as correct. The few exceptions (1–2 pairs in each run) were attributed to inaccurate determination of the temperature gradient, to opposite heat-exchange directions for the ice matrix and the air, or to the vertical component of the air flux in the pore space of snow. We decided to exclude such pairs from further interpretation, especially as the sign on the lefthand side could be opposite to the sign on the righthand side in other cases. In the run with a wind speed of 14 m s–1 and in the run with the ˚warm" thermostat, this forced the exclusion of two more pairs. But for lower wind speeds there were six such pairs in both cases; such pairs, though excluded from calculations in the present work, should therefore be carefully analyzed in future, more detailed, three-dimensional modeling of the process. The reason for such a contradiction of what would be expected from the above relationships could be simply inaccuracy of temperature interpolation at four plain surfaces between four thermocouples. But there could also be a physical reason, not included in Equation (7).
According to the above considerations, the maximum possible difference in horizontal air-flux heat content could be when the pore air temperature changed up to the thermostat temperature. This enables us to calculate the minimum possible horizontal air-flux velocity.
The horizontal air-flux heat-content term that was most sensitive to temperature was the air density, which increased with decrease in temperature. Considering that the temperature changed only from that of the ice matrix ˚before" to that ˚after" the ˚heat wall", the maximum possible horizontal air-flux velocity could be calculated. If the real pore air temperature was higher than that of the ice matrix in both positions, but the difference in pore air temperatures at symmetrical positions was not less than the difference in ice-matrix temperatures here, the heat-content change was still between the calculated maximum and minimum values.
An example of the ranges of horizontal air-flux velocity in the pore space calculated this way is shown in Figure 6. Of course, not all the maxima obtained were reasonable. The temperature difference between corresponding triangles was on the order of l0–1˚C When the difference was small the accuracy of thermocouples became important. The gradients calculated near the snow surface were based on the thermocouples situated on the snow surface. Settling of snow caused some of them to be over the snow surface at the end of the experimental run, and these cannot be compared with the gradients on the depth. Most of the calculated maxima were of the same order, which can be considered as the representative one.
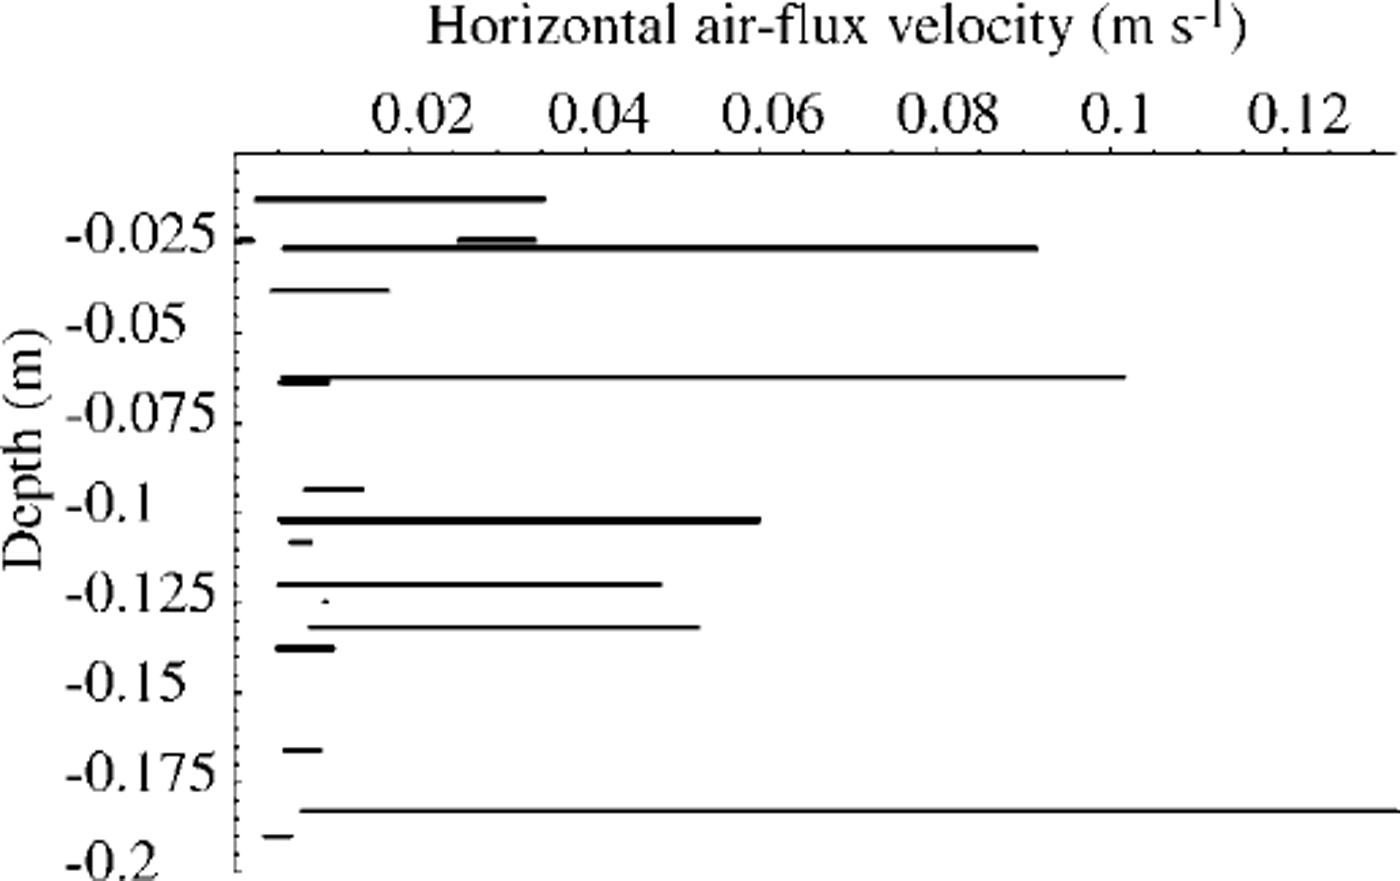
Fig. 6. Example of calculated ranges of the horizontal air flux in the pore space of snow velocities. Thermostat temperature –32°C; wind speed 14 ms-1
For the same direction of the measured temperature change ˚before" and ˚after" the ˚heat wall" under present experimental conditions, it is more likely that the air temperature was always higher than the ice-matrix temperature when the thermostat was colder than the ˚outside" temperature. At least it never achieved the thermostat temperature, so the actual horizontal air-flux velocities must have been slightly less than the ˚maximum" values in the ranges. Excluding the unreasonably high values related to the inaccuracy of the thermocouples or to the vertical component of the air flux in the pore space not included in the equations, a rather logical pattern of horizontal air-flux velocity change with depth, and horizontal air-flux velocity relation to the wind speed over the snow surface, can be seen (dashed lines in Fig. 7).
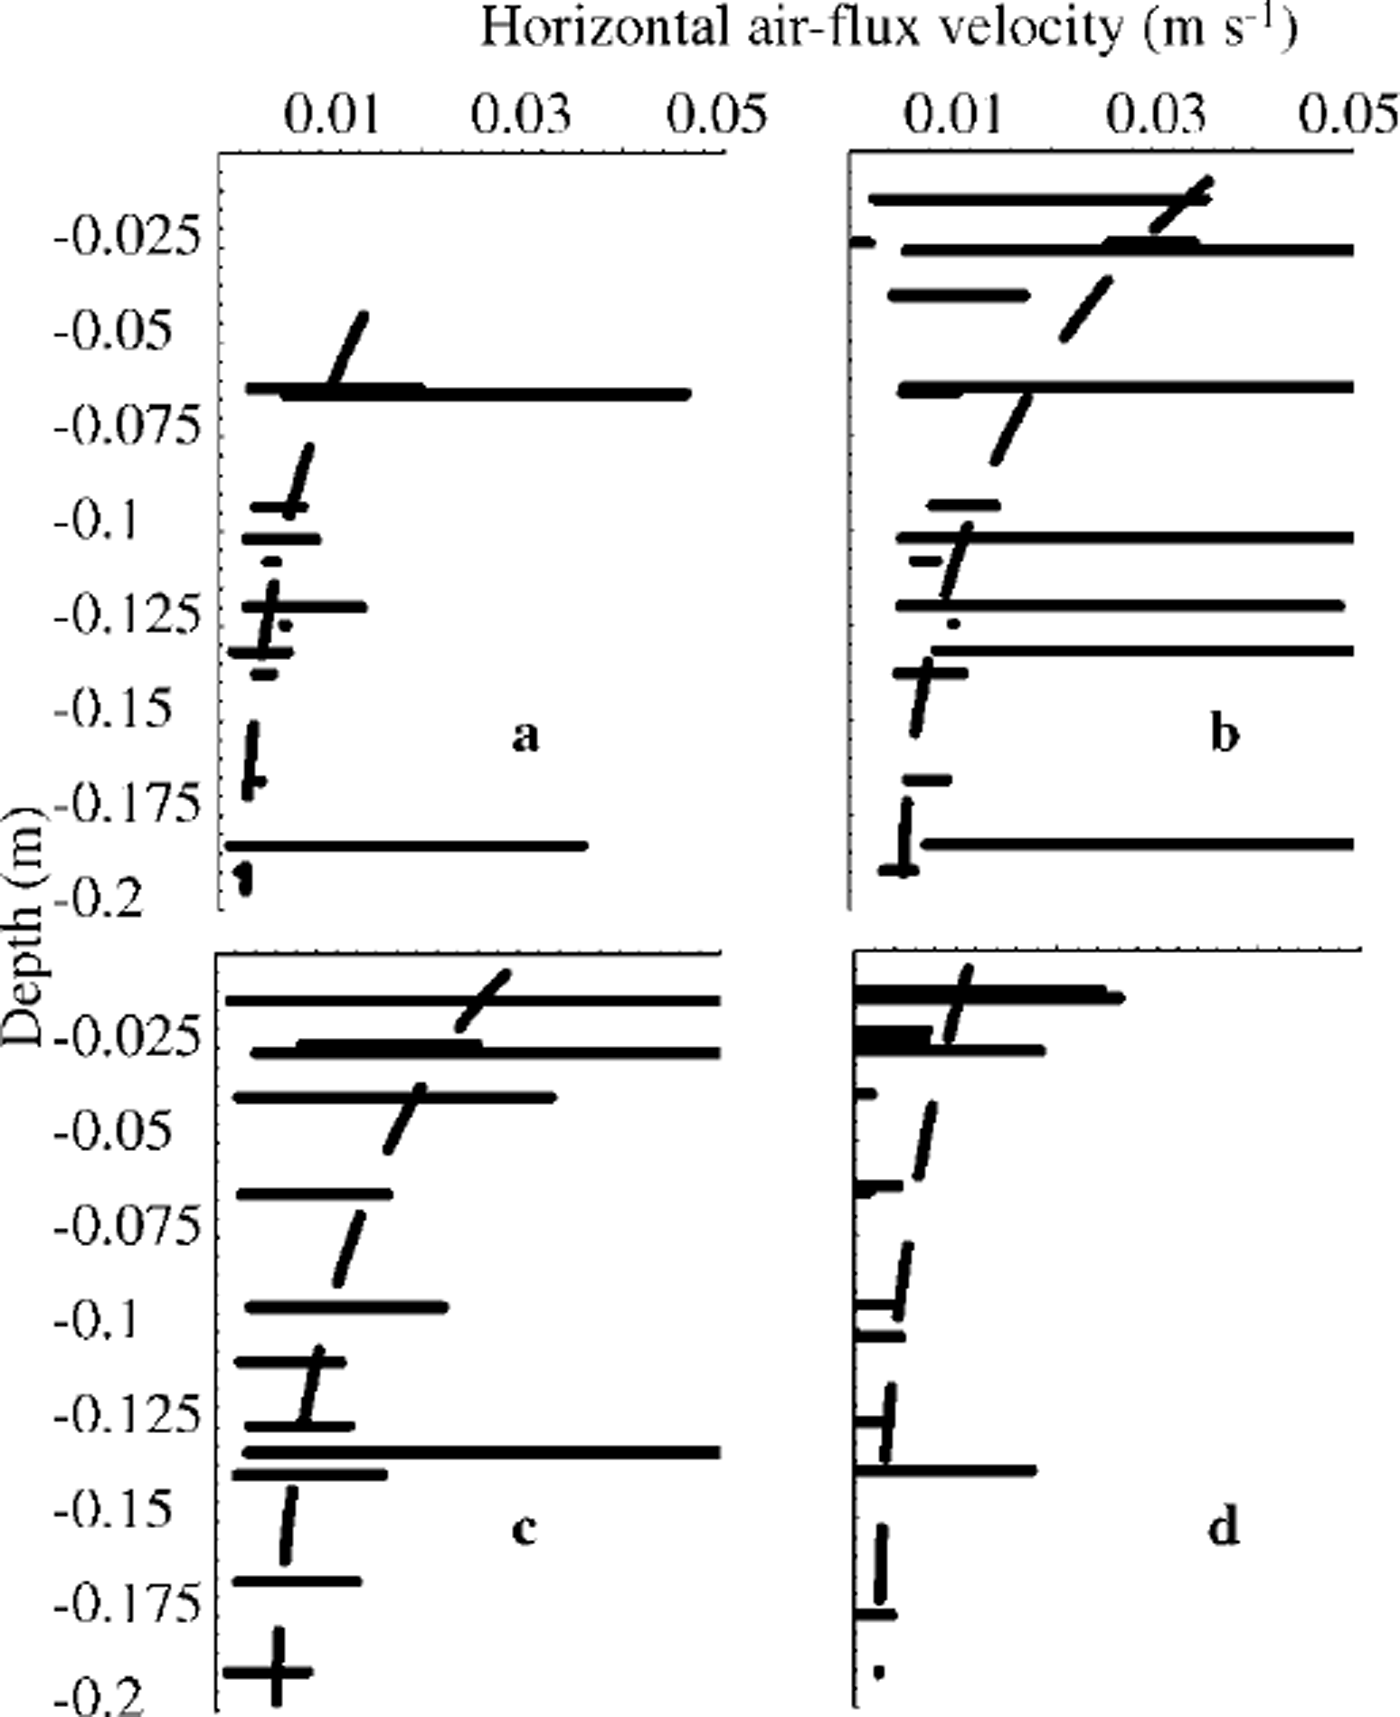
Fig. 7. Air flux in the pore space velocities and their change with depth, (a) Thermostat temperature –32˚Cwind speed 7m s-1 ; (b) thermostat temperature-32° C; wind speed 14 m s–1 ; (c) thermostat temperature –23°C; wind speed 10.5 ms–1 ; (d) thermostat temperature-4°C; wind speed 10.5 msȡ1 .
One more point must be noted regarding the relation of the calculated horizontal air flux velocity to the wind speed. The temperature difference between thermostat and cold room and the wind speeds were the same in experimental runs presented in Figure 7c and d. The data from Figure 7c seem to be between those of lower (Fig. 7a) and higher (Fig. 7b) wind-speed conditions. However, Figure 7d presents noticeably lower values of the possible air flux in the pore-space velocity. This can be explained by the fact that, in this case, air warmed after passing the ˚heat wall" had lower density than air over the snow surface. As a result, additional air from the atmosphere could be involved in the air flux in the pore space, changing the value of V. If so, the V+ values would be higher than the V- ones, and Equation (7) should give values of maximum horizontal air flux velocity smaller than the actual ones. The same air-density difference could result in more active vertical air moving in this experimental run. This also could lead to inaccurate horizontal air flux velocity calculations. For the case when the pore air was cooled by the thermostat, such processes most likely did not take place. The correct explanation can be found only after more accurate modeling of the process with consideration of both the horizontal and the vertical temperature gradients, which has recently been undertaken.
Conclusions
According to the data obtained, wind can produce air flux in the pore space of snow. For the present experimental conditions, the flux had the same order of velocity up to 0.2 m depth. The velocities obtained were in the same range as those measured directly in natural snow and those possible from the viewpoint of gas dynamics in porous media.
The experimental conditions cannot be compared with those of stagnant horizontal pressure drop over the surface, modeled in Reference ColbeckColbeck (1989). The large-scale pressure drop, if the wind-speed change over the snow surface in the present experiment can be interpreted this way, worked more likely on decrease of the horizontal air flux in the pore space at the measurement position. It does not mean that topographic forms on the snow surface will not influence the air flux in the pore space, but it can be concluded that they are not the main reason for such flux appearance.
For present experiments, the bottom of the snow cover was plate (similar to natural snow cover on the ground, but different from conditions on polar glaciers), while the air flux next to the snow surface was the result of interaction between high-speed wind and initially stagnant air in pores open to the atmosphere. Turbulence near the snow surface is the most probable reason for air flux in the pore-space formation. This could be produced by turbulent pressure fluctuations, considered in Reference Clarke and WaddingtonClarke and Waddington (1991), though theoretically such a process could not itself produce noticeable air flux in the pore space (Reference ColbeckColbeck, 1989). The horizontal air flux in the pore space could be enforced by the near-surface wind if it, as a result of turbulence, had mean direction under some angle to the snow surface, producing the ˚wind propagation" to snow. We believe that the concave air-flux velocity profiles support the latter idea.
The mechanism of interaction needs more detailed analysis than temperature-field observations can give. The values obtained confirm the need to include the horizontal air flux in the pore space in heat-balance calculations for snow, but force us to reconsider the theory of ˚wind propagation" to snow as a process related to "windpumping" only.
Acknowledgements
The work was partly supported by the Japan Science and Technology Agency through JST and JISTEC. The authors are grateful to T. Sato and K. Kosugi for measurements of the wind characteristics in the wind tunnel and to Y. Kamata for help with the experimental set-up and for maintaining the laboratory equipment during the measurements. We thank M. R. Albert for very useful comments. We also thank an anonymous reviewer for helpful suggestions.


